

Temporal changes of COVID-19 pneumonia by mass evaluation using CT: a retrospective multi-center study
- PMID: 32953735
- PMCID: PMC7475384
- DOI: 10.21037/atm-20-4004
Temporal changes of COVID-19 pneumonia by mass evaluation using CT: a retrospective multi-center study
Abstract
Background: Coronavirus disease 2019 (COVID-19) has widely spread worldwide and caused a pandemic. Chest CT has been found to play an important role in the diagnosis and management of COVID-19. However, quantitatively assessing temporal changes of COVID-19 pneumonia over time using CT has still not been fully elucidated. The purpose of this study was to perform a longitudinal study to quantitatively assess temporal changes of COVID-19 pneumonia.
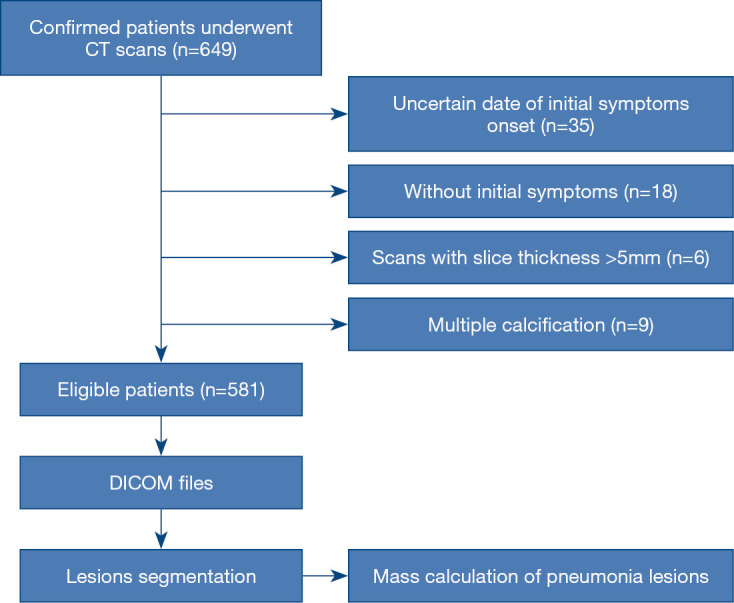
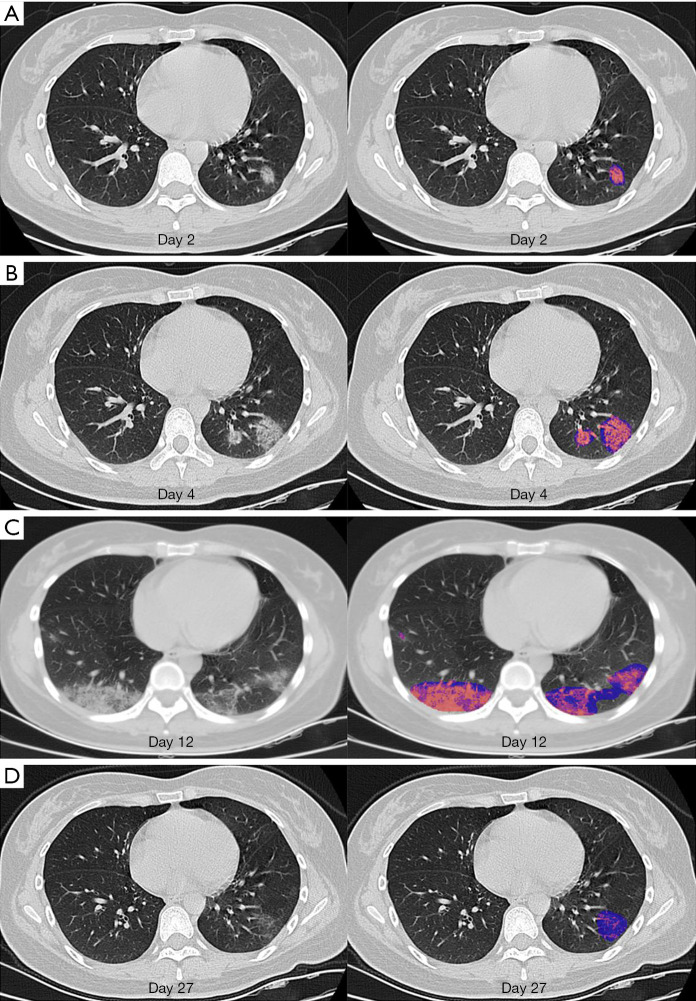
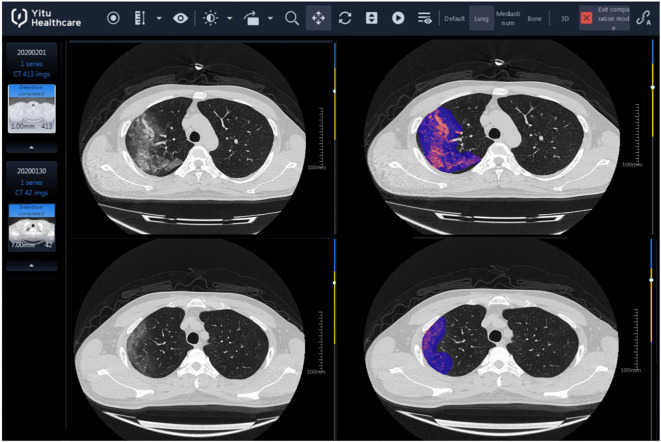
Methods: This retrospective and multi-center study included patients with laboratory-confirmed COVID-19 infection from 16 hospitals between January 19 and March 27, 2020. Mass was used as an approach to quantitatively measure dynamic changes of pulmonary involvement in patients with COVID-19. Artificial intelligence (AI) was employed as image segmentation and analysis tool for calculating the mass of pulmonary involvement.
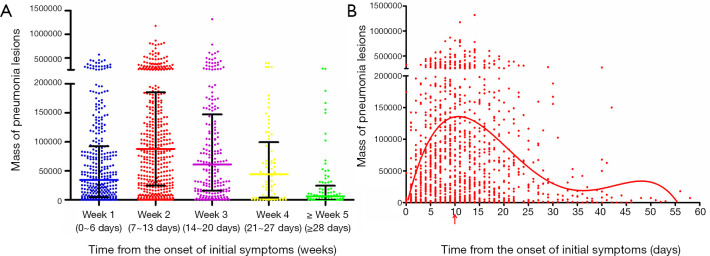
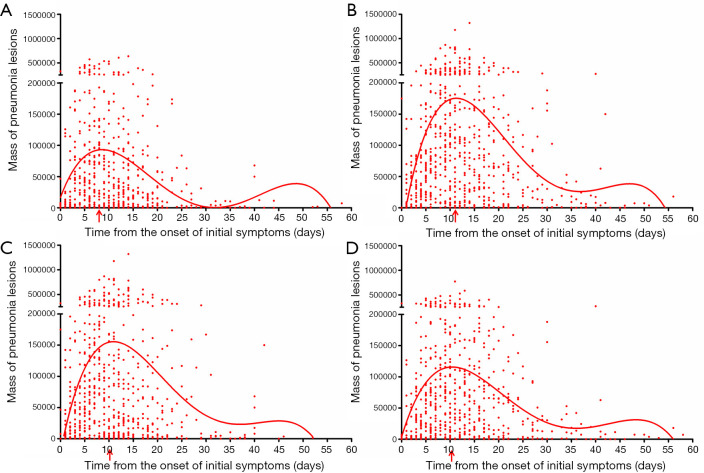
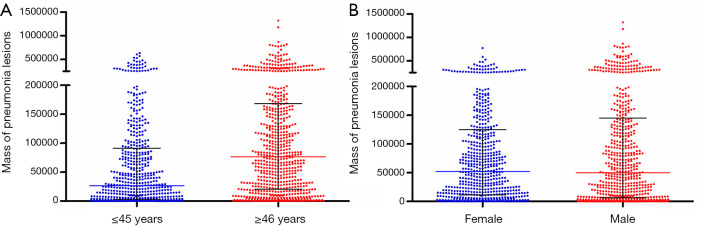
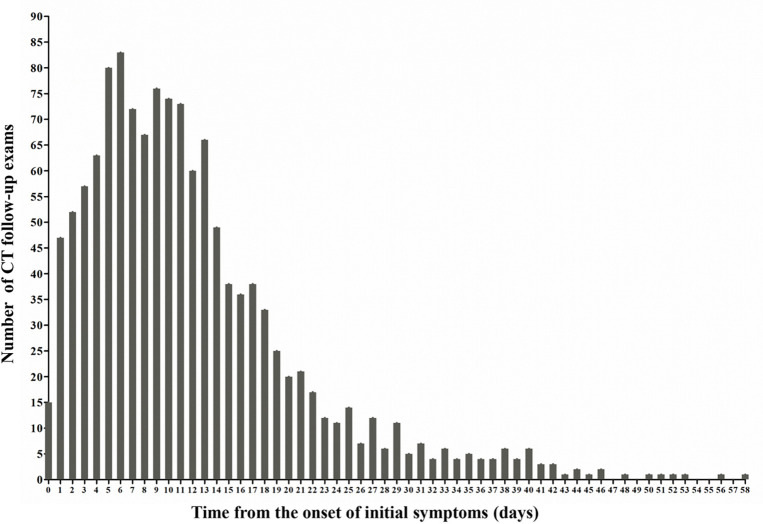
Results: A total of 581 confirmed patients with 1,309 chest CT examinations were included in this study. The median age was 46 years (IQR, 35-55; range, 4-87 years), and 311 (53.5%) patients were male. The mass of pulmonary involvement peaked on day 10 after the onset of initial symptoms. Furthermore, the mass of pulmonary involvement of older patients (>45 years) was significantly severer (P<0.001) and peaked later (day 11 vs. day 8) than that of younger patients (≤45 years). In addition, there were no significant differences in the peak time (day 10 vs. day 10) and median mass (P=0.679) of pulmonary involvement between male and female.
Conclusions: Pulmonary involvement peaked on day 10 after the onset of initial symptoms in patients with COVID-19. Further, pulmonary involvement of older patients was severer and peaked later than that of younger patients. These findings suggest that AI-based quantitative mass evaluation of COVID-19 pneumonia hold great potential for monitoring the disease progression.
Keywords: Coronavirus disease 2019 (COVID-19); artificial intelligence (AI); chest CT; temporal changes.
2020 Annals of Translational Medicine. All rights reserved.
Conflict of interest statement
Conflicts of Interest: All authors have completed the ICMJE uniform disclosure form (available at http://dx.doi.org/10.21037/atm-20-4004). The authors have no conflicts of interest to declare.
Figures
Similar articles
-
Time Course of Lung Changes at Chest CT during Recovery from Coronavirus Disease 2019 (COVID-19).Radiology. 2020 Jun;295(3):715-721. doi: 10.1148/radiol.2020200370. Epub 2020 Feb 13. Radiology. 2020. PMID: 32053470 Free PMC article.
-
Quantification of COVID-19 Opacities on Chest CT - Evaluation of a Fully Automatic AI-approach to Noninvasively Differentiate Critical Versus Noncritical Patients.Acad Radiol. 2021 Aug;28(8):1048-1057. doi: 10.1016/j.acra.2021.03.001. Epub 2021 Mar 6. Acad Radiol. 2021. PMID: 33741210 Free PMC article.
-
From community-acquired pneumonia to COVID-19: a deep learning-based method for quantitative analysis of COVID-19 on thick-section CT scans.Eur Radiol. 2020 Dec;30(12):6828-6837. doi: 10.1007/s00330-020-07042-x. Epub 2020 Jul 18. Eur Radiol. 2020. PMID: 32683550 Free PMC article.
-
Temporal Changes of CT Findings in 90 Patients with COVID-19 Pneumonia: A Longitudinal Study.Radiology. 2020 Aug;296(2):E55-E64. doi: 10.1148/radiol.2020200843. Epub 2020 Mar 19. Radiology. 2020. PMID: 32191587 Free PMC article.
-
AI-Based Quantitative CT Analysis of Temporal Changes According to Disease Severity in COVID-19 Pneumonia.J Comput Assist Tomogr. 2021 Nov-Dec 01;45(6):970-978. doi: 10.1097/RCT.0000000000001224. J Comput Assist Tomogr. 2021. PMID: 34581706 Free PMC article.
Cited by
-
High resolution chest computed tomography findings in patients with clinically suspected COVID-19 pneumonia in Uganda: a cross-sectional study.Afr Health Sci. 2023 Dec;23(4):85-101. doi: 10.4314/ahs.v23i4.12. Afr Health Sci. 2023. PMID: 38974254 Free PMC article.
-
Should CT be used for the diagnosis of RT-PCR-negative suspected COVID-19 patients?Clin Respir J. 2021 May;15(5):491-498. doi: 10.1111/crj.13332. Epub 2021 Feb 2. Clin Respir J. 2021. PMID: 33484085 Free PMC article.
-
Phase 1 clinical trial for intravenous administration of mesenchymal stem cells derived from umbilical cord and placenta in patients with moderate COVID-19 virus pneumonia: results of stage 1 of the study.Am J Stem Cells. 2022 Jun 15;11(3):37-55. eCollection 2022. Am J Stem Cells. 2022. PMID: 35873716 Free PMC article.
-
COVID-19: Histopathological correlates of imaging patterns on chest computed tomography.Respirology. 2021 Sep;26(9):869-877. doi: 10.1111/resp.14101. Epub 2021 Jun 22. Respirology. 2021. PMID: 34159661 Free PMC article.
-
Longitudinal trajectories of pneumonia lesions and lymphocyte counts associated with disease severity among convalescent COVID-19 patients: a group-based multi-trajectory analysis.BMC Pulm Med. 2021 Jul 13;21(1):233. doi: 10.1186/s12890-021-01592-6. BMC Pulm Med. 2021. PMID: 34256743 Free PMC article.
References
LinkOut - more resources
Full Text Sources
Other Literature Sources