

Effect of combined chronic predictable and unpredictable stress on depression-like symptoms in mice
- PMID: 32953742
- PMCID: PMC7475446
- DOI: 10.21037/atm-20-5168
Effect of combined chronic predictable and unpredictable stress on depression-like symptoms in mice
Abstract
Background: Mental stress mainly induces depression, and predictable stress, as well as a constant bombardment of chronic unpredictable micro-stressors, always coexist in daily life. However, the combined effect of predictable and unpredictable stress on depression is still not fully understood.
Methods: The chronic restraint stress (CRS) is to restrain the mice for 6 h per day for 3 weeks, and the chronic unpredictable mild stress (CUMS) is to stimulate the mice with 7 different stressors for 3 weeks. We evaluated the combined effect of CRS and CUMS on depression-like symptoms using behavioral tests and investigated the action mechanism through analysis of neurotransmitters, brain-derived factors, inflammatory factors, antioxidants, and intestinal microorganisms.
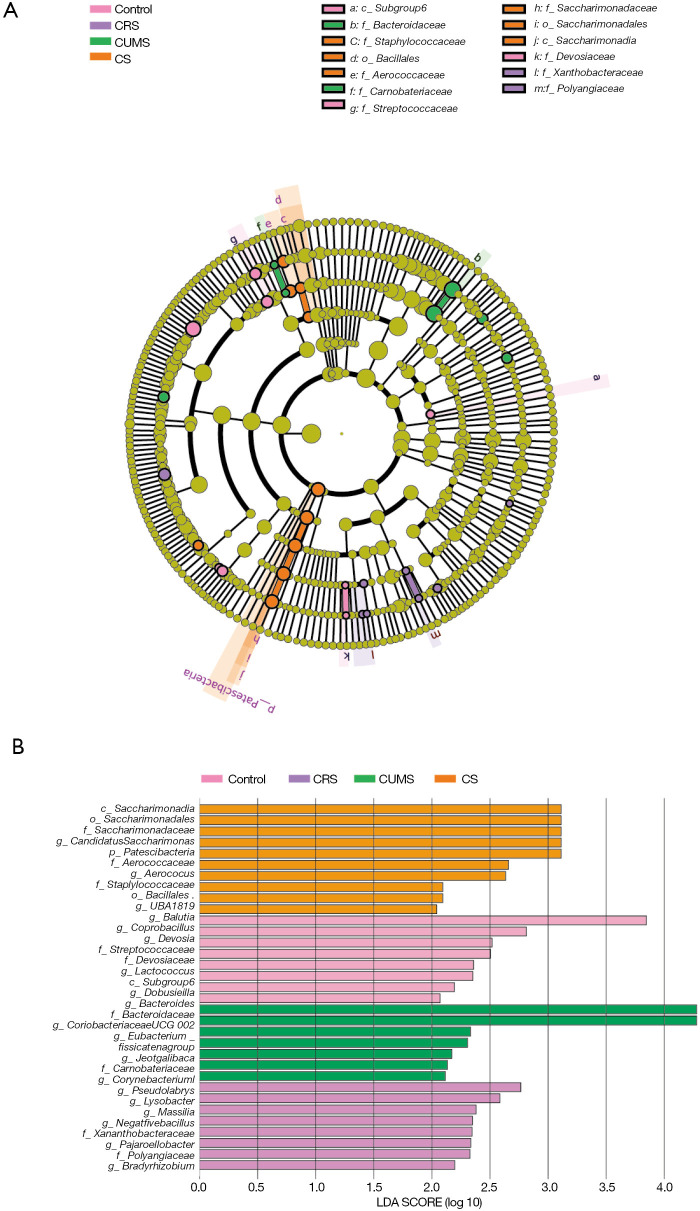
Results: Our data suggested the combined stress of CRS and CUMS caused significant weight loss, food intake reduction, depression-like behaviors-including anhedonia, learned helplessness, and reduction in spontaneous activity-and even atrophy and severe structural damage to the hippocampus in mice. Our pathogenesis study showed that combined stress-induced the reduction of glucocorticoid receptor (GR) levels, loss of oligodendrocytes (NG2 and Olig2 cells), and inhibition of neuron proliferation in the CA1, CA3, and DG regions of the hippocampus, decreased the contents of monoamine neurotransmitters (5-HT and NE) and BDNF in the cerebral cortex, caused hyperactivity of the HPA system, led to immune dysfunction, aggravated oxidative stress, and weakened the capacity of antioxidants in mice. Compared with single stress, combined stress gave rise to a more significant diversity change of the gut microbiota.
Conclusions: Combined stress caused significant depression-like behaviors, atrophy, and severe structural damage to the hippocampus in mice via monoamine neurotransmitter, BDNF, HPA axis, neurogenesis, and neurodegenerative, immune, oxidative stress and gut-brain axis action pathways.
Keywords: Depression; chronic bondage stress; chronic unpredictability mild stress; combined stress; predictable stress.
2020 Annals of Translational Medicine. All rights reserved.
Conflict of interest statement
Conflicts of Interest: All authors have completed the ICMJE uniform disclosure form (available at http://dx.doi.org/10.21037/atm-20-5168). The authors have no conflicts of interest to declare.
Figures


Similar articles
-
Therapeutic potential of silymarin in chronic unpredictable mild stress induced depressive-like behavior in mice.J Psychopharmacol. 2018 Feb;32(2):223-235. doi: 10.1177/0269881117742666. Epub 2017 Dec 7. J Psychopharmacol. 2018. PMID: 29215318
-
Emodin opposes chronic unpredictable mild stress induced depressive-like behavior in mice by upregulating the levels of hippocampal glucocorticoid receptor and brain-derived neurotrophic factor.Fitoterapia. 2014 Oct;98:1-10. doi: 10.1016/j.fitote.2014.06.007. Epub 2014 Jun 14. Fitoterapia. 2014. PMID: 24932776
-
Antidepressant-like Effect of Bacopaside I in Mice Exposed to Chronic Unpredictable Mild Stress by Modulating the Hypothalamic-Pituitary-Adrenal Axis Function and Activating BDNF Signaling Pathway.Neurochem Res. 2017 Nov;42(11):3233-3244. doi: 10.1007/s11064-017-2360-3. Epub 2017 Jul 31. Neurochem Res. 2017. PMID: 28758176
-
Antidepressant-like effects and cognitive enhancement of the total phenols extract of Hemerocallis citrina Baroni in chronic unpredictable mild stress rats and its related mechanism.J Ethnopharmacol. 2016 Dec 24;194:819-826. doi: 10.1016/j.jep.2016.09.023. Epub 2016 Sep 10. J Ethnopharmacol. 2016. PMID: 27623554
-
Neuroendocrine pathogenesis of perimenopausal depression.Front Psychiatry. 2023 Mar 30;14:1162501. doi: 10.3389/fpsyt.2023.1162501. eCollection 2023. Front Psychiatry. 2023. PMID: 37065890 Free PMC article. Review.
Cited by
-
Diosgenin alleviates alcohol-mediated escalation of social defeat stress and the neurobiological sequalae.Psychopharmacology (Berl). 2024 Apr;241(4):785-803. doi: 10.1007/s00213-023-06509-1. Epub 2024 Feb 5. Psychopharmacology (Berl). 2024. PMID: 38311692
-
Acetylcholine promotes chronic stress-induced lung adenocarcinoma progression via α5-nAChR/FHIT pathway.Cell Mol Life Sci. 2023 Apr 7;80(5):119. doi: 10.1007/s00018-023-04742-7. Cell Mol Life Sci. 2023. PMID: 37029227 Free PMC article.
-
A study on the differences in the gut microbiota and metabolism between male and female mice in different stress periods.Exp Biol Med (Maywood). 2025 Feb 11;250:10204. doi: 10.3389/ebm.2025.10204. eCollection 2025. Exp Biol Med (Maywood). 2025. PMID: 40008145 Free PMC article.
-
Bifidobacterium breve BB05 alleviates depressive symptoms in mice via the AKT/mTOR pathway.Front Nutr. 2025 Jan 30;12:1529566. doi: 10.3389/fnut.2025.1529566. eCollection 2025. Front Nutr. 2025. PMID: 39949541 Free PMC article.
-
Indole Acetic Acid Exerts Anti-Depressive Effects on an Animal Model of Chronic Mild Stress.Nutrients. 2022 Nov 25;14(23):5019. doi: 10.3390/nu14235019. Nutrients. 2022. PMID: 36501051 Free PMC article.
References
-
- Global Burden of Disease Study 2013 Collaborators. Global, regional, and national incidence, prevalence, and years lived with disability for 301 acute and chronic diseases and injuries in 188 countries, 1990-2013: a systematic analysis for the Global Burden of Disease Study 2013. Lancet 2015;386:743-800. 10.1016/S0140-6736(15)60692-4 - DOI - PMC - PubMed
-
- Hamel C, Lang E, Morissette K, et al. Screening for depression in women during pregnancy or the first year postpartum and in the general adult population: a protocol for two systematic reviews to update a guideline of the Canadian Task Force on Preventive Health Care. Systematic Reviews 2019;8:27. 10.1186/s13643-018-0930-3 - DOI - PMC - PubMed
LinkOut - more resources
Full Text Sources
Miscellaneous