. 2020 Aug 8:18:504-524.
doi: 10.1016/j.omto.2020.08.005. eCollection 2020 Sep 25.

CAR-T Cells Targeting Epstein-Barr Virus gp350 Validated in a Humanized Mouse Model of EBV Infection and Lymphoproliferative Disease

Affiliations

CAR-T Cells Targeting Epstein-Barr Virus gp350 Validated in a Humanized Mouse Model of EBV Infection and Lymphoproliferative Disease

Constanze Slabik et al. Mol Ther Oncolytics. .

Abstract

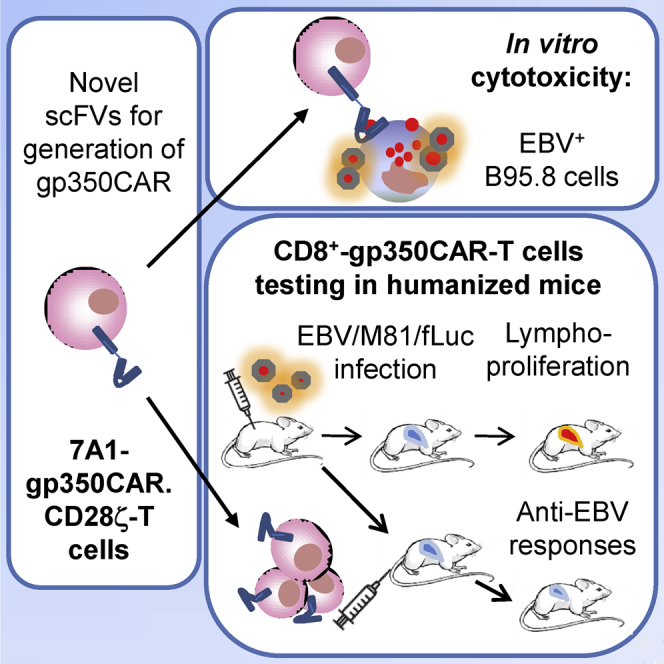
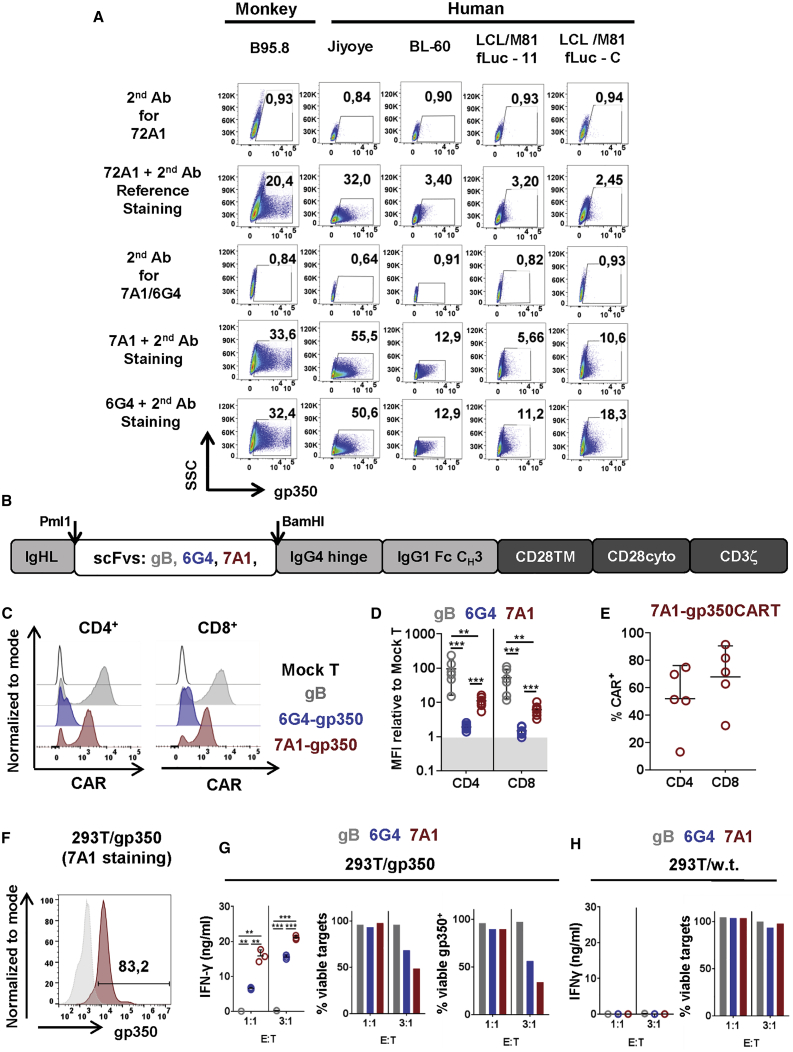
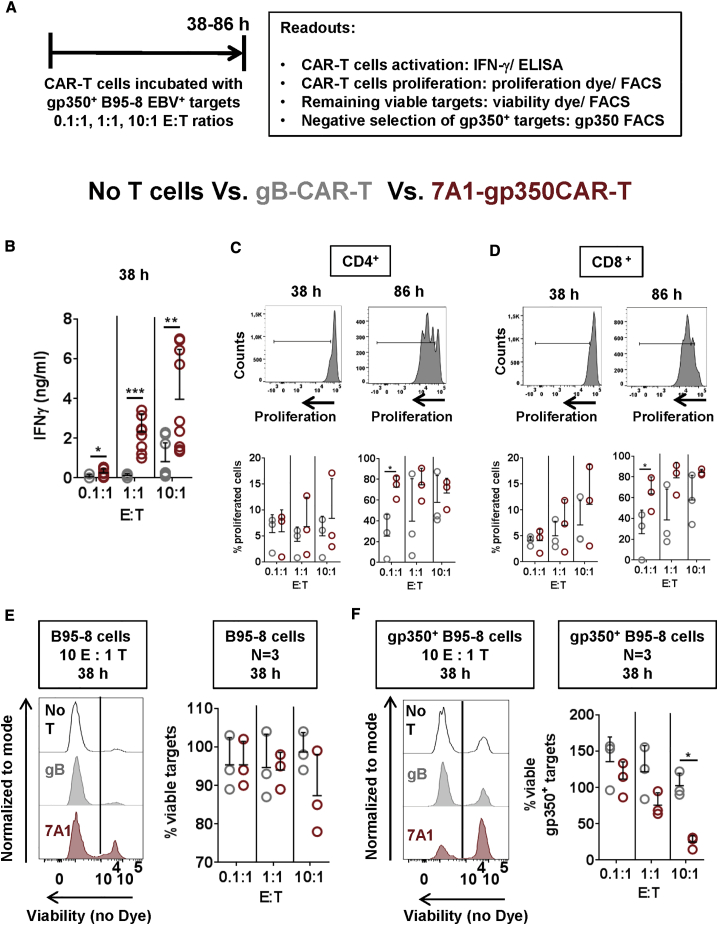
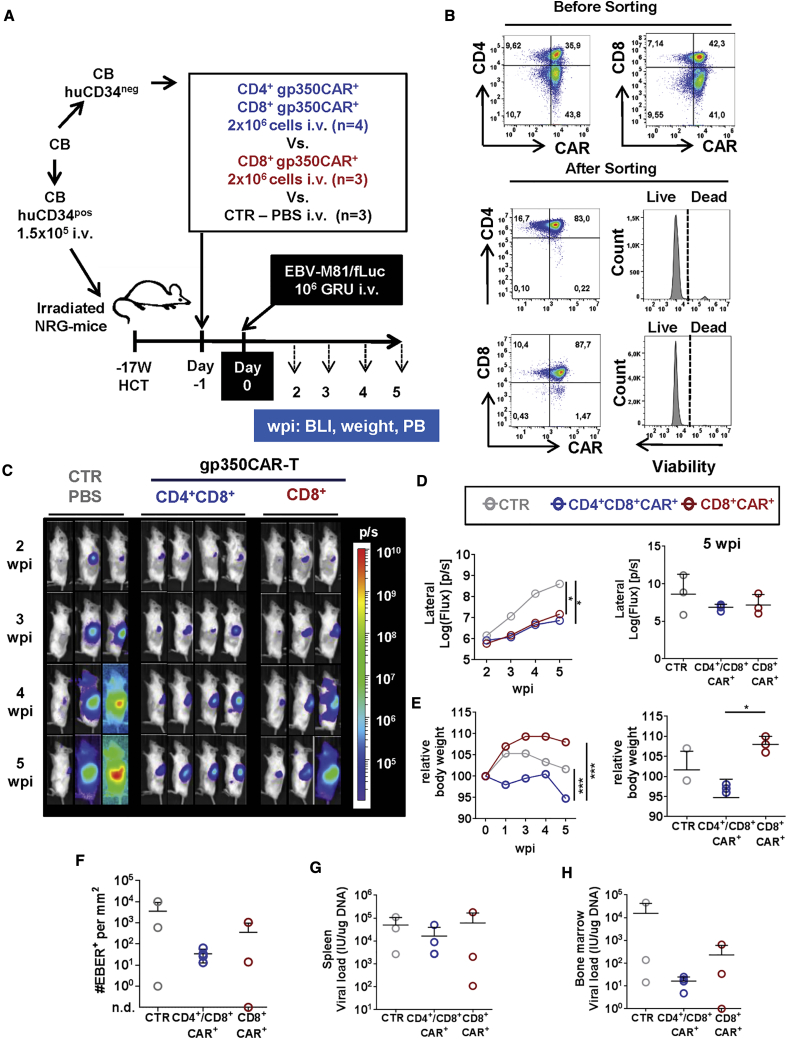
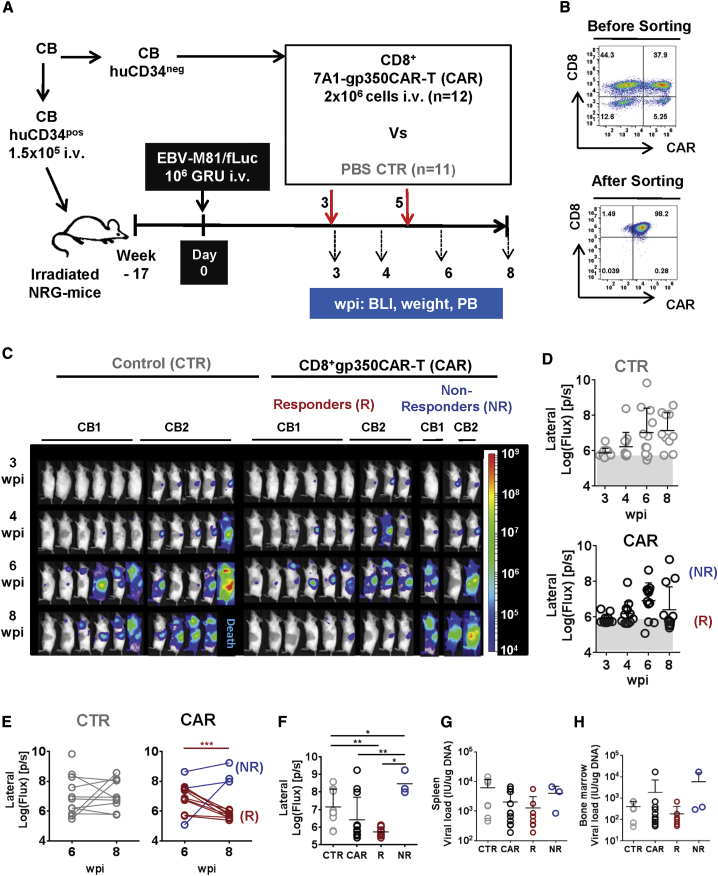
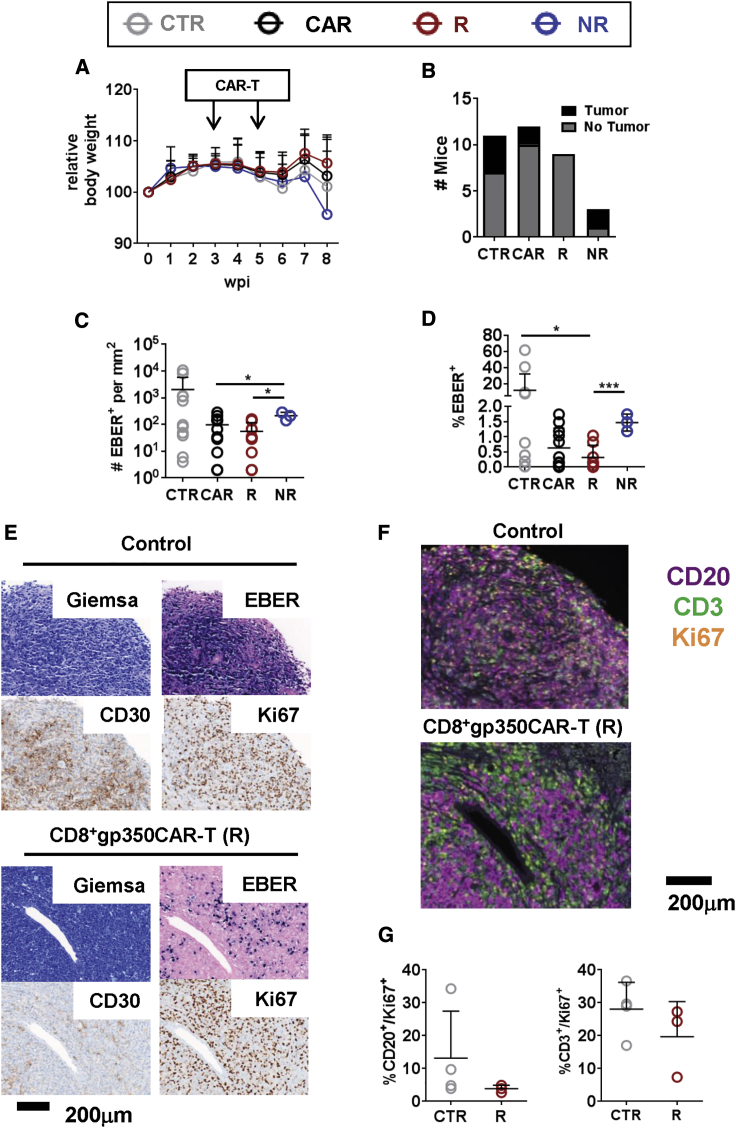
Epstein-Barr virus (EBV) is a latent and oncogenic human herpesvirus. Lytic viral protein expression plays an important role in EBV-associated malignancies. The EBV envelope glycoprotein 350 (gp350) is expressed abundantly during EBV lytic reactivation and sporadically on the surface of latently infected cells. Here we tested T cells expressing gp350-specific chimeric antigen receptors (CARs) containing scFvs derived from two novel gp350-binding, highly neutralizing monoclonal antibodies. The scFvs were fused to CD28/CD3ζ signaling domains in a retroviral vector. The produced gp350CAR-T cells specifically recognized and killed gp350+ 293T cells in vitro. The best-performing 7A1-gp350CAR-T cells were cytotoxic against the EBV+ B95-8 cell line, showing selectivity against gp350+ cells. Fully humanized Nod.Rag.Gamma mice transplanted with cord blood CD34+ cells and infected with the EBV/M81/fLuc lytic strain were monitored dynamically for viral spread. Infected mice recapitulated EBV-induced lymphoproliferation, tumor development, and systemic inflammation. We tested adoptive transfer of autologous CD8+gp350CAR-T cells administered protectively or therapeutically. After gp350CAR-T cell therapy, 75% of mice controlled or reduced EBV spread and showed lower frequencies of EBER+ B cell malignant lymphoproliferation, lack of tumor development, and reduced inflammation. In summary, CD8+gp350CAR-T cells showed proof-of-concept preclinical efficacy against impending EBV+ lymphoproliferation and lymphomagenesis.

Keywords: CAR-T cells; EBV; PTLD; adoptive T cell therapy; gp350; humanized mice; lymphoma; lymphoproliferation; lytic infection; transplantation.


Figures

None
Graphical abstract
Figure 1
Figure 1
Design and Specificity of CAR-T Cells Targeting gp350 (A) EBV+ immortalized monkey cells (B95-8) and human cells (Jijoye, BL-60, LCL/M81fLuc-11, and LCL/M81fLuc-C) contain gp350+ cell subpopulations. FACS detection of gp350 was performed with primary monoclonal antibodies (mAbs) using as a reference the 72A1-positive control antibody specific for gp350 or the novel 6G4 and 7A1 mAbs followed by a second fluorochrome-labeled mAb. As negative controls for analyses, only the second mAbs were used for staining. The numbers represent the percentages of gp350+ cells. (B) Schematic representation of the chimeric antigen receptors (CARs) containing the IgHL signal peptide, scFv sequences (SM5-1 targeting HCMV/gB and 6G4 or 7A1 targeting EBV/gp350), the IgG4 hinge, the IgG1 Fc CH3 spacer, the CD28 transmembrane and endocytoplasmic domains, and CD3 zeta signaling domains. The DNA sequences encoding the scFvs were inserted between the Pml1 and BamHI restriction sites. (C) Representative examples of CD4+ and CD8+ T cells transduced with the retroviral vector and analyzed for CAR detection by flow cytometry. (D) Mean fluorescence intensity (MFI) calculated for different CAR-T cells using mock T cells as a negative control reference: gBCAR (n = 6, gray), 6G4-gp350CAR (n = 7, blue), or 7A1-gp350CAR (n = 7, red). PBMCs from 3 different donors were used for CAR-T cell production. **p≤0.01, ***p≤0.001. (E) Detection of 7A1-gp350CAR expression on CD4+- and CD8+-CAR-T cells generated with 5 different CB units. (F) Flow cytometry analyses of a 293T clonal cell line stably expressing gp350 stained with the primary 7A1 mAb (red) and with the second antibody (the gray histogram shows control staining with the second antibody only). (G) 293T/gp350 cells were cultured with CAR-T cells (gB, gray; 6G4-gp350, blue; 7A1-gp350, red) for 24 h at effector:target (E:T) ratios of 1:1 or 3:1. Left panel: concentrations of secreted IFN-γ (ng/mL) measured in the cell supernatants (n = 3). ∗∗p ≤ 0.01, ∗∗∗p ≤ 0.001. Center panel: percentages of viable 293T/gp350 cells analyzed by flow cytometry for one experiment. Right panel: percentages of viable gp350+ 293T/gp350 cells analyzed by flow cytometry for one experiment. (H) Control co-culture of 293T/WT cells with CAR-T cells. Left panel: no detectable secreted IFN-γ. Right panel: no cell killing. A summary of the descriptive statistical analyses is shown in Table S1.
Figure 2
Figure 2
7A1-gp350CAR-T Cells Recognize and Kill gp350+ B95-8 Cells Latently Infected with EBV (A) Experimental scheme. CAR-T cells were co-cultured with B95-8 target cells at 0.1:1, 1:1, and 10:1 E:T ratios for 38–86 h. Analyses were performed to follow activation and proliferation of CAR-T cells (IFN-γ ELISA and FACS) and to assess the effects on viability of target cells (FACS). (B) IFN-ɣ detection in cell supernatants after 38 h, showing that, after co-culture, 7A1-gp350CAR-T cells produced significantly higher levels of IFN-γ than control gBCAR-T cells. ∗p ≤ 0.05, ∗∗p ≤ 0.01, ∗∗∗p ≤ 0.001 (n = 9). (C and D) Analyses of CD4+ (C) or CD8+ (D) CAR-T cells by flow cytometry to evaluate proliferation after 38 or 86 h of co-culture. The graphs show the percentages of proliferated viable lymphocytes showing loss of the CellTrace dye (n = 3). Higher 7A1-gp350CAR-T cell proliferation of was observed after 86 h of co-culture. ∗p ≤ 0.05. (E) Left: representative examples showing the remaining viable B95-8 cells (negative for the viability dye) after 38 h of co-culture with gBCAR-T (center panel) or with gp350CAR-T cells (bottom panel). B95-8 cells with no T cells are shown as a control (top panel) Right: quantified remaining viable B95-8 cells showing cytotoxic effects for co-culture at a 10:1 E:T ratio (n = 3). Cultures with no T cells were used as references. (F) Left: representative examples showing the remaining viable gp350+B95-8 cells (negative for the viability dye) after 38 h of co-cultures with gBCAR-T (center panel) or with gp350CAR-T cells (bottom panel). B95-8 cells with no T cells are shown as a control (top panel). Right: quantified remaining viable gp350+B95-8 cells showing cytotoxic effects for co- culture at a 10:1 E:T ratio (n = 3). ∗p ≤ 0.05 (n = 3). A summary of the descriptive statistical analyses is shown in Table S2.
Figure 3
Figure 3
Protective Effects of gp350CAR-T Cells Administered to Humanized Mice before EBV Infection (A) Experimental scheme. Nod.Rag.Gamma (NRG) mice were transplanted with cord blood (CB) CD34pos hematopoietic stem cells and, 17 weeks later, infected with EBV-M81/fLuc (106 GRUs, intravenously [i.v.]). The CD34neg fraction obtained from the same CB donor was used for production of CAR-T cells. The sorted CAR-T cells were expanded in culture until administration 1 day prior to EBV infection. For this protective study, the control cohort received PBS i.v. (control [CTR], n = 3, gray), one cohort received 2 × 106 CD4+CD8+gp350-CAR-T cells i.v. (n = 4, blue), and one cohort received 2 × 106 CD8+gp350CAR-T cells i.v. (n = 3, red). Sequential bioluminescence imaging (BLI) analyses, weight measurements, and peripheral blood (PB) collection were performed 2, 3, 4, and 5 weeks post infection (wpi). (B) Flow cytometry dot plot graphs showing CD4+ and CD8+ gp350CAR+-T cells analyzed before (top panels) and after (bottom panels) sorting for fractionation into CD4+CAR+- or CD8+CAR+-enriched T cells. Enriched and expanded gp350CAR-T cells were highly viable. (C) Sequential BLI analyses, showing pictures of the left body of individual mice, performed 2, 3, 4, and 5 wpi. Signal intensity was measured with the same settings for all mice and depicted in logarithmic scale as log (flux) (photons/second [p/s]; see the color-coded bar). The region of interest (ROI) for BLI quantification was set for whole left body views. (D) Left graph: sequential BLI for the left body for each cohort. ∗p ≤ 0.05, calculated by longitudinal ANCOVA. Right: final BLI at 5 wpi, showing values for individual mice. (E) Left graph: longitudinal weight monitoring from baseline prior to infection until 5 wpi. Mice administered CD4+CD8+gp350CAR-T cells showed significant weight losses compared with the other cohorts. ∗∗∗p ≤ 0.001, calculated by longitudinal ANCOVA. Right: final BLI at 5 wpi, showing values for individual mice. ∗p ≤ 0.05. (F) In situ hybridization for EBER detection performed with the spleen. The graph shows the number of EBER+ cells per mm2 of spleen. (G and H) Quantification of EBV viral load in DNA isolated from the spleen (G) and bone marrow (H) analyzed by qRT-PCR (shown as international units, IU/μg DNA). A summary of the descriptive statistical analyses is shown in Table S3.
Figure 4
Figure 4
Immune Monitoring Analyses to Assess the Effects of gp350CAR-T Cells Administered prior to EBV Infection in Human T Lymphocytic Populations (A) An exemplary gating strategy for the flow cytometry analyses of human lymphocyte subpopulations in the blood. Shown is gating of lymphocytes (side scatter [SSC] × forward scatter [FSC]), huCD45+, CD3+, CD8+, and CD4+ T cells. Calculations of the frequencies of CD8+ and CD4+ T cells within the sample were performed by back-gating to the huCD45 lymphocyte population. (B) Percentages of human CD45+ within total lymphocytes in PB for sequential time points. The cohort pre-treated with CD4+CD8+gp350-CAR-T cells is represented in blue, the cohort pre-treated with CD8+gp350CAR-T cells is represented in red, and non-treated CTRs receiving PBS are represented in gray. (C and D) Percentages of CD8+ T cells (C) and CD4+ T cells (D) within huCD45+ cells for sequential time points. The time point of CAR-T cell administration is indicated. (E and F) Terminal analyses at 5 wpi, showing the total numbers of CD8+ (E) and CD4+ (F) T cells in the spleen. (G) Concentration (picograms per milliliter) of human cytokines detected in the plasma of mice at 5 wpi: IFN-γ, IL-10, IL-12 (p70), IL-6, IL-8, and MCP-1. A summary of the descriptive statistical analyses is shown in Table S4.
Figure 5
Figure 5
CD8+gp350CAR-T Cells Administered Therapeutically to Humanized Mice after EBV Infection Lower Viral Spread in Most Mice (A) Experimental scheme. NRG mice were transplanted with CB CD34+ hematopoietic stem cells and, 17 weeks later, infected with EBV-M81/fLuc (106 GRUs, i.v.). The CD34 fraction obtained from the same CB donors was used for production of CAR-T cells. The sorted CAR-T cells were expanded in culture until administration 3 and 5 wpi. For this therapeutic study, the CTR cohort received PBS i.v. (n = 11, gray), and the test group received 2 × 106 CD8+gp350CAR-T cells i.v. (CAR, n = 12, black). Sequential BLI analyses, weight measurements, and PB collection were performed 3, 4, 6 and 8 wpi. (B) Flow cytometry dot plot graphs showing CD8+gp350CAR+-T cells analyzed before (top panel) and after (bottom panel) sorting for enrichment of CD8+CAR+ T cells. (C) Sequential BLI analyses, showing pictures of the left body of individual mice, performed 3, 4, 6, and 8 wpi. Mice transplanted with CD34pos derived from CB1 and CB2 are indicated. One mouse of the CTR group succumbed 7 wpi. Signal intensity was measured with the same settings for all mice and depicted in logarithmic scale as log (flux) (p/s; see color-coded bar). The ROI for BLI quantification was set for the whole left views. The BLI analyses showed, in the CAR group, 9 responders (R) with low BLI signals and 3 non-responder (NR) mice with high signals. (D) Quantified sequential BLI for the left body shown for each mouse of the CTR cohort (top graph) or CAR cohort (bottom graph). R and NR mice in the CAR cohort are indicated. (E) Detail of sequential BLI for each mouse from 6–8 wpi. R and NR mice are indicated. ∗∗∗p ≤ 0.001. (F) Quantification of the BLI intensity of the lateral left body view at endpoint analysis (log (flux] p/s) for CTR, CAR, CAR-T cell Rs, and CAR-T cell NRs. ∗p ≤ 0.05 and ∗∗p ≤ 0.01. (G and H) Quantification of EBV viral load in DNA isolated from the spleen (G) and bone marrow (H), analyzed by qRT-PCR (shown as IU/μg DNA). A summary of the descriptive statistical analyses is shown in Table S5.
Figure 6
Figure 6
Response to CD8+gp350CAR-T Cell Therapy Is Associated with Weight Gain, Lower Tumor Development, and Lower EBER+ LPD (A) Longitudinal weight monitoring from baseline prior to infection until 8 wpi. Mice responding to CD8+gp350CAR-T cell therapy showed the highest weight gain compared with the NR or CTR cohorts. (B) Stacked histogram representing the number of mice in each group with macroscopically detectable tumors (black) or with no detectable tumors (gray). Note that R mice showed no macroscopic tumors. (C and D) In situ hybridization for EBER detection performed with the spleen. The graph shows the number of EBER+ cells per mm2 of spleen (C) or the frequency of EBER+ cells in the analyzed field (D). The mean and SD for each group is shown. ∗p ≤ 0.05, ∗∗∗p ≤ 0.001. (E) Histopathological analyses of the spleen for a representative CTR mouse (top panels) and for a mouse responding to CD8+gp350CAR-T cell therapy (bottom panels). Giemsa staining: in both groups, perivascular spread of neoplastic cells is observed. Larger tumors were observed in CTR mice. EBER staining: EBV-infected cells are labeled in dark purple. CD20 and Ki67 staining: positive cells are labeled in brown. (F) Immunohistochemistry multiplex analysis was performed to detect CD3+ (green), CD20+ (purple), and Ki67+ (orange) cells. Exemplary analyses of the spleen of one CTR (top panel) and one CAR-T cell R mouse (bottom panel) are shown. (G) Quantitative results representing detectable double-positive CD20+Ki67+ cells (left graph) or CD3+Ki67+ (right graph) within the total cells analyzed for the spleen. These results indicate lower quantities of proliferating B and T cells in mice responding to gp350CAR-T cell therapy compared with CTR mice. A summary of the descriptive statistical analyses is shown in Table S6.
Figure 7
Figure 7
Immune Monitoring Analyses to Assess the Affects of CD8+gp350CAR-T Cells Administered after EBV Infection in the Human T Lymphocytic Population (A) Mice were grouped into CTR (gray, n = 11), R (red, n = 9) and NR (blue, n = 3). Analyses were performed at baseline prior to EBV infection (week 0) and sequentially after infection (3, 4, 6, and 8 wpi). Frequencies of human CD8+ T cells within huCD45+ cells were determined. Time points of CAR-T cell administration are indicated. (B) Comparison of the relative frequencies of human CD8+ T cells in the blood, analyzed 6 and 8 wpi. The mean and SD for each group is shown. R mice show lower expansion of CD8+ T cells than the other groups at 8 wpi. ∗p ≤ 0.05, ∗∗p ≤ 0.01. (C) Absolute numbers of huCD8+ T cells within huCD45+ (left graph) and CD4+ T cells within huCD45+ cells (right graph) in the spleen. Note the lower number of CD8+ T cells and higher numbers of CD4+ T cells in spleens of the R group compared with CTR mice. (D) MFI of PD-1 expression on CD45+/CD8+ (left graph) or on CD45+/CD4+ T cells (right graph), showing results from two experiments (CB1 and CB2). ∗p ≤ 0.05. (E) Detection of CAR+-T cells in PB within CD45+/CD8+ T cells at 8 wpi. The threshold for baseline detection was set arbitrarily at 1% (shadowed area). (F) Concentration (pg/ml) of human cytokines detected in the plasma of mice at 8 wpi: IFN-γ, IL-10, IL-12 (p70), IL-6, IL-8, and MCP-1. The mean and SD for each group is shown. A summary of the descriptive statistical analyses is shown in Table S7.

Similar articles

Cited by

References

    1. Heslop H.E. How I treat EBV lymphoproliferation. Blood. 2009;114:4002–4008. - PMC - PubMed
    1. DeStefano C.B., Desai S.H., Shenoy A.G., Catlett J.P. Management of post-transplant lymphoproliferative disorders. Br. J. Haematol. 2018;182:330–343. - PubMed
    1. Rostgaard K., Balfour H.H., Jr., Jarrett R., Erikstrup C., Pedersen O., Ullum H., Nielsen L.P., Voldstedlund M., Hjalgrim H. Primary Epstein-Barr virus infection with and without infectious mononucleosis. PLoS ONE. 2019;14:e0226436. - PMC - PubMed
    1. Münz C. Latency and lytic replication in Epstein-Barr virus-associated oncogenesis. Nat. Rev. Microbiol. 2019;17:691–700. - PubMed
    1. Buschle A., Hammerschmidt W. Epigenetic lifestyle of Epstein-Barr virus. Semin. Immunopathol. 2020;42:131–142. - PMC - PubMed