

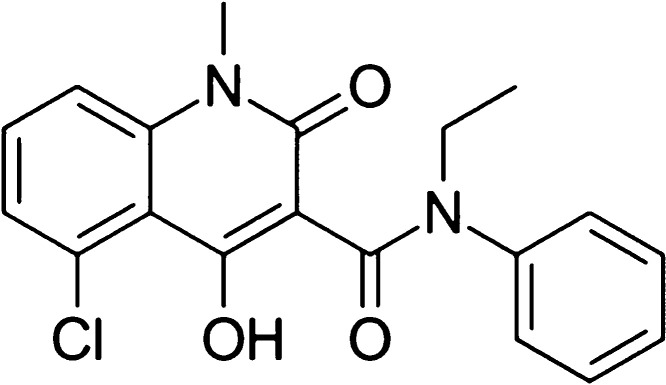
Laquinimod Prevents Adipogenesis and Obesity by Down-Regulating PPAR-γ and C/EBPα through Activating AMPK
- PMID: 32954145
- PMCID: PMC7495734
- DOI: 10.1021/acsomega.0c02525
Laquinimod Prevents Adipogenesis and Obesity by Down-Regulating PPAR-γ and C/EBPα through Activating AMPK
Abstract
Background and purpose: obesity is defined as excessive accumulation of adipose tissues and is becoming one of the main global severe public health issues. The present study aims to investigate the anti-adipogenesis of laquinimod and the underlying mechanism.
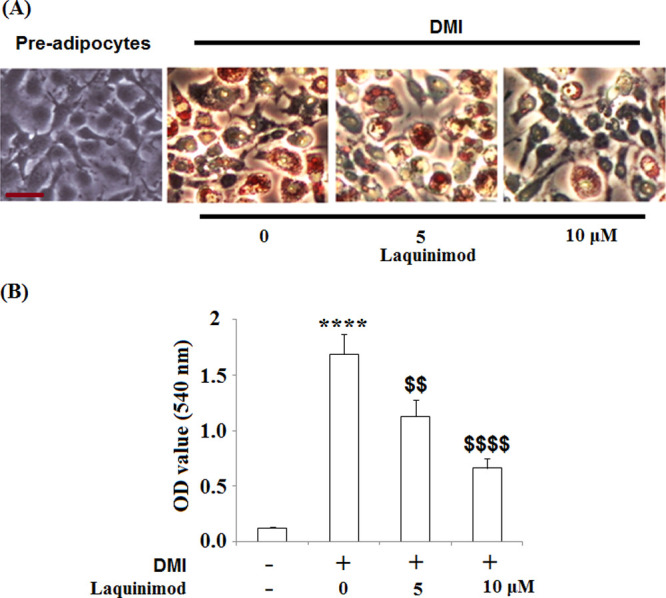
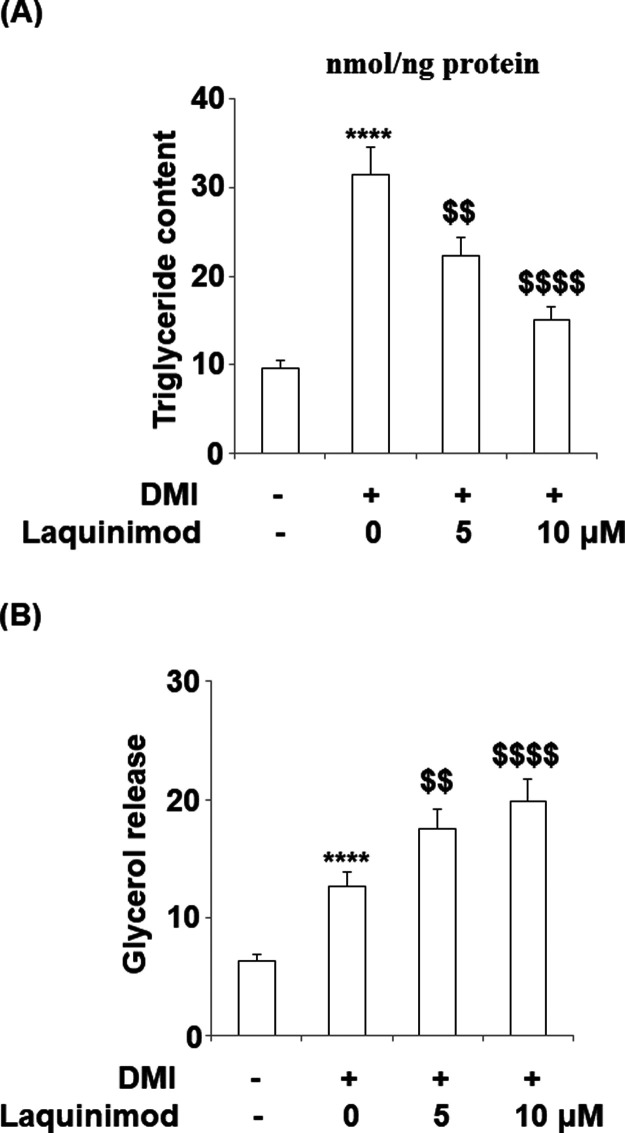
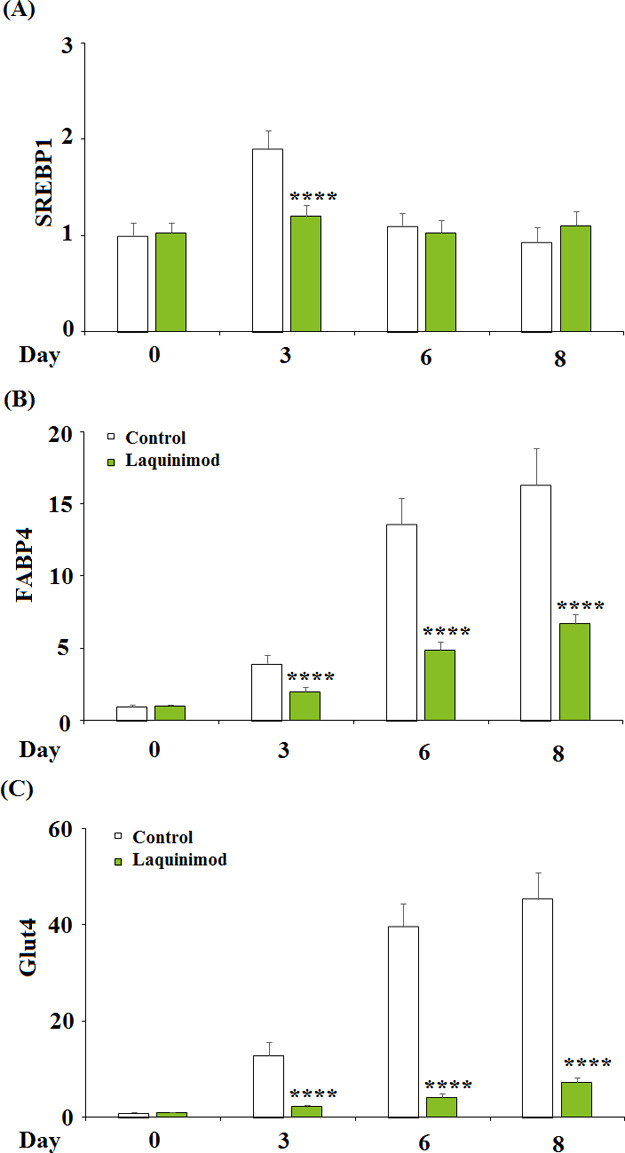
Methods: a differentiation cocktail was used to differentiate 3T3-L1 cells, and mice were fed with high fat food to establish the obesity animal model. Oil red O staining, glycerol production assay, and the release of triglyceride were used to evaluate the differentiation degree of 3T3-L1 cells. The expression level of sterol regulatory element binding transcription factor 1 (Srebp1), fatty acid binding protein-4 (FABP4), glucose transporter 4 (GLUT4), peroxisome proliferator-activated receptor-γ (PPAR-γ), CCAAT enhancer-binding proteins (C/EBPα), and phosphorylation of adenosine 5'-monophosphate (AMP)-activated protein kinase α (p-AMPKα) was determined by quantitative real time PCRqRT-PCR and western blot analysis. The pathological state of adipose tissues was evaluated by hematoxylin-eosin staining.
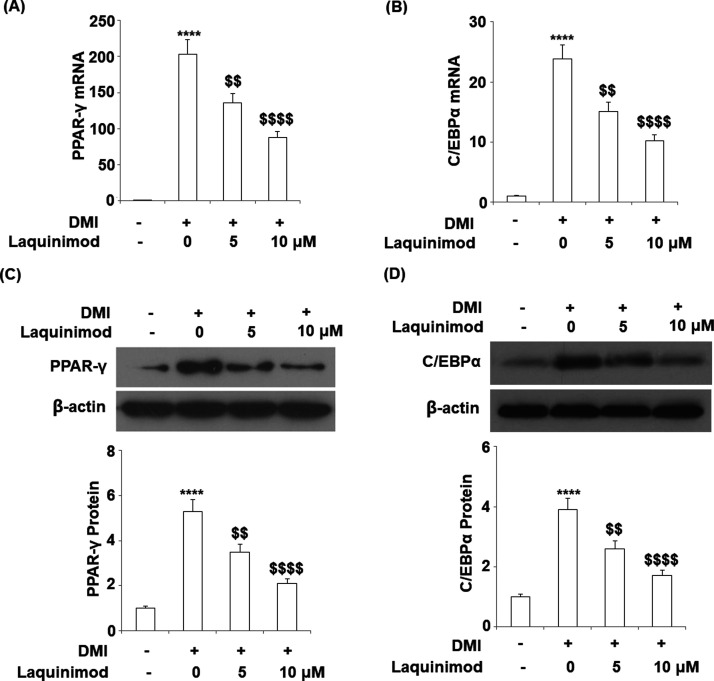
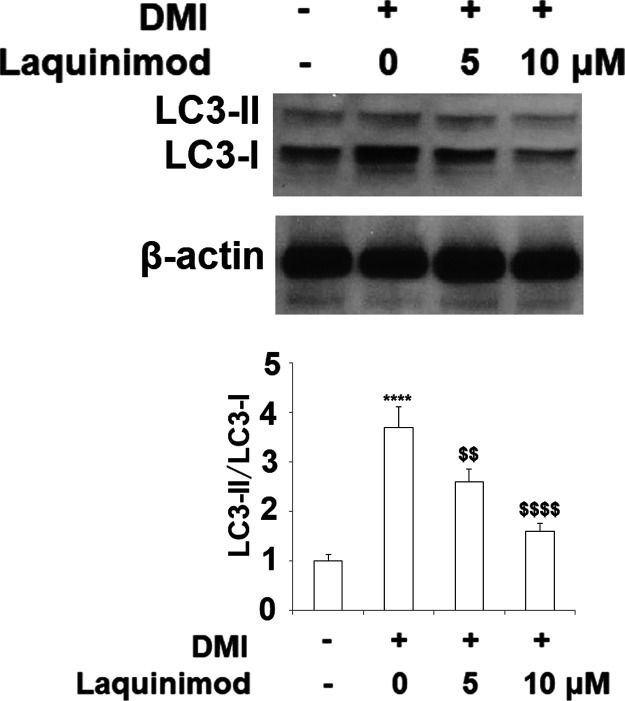
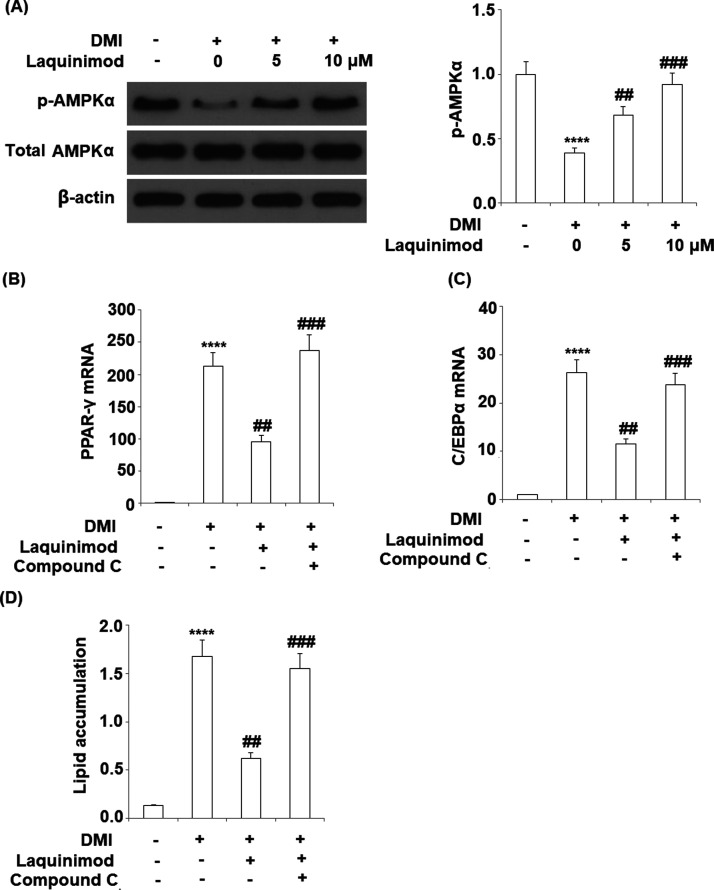
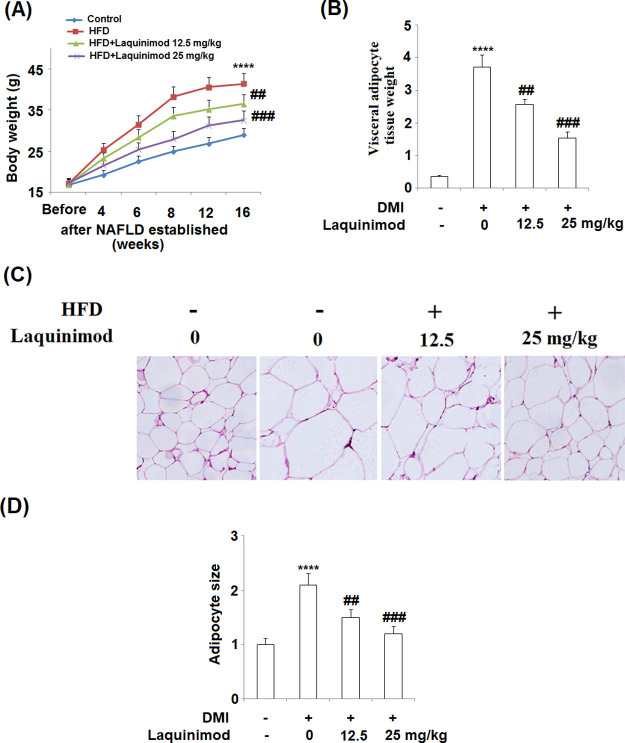
Results: the amount and UV absorption of oil red O, glycerol production, release of triglyceride, and the expression of SREBP1, FABP4, and Glut4 in differentiated 3T3-L1 cells were decreased by the administration of laquinimod. PPAR-γ and C/EBPα were down-regulated, and p-AMPKα was up-regulated by laquinimod. The down-regulated PPAR-γ and C/EBPα, as well as the inhibited lipid accumulation functioned by laquinimod, were reversed by the coincubation with the AMPK inhibitor compound C. Decreased body weight, visceral adipocyte tissue weight, and size of adipocytes were observed in in vivo obesity mice after administration with laquinimod.
Conclusion: laquinimod might prevent adipogenesis by down-regulating PPAR-γ and C/EBPα through activating AMPK.
Copyright © 2020 American Chemical Society.
Conflict of interest statement
The authors declare no competing financial interest.
Figures
Similar articles
-
HDAC inhibitor Trichostatin A suppresses adipogenesis in 3T3-L1 preadipocytes.Aging (Albany NY). 2021 Jul 7;13(13):17489-17498. doi: 10.18632/aging.203238. Epub 2021 Jul 7. Aging (Albany NY). 2021. PMID: 34232916 Free PMC article.
-
α, β-Amyrin, a pentacyclic triterpenoid from Protium heptaphyllum suppresses adipocyte differentiation accompanied by down regulation of PPARγ and C/EBPα in 3T3-L1 cells.Biomed Pharmacother. 2019 Jan;109:1860-1866. doi: 10.1016/j.biopha.2018.11.027. Epub 2018 Nov 26. Biomed Pharmacother. 2019. PMID: 30551441
-
Vanadium(IV)-chlorodipicolinate inhibits 3T3-L1 preadipocyte adipogenesis by activating LKB1/AMPK signaling pathway.J Inorg Biochem. 2016 Sep;162:1-8. doi: 10.1016/j.jinorgbio.2016.06.013. Epub 2016 Jun 5. J Inorg Biochem. 2016. PMID: 27318173
-
Suppression of adipocyte differentiation and lipid accumulation by stearidonic acid (SDA) in 3T3-L1 cells.Lipids Health Dis. 2017 Sep 25;16(1):181. doi: 10.1186/s12944-017-0574-7. Lipids Health Dis. 2017. PMID: 28946872 Free PMC article.
-
Persimmon tannin represses 3T3-L1 preadipocyte differentiation via up-regulating expression of miR-27 and down-regulating expression of peroxisome proliferator-activated receptor-γ in the early phase of adipogenesis.Eur J Nutr. 2015 Dec;54(8):1333-43. doi: 10.1007/s00394-014-0814-9. Epub 2014 Dec 16. Eur J Nutr. 2015. PMID: 25510894
Cited by
-
The Protective Effects of Sulforaphane on High-Fat Diet-Induced Obesity in Mice Through Browning of White Fat.Front Pharmacol. 2021 Apr 29;12:665894. doi: 10.3389/fphar.2021.665894. eCollection 2021. Front Pharmacol. 2021. PMID: 33995092 Free PMC article.
-
Methylation of lncSHGL promotes adipocyte differentiation by regulating miR-149/Mospd3 axis.Cell Cycle. 2023 Nov;22(21-22):2361-2380. doi: 10.1080/15384101.2023.2287367. Epub 2024 Jan 18. Cell Cycle. 2023. PMID: 38057958 Free PMC article.
-
PorelisTM, a standardized purple tea extract, improves adipocyte functionality by regulating the leptin and adiponectin levels in high-fat diet-induced C57BL/6 mice.Iran J Basic Med Sci. 2025;28(8):1037-1046. doi: 10.22038/ijbms.2025.84192.18209. Iran J Basic Med Sci. 2025. PMID: 40584451 Free PMC article.
-
Theophylline Extracted from Fu Brick Tea Affects the Metabolism of Preadipocytes and Body Fat in Mice as a Pancreatic Lipase Inhibitor.Int J Mol Sci. 2022 Feb 25;23(5):2525. doi: 10.3390/ijms23052525. Int J Mol Sci. 2022. PMID: 35269668 Free PMC article.
-
Fermented mixed feed alters growth performance, carcass traits, meat quality and muscle fatty acid and amino acid profiles in finishing pigs.Anim Nutr. 2022 Sep 27;12:87-95. doi: 10.1016/j.aninu.2022.09.003. eCollection 2023 Mar. Anim Nutr. 2022. PMID: 36632618 Free PMC article.
References
LinkOut - more resources
Full Text Sources
Research Materials
