

Can post-mortem MRI be used as a proxy for in vivo? A case study
- PMID: 32954270
- PMCID: PMC7425311
- DOI: 10.1093/braincomms/fcz030
Can post-mortem MRI be used as a proxy for in vivo? A case study
Abstract
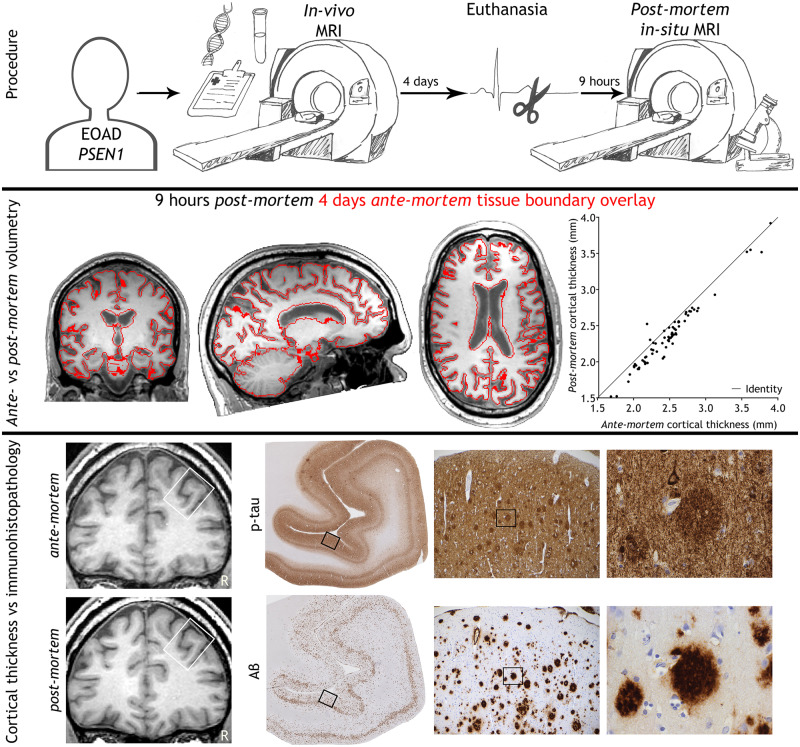
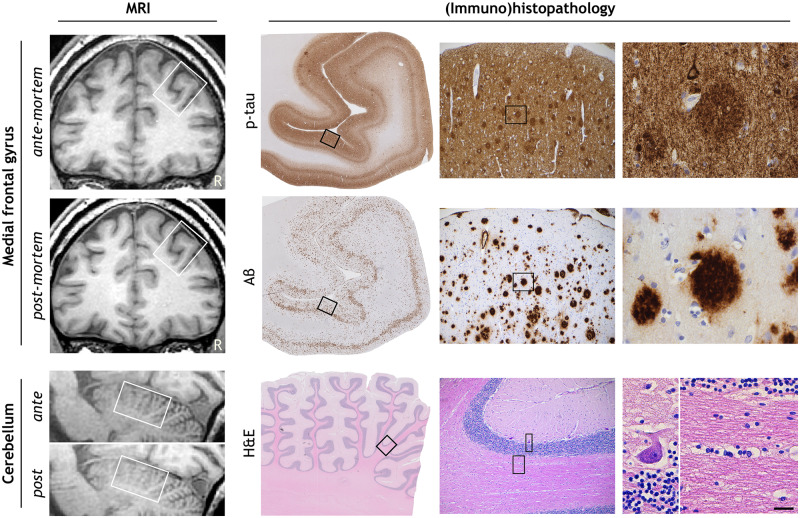
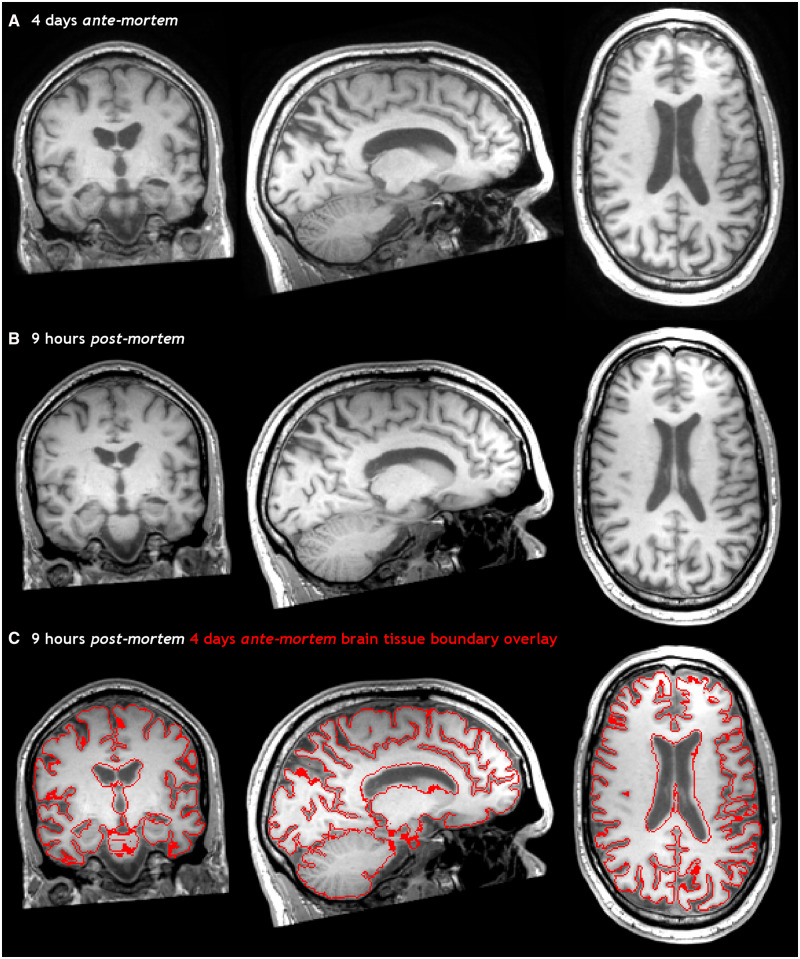
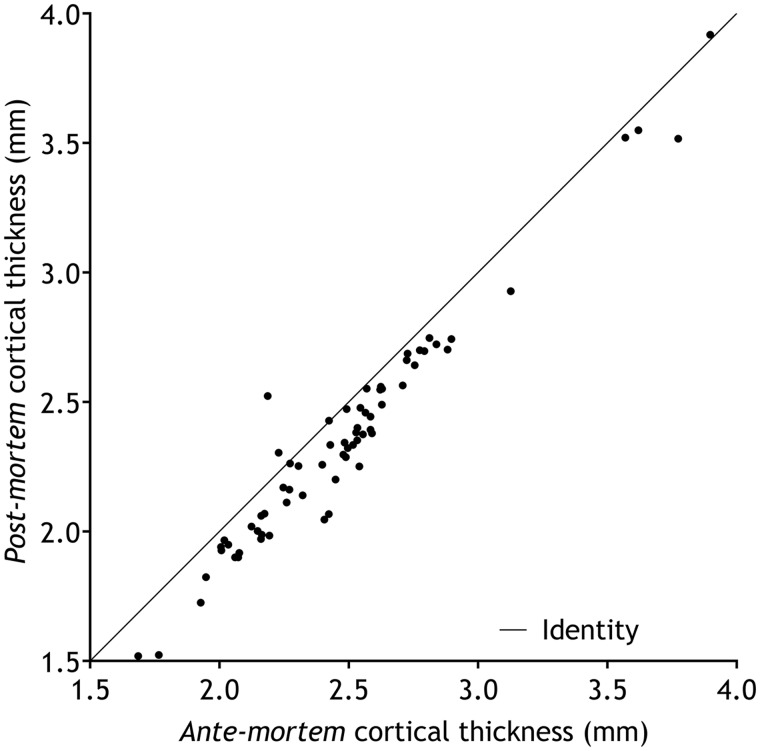
Post-mortem in situ MRI has been used as an intermediate between brain histo(patho)logy and in vivo imaging. However, it is not known how comparable post-mortem in situ is to ante-mortem imaging. We report the unique situation of a patient with familial early-onset Alzheimer's disease due to a PSEN1 mutation, who underwent ante-mortem brain MRI and post-mortem in situ imaging only 4 days apart. T1-weighted and diffusion MRI was performed at 3-Tesla at both time points. Visual atrophy rating scales, brain volume, cortical thickness and diffusion measures were derived from both scans and compared. Post-mortem visual atrophy scores decreased 0.5-1 point compared with ante-mortem, indicating an increase in brain volume. This was confirmed by quantitative analysis; showing a 27% decrease of ventricular and 7% increase of whole-brain volume. This increase was more pronounced in the cerebellum and supratentorial white matter than in grey matter. Furthermore, axial and radial diffusivity decreased up to 60% post-mortem whereas average fractional anisotropy of white matter increased approximately 10%. This unique case study shows that the process of dying affects several imaging markers. These changes need to be taken into account when interpreting post-mortem MRI to make inferences on the in vivo situation.
Keywords: MRI; ante-mortem; immunohistopathology; in vivo; post-mortem.
© The Author(s) (2019). Published by Oxford University Press on behalf of the Guarantors of Brain.
Figures
References
-
- Chard DT, Jackson JS, Miller DH, Wheeler-Kingshott C.. Reducing the impact of white matter lesions on automated measures of brain gray and white matter volumes. J Magn Reson Imaging 2010; 32: 223–8. - PubMed
-
- D’Arceuil HE, Westmoreland S, de Crespigny AJ.. An approach to high resolution diffusion tensor imaging in fixed primate brain. NeuroImage 2007; 35: 553–65. - PubMed
-
- Eggen MD, Swingen CM, Iaizzo PA.. Ex vivo diffusion tensor MRI of human hearts: relative effects of specimen decomposition. Magn Reson Med 2012; 67: 1703–9. - PubMed
-
- Falconer JC, Narayana PA.. Cerebrospinal fluid-suppressed high-resolution diffusion imaging of human brain. Magn Reson Med 1997; 37: 119–23. - PubMed
LinkOut - more resources
Full Text Sources