. 2020 Aug 3;2(2):fcaa066.
doi: 10.1093/braincomms/fcaa066. eCollection 2020.

Subcellular Localization And Formation Of Huntingtin Aggregates Correlates With Symptom Onset And Progression In A Huntington'S Disease Model

Affiliations

Subcellular Localization And Formation Of Huntingtin Aggregates Correlates With Symptom Onset And Progression In A Huntington'S Disease Model

Christian Landles et al. Brain Commun. .

Abstract

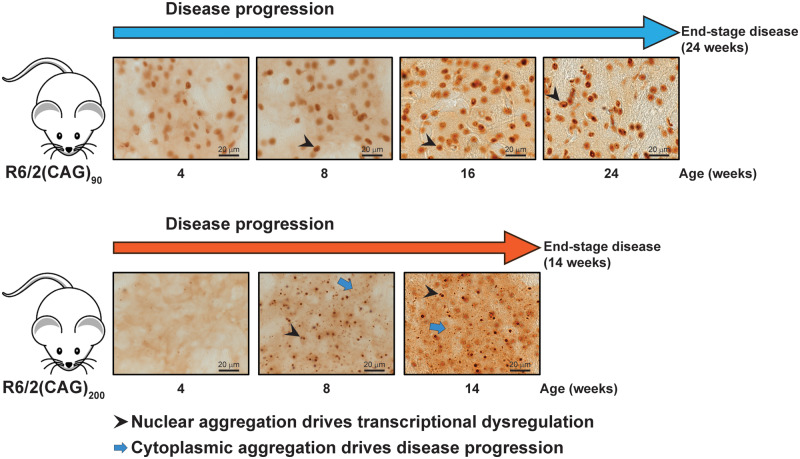
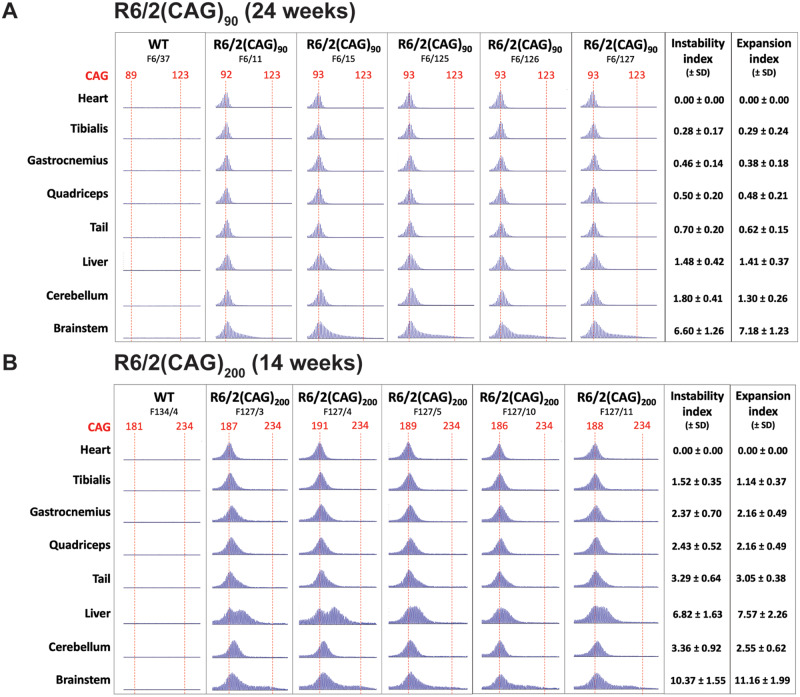
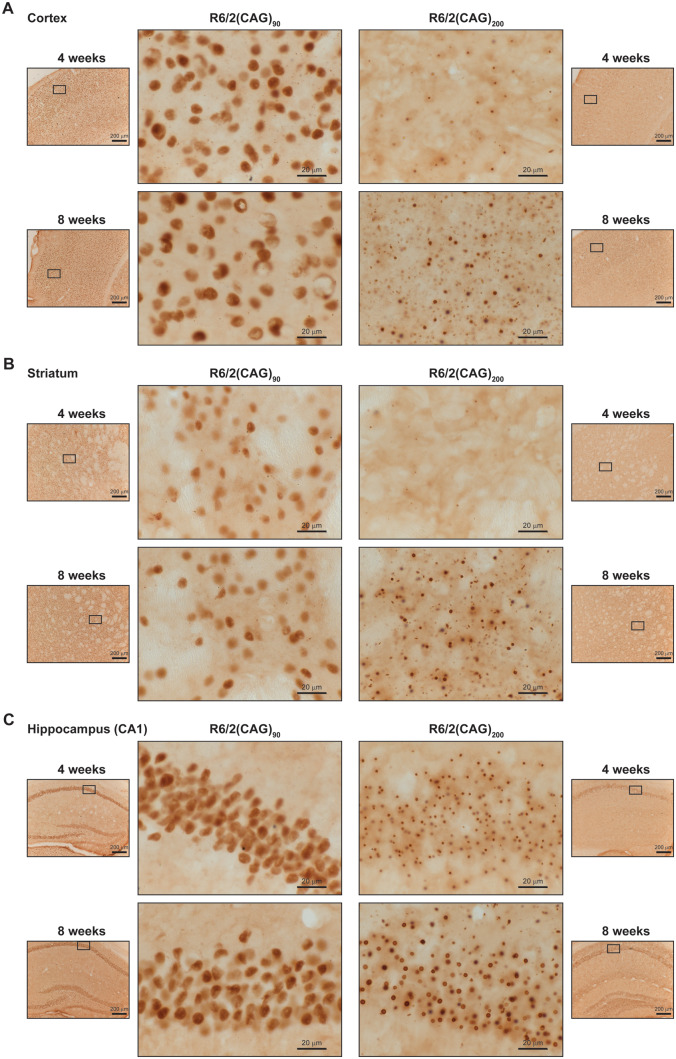
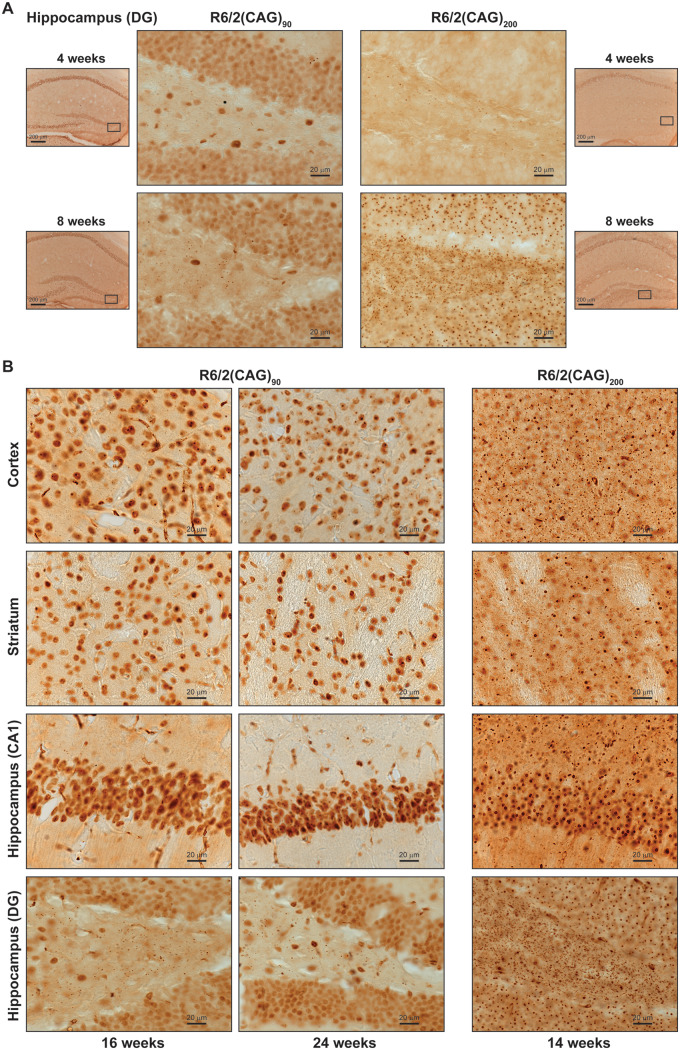
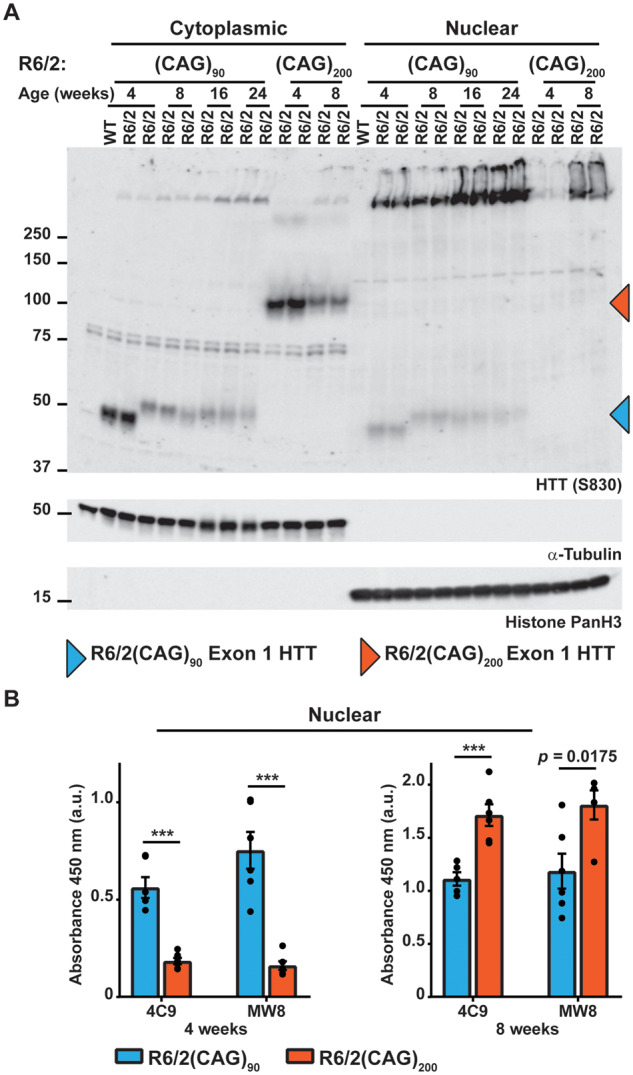
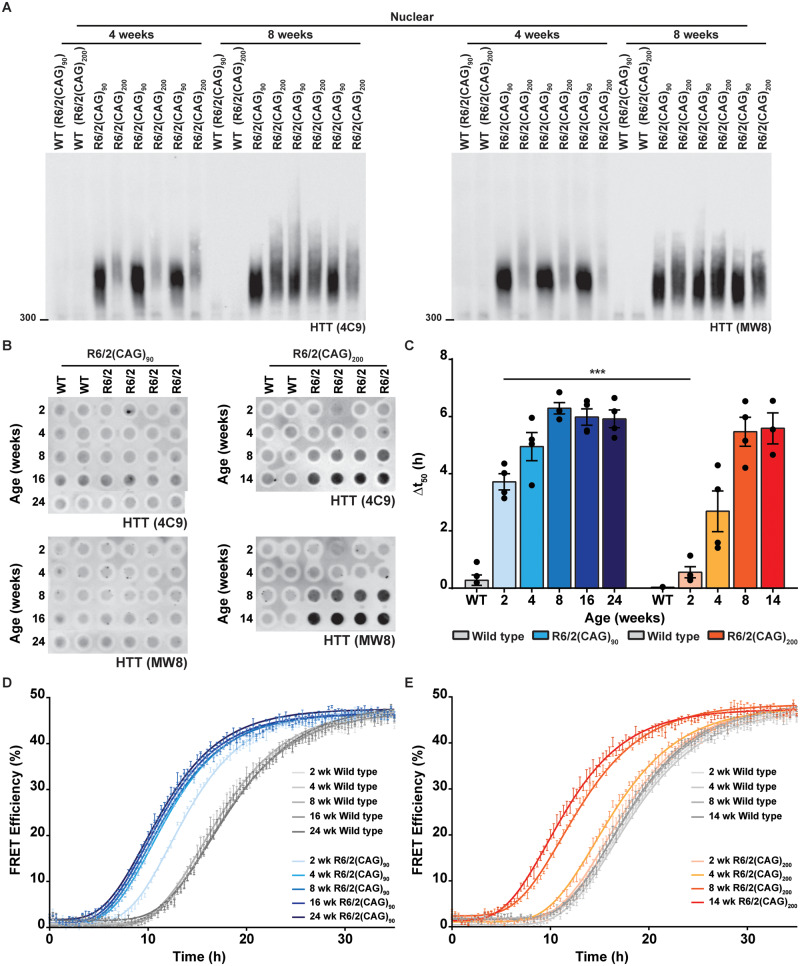
Huntington's disease is caused by the expansion of a CAG repeat within exon 1 of the HTT gene, which is unstable, leading to further expansion, the extent of which is brain region and peripheral tissue specific. The identification of DNA repair genes as genetic modifiers of Huntington's disease, that were known to abrogate somatic instability in Huntington's disease mouse models, demonstrated that somatic CAG expansion is central to disease pathogenesis, and that the CAG repeat threshold for pathogenesis in specific brain cells might not be known. We have previously shown that the HTT gene is incompletely spliced generating a small transcript that encodes the highly pathogenic exon 1 HTT protein. The longer the CAG repeat, the more of this toxic fragment is generated, providing a pathogenic consequence for somatic expansion. Here, we have used the R6/2 mouse model to investigate the molecular and behavioural consequences of expressing exon 1 HTT with 90 CAGs, a mutation that causes juvenile Huntington's disease, compared to R6/2 mice carrying ∼200 CAGs, a repeat expansion of a size rarely found in Huntington's disease patient's blood, but which has been detected in post-mortem brains as a consequence of somatic CAG repeat expansion. We show that nuclear aggregation occurred earlier in R6/2(CAG)90 mice and that this correlated with the onset of transcriptional dysregulation. Whereas in R6/2(CAG)200 mice, cytoplasmic aggregates accumulated rapidly and closely tracked with the progression of behavioural phenotypes and with end-stage disease. We find that aggregate species formed in the R6/2(CAG)90 brains have different properties to those in the R6/2(CAG)200 mice. Within the nucleus, they retain a diffuse punctate appearance throughout the course of the disease, can be partially solubilized by detergents and have a greater seeding potential in young mice. In contrast, aggregates from R6/2(CAG)200 brains polymerize into larger structures that appear as inclusion bodies. These data emphasize that a subcellular analysis, using multiple complementary approaches, must be undertaken in order to draw any conclusions about the relationship between HTT aggregation and the onset and progression of disease phenotypes.

Keywords: Huntington’s disease; huntingtin aggregation and seeding; polyglutamine; somatic CAG instability; transcriptional dysregulation.


Figures

Graphical Abstract
Graphical Abstract
Figure 1
Figure 1
Behavioural and physiological phenotypes progress more slowly in R6/2(CAG)90 than R6/2(CAG)200 mice. (A–D) Failure to gain body weight occurred later in (A) R6/2(CAG)90 males and (B) R6/2(CAG)90 females than in (C) R6/2(CAG)200 males and (D) R6/2(CAG)200 females respectively. (E–H) Reduction in fore-limb grip strength progressed more slowly in (E) R6/2(CAG)90 males and (F) R6/2(CAG)90 females than in (G) R6/2(CAG)200 males and (H) R6/2(CAG)200 females. A statistically significant reduction in grip strength occurred at 12 weeks of age for R6/2(CAG)90 and 11 weeks of age for R6/2(CAG)200 for both genders of each genotype. Discrepancies in the wild type grip strength between the R6/2(CAG)90 and R6/2(CAG)200 datasets are because the data were collected on different machines by different operators at different times. (I, J) Rotarod performance, as compared to that of wild type littermates, deteriorated more slowly in (I) R6/2(CAG)90 mice than in their (J) R6/2(CAG)200 counterparts. The R6/2(CAG)200 data were extracted from the analysis published in Bobrowska et al. (2012). Discrepancies in the latency to fall between the wild type data sets are because the data were collected using different machines by different operators at different times. Wild type (CAG)90 (n = 20), R6/2(CAG)90 (n = 17–20), wild type (CAG)200 (n = 14–18) and R6/2(CAG)200 (n = 16–19). Statistical analysis was GLM ANOVA with Bonferroni post hoc correction *P ≤ 0.05, **P ≤ 0.01, ***P ≤ 0.001.
Figure 2
Figure 2
Striatal, cortical and cerebellar genes of interest were dysregulated earlier in R6/2(CAG)90 than R6/2(CAG)200 mice. (A, B) Comparison of the levels of striatal transcripts, as measured by qPCR, between R6/2(CAG)90 and R6/2(CAG)200 mice at (A) 4 weeks and (B) 8 weeks of age. R6/2(CAG)90 transcript levels were decreased compared to those of wild type littermates at 4 weeks of age, whereas the R6/2(CAG)200 and wild type levels were comparable. At 8 weeks of age, the transcripts were decreased to similar levels in both R6/2 lines. (C, D) Comparison of the levels of cortical transcripts, as measured by qPCR, between R6/2(CAG)90 and R6/2(CAG)200 mice at (C) 4 weeks and (D) 8 weeks of age. R6/2(CAG)90 transcript levels were decreased compared to those of wild type littermates at 4 weeks of age, whereas the R6/2(CAG)200 and wild type levels were comparable. At 8 weeks of age, the Pgam2, Grm2 and Hrh3 transcripts were also decreased in the R6/2(CAG)200 mice, whereas BdnfIV and Hrt1a, were still expressed at levels similar to wild type. (E, F) Comparison of the levels of cerebellar transcripts, as measured by qPCR, between R6/2(CAG)90 and R6/2(CAG)200 mice at (E) 4 weeks and (F) 8 weeks of age. At 4 weeks of age, R6/2(CAG)90  Igfbp5, Kcnk2 and Pcp4 transcript levels were dysregulated compared to those of wild type littermates, whereas the R6/2(CAG)200 and wild type levels were comparable. At 8 weeks of age, all transcripts were dysregulated to similar levels in both R6/2 lines. n = 8/genotype (4 male and 4 female). Statistical analysis was one-way ANOVA with Bonferroni post hoc correction ***P ≤ 0.001. The test statistic, degrees of freedom and P-values for the ANOVA are provided in Supplementary Table 3.
Figure 3
Figure 3
Huntingtin aggregates were detected earlier in the brains of R6/2(CAG)90 than R6/2(CAG)200 mice. (AD) Seprion-ligand ELISA analysis of aggregated HTT in the (A) striatum, (B) cortex, (C) hippocampus and (D) cerebellum of R6/2(CAG)90 and R6/2(CAG)200 mice at 2, 4 and 8 weeks of age. Aggregated HTT was detected at 2 weeks of age in all brain regions from R6/2(CAG)90 mice but not until 4 weeks in R6/2(CAG)200 mice. In all brain regions, the level of HTT aggregation was higher in R6/2(CAG)90 mice than in R6/2(CAG)200 mice at 4 weeks of age. By 8 weeks of age, the level of HTT aggregation was comparable between R6/2(CAG)90 and R6/2(CAG)200 mice for all brain regions. (E–H) Seprion-ligand analysis of aggregated HTT in the (E) striatum, (F) cortex, (G) hippocampus and (H) cerebellum of R6/2(CAG)90 and R6/2(CAG)200 mice from 8 weeks of age until end-stage disease at 24 and 14 weeks of age respectively. (A–D) n = 6/genotype. (E–H) n = 8/genotype. The absorbance values cannot be compared between (A–D) and (E–H) as these experiments were not performed at the same time. Statistical analysis was two-way ANOVA with Bonferroni post hoc correction ***P ≤ 0.001. The test statistic, degrees of freedom and P-values for the ANOVA are provided in Supplementary Table 4. (I, J) Western blot analysis of soluble and aggregated exon 1 HTT protein in brain lysates from R6/2(CAG)90 mice at 4, 8, 16 and 24 weeks of age and from R6/2(CAG)200 mice at 4, 8 and 14 weeks of age, immunoprobed with either (I) 4C9 or (J) MW8 antibodies. ATP5B was used as a loading control. Aggregated HTT was prominent in the stacking gel for R6/2(CAG)90 mice at 4 weeks, but not from R6/2(CAG)200 mice until 8 weeks of age. The migration of soluble exon 1 HTT was retarded by the expanded polyQ tracts and the levels of this soluble protein diminished with age in both lines as they were recruited into aggregates. The full-sized blots for the loading controls are shown in Supplementary Fig. 12. WT = wild type.
Figure 4
Figure 4
Comparison of somatic CAG instability in tissues from R6/2(CAG)90 and R6/2(CAG)200 mice. Capillary electrophoresis traces for (A) R6/2(CAG)90 mice at 24 weeks of age and (B) R6/2(CAG)200 mice at 14 weeks of age. The mode CAG repeat length is indicated at the top of the trace in red and the red dashed line helps to visualize the extent to which the CAG repeat has been somatically unstable during the lifespan of each mouse. Each vertical column shows the traces obtained from the tissues of a single mouse. The mean, standard deviation and data points for the instability and expansion indices of each tissue are illustrated in Supplementary Fig. 2, and the numerical values for these measures are listed on the right hand side of the tables (±SD) in (A) and (B). Somatic CAG instability was detected in the brain stem from both models, but was only prominent in the liver from the R6/2(CAG)200 mice. n = 5/genotype. The mean CAG repeat size for R6/2(CAG)90 mice was 93.11 ± 0.86 (SD) and for R6/2(CAG)200 mice was 190.53 ± 3.17 (SD). Statistical analysis was one-way ANOVA with Bonferroni post hoc correction, ***P ≤ 0.001. The test statistic, degrees of freedom and P-values for the ANOVA are provided in Supplementary Table 5. WT = wild type.
Figure 5
Figure 5
Aggregated HTT accumulated in neuronal nuclei in the brains of R6/2(CAG)90 at a younger age than in R6/2(CAG)200 mice. The pattern of immunostaining detected with the MW8 antibody on brain sections from R6/2(CAG)90 and R6/2(CAG)200 mice at 4 and 8 weeks of age is shown for the (A) cortex, (B) striatum and (C) hippocampus. The location of the centre panel images in the brain sections is indicated in the adjacent thumbnails, and the position of the thumbnails within the tissue section is illustrated in Supplementary Figs 6 and 7. The wild type control sections are shown in Supplementary Figs 8 and 9. n = 3/R6/2 genotype and n = 1/wild type control. Centre panels, scale bar = 20 μm; thumbnails, scale bar = 200 μm.
Figure 6
Figure 6
Cytoplasmic HTT aggregates accumulate more rapidly in the brains of R6/2(CAG)200 than in R6/2(CAG)90 mice. The pattern of immunostaining detected with the MW8 antibody on brain sections from R6/2(CAG)90 and R6/2(CAG)200 mice. (A) The hippocampal hilus of the dentate gyrus at 4 and 8 weeks of age. The location of the centre panel images in the brain sections is indicated in the adjacent thumbnails, and the position of the thumbnails within the tissue section is illustrated in Supplementary Figs 6 and 7. The wild type control sections are shown in Supplementary Figs 8 and 9. (B) The cortex, striatum, CA1 region of the hippocampus and hilus at 16 and 24 weeks of age for the R6/2(CAG)90 and 14 weeks of age for the R6/2(CAG)200 mice. The location of the images from within the tissue sections is illustrated in Supplementary Fig. 10. The wild type control sections are shown in Supplementary Fig. 11. n = 3/R6/2 genotype and n = 1/wild type control. (A) Centre panels, scale bar = 20 μm; thumbnails, scale bar = 200 μm. (B) scale bar = 20 μm.
Figure 7
Figure 7
Soluble exon 1 HTT was detected in the nuclear fraction from R6/2(CAG)90 but not from R6/2(CAG)200 brains. (A) Western blot of cytoplasmic and nuclear fractions from R6/2(CAG)90 and R6/2(CAG)200 hemispheres at the ages indicated immunoprobed with the S830 antibody. A fragment that migrated as soluble exon 1 HTT was detected in the nuclear fraction of R6/2(CAG)90 but not R6/2(CAG)200 mice. S830 was used for the western blot presented here, as MW8 and 4C9 both detected cross-hybridising bands, which co-migrated with the R6/2(CAG)90 protein, making the presence of exon 1 HTT in the nuclear fraction harder to interpret. The purity of the nuclear and cytoplasmic fractions was indicated by immunoblotting with antibodies to α-tubulin and histone panH3 respectively. (B) Seprion ELISA analysis of HTT aggregation in nuclear fractions from R6/2(CAG)90 and R6/2(CAG)200 hemispheres at 4 and 8 weeks of age immunodetected with 4C9 or MW8 antibodies (n = 6/genotype). Statistical analysis was two-way ANOVA with Bonferroni post hoc correction. ***P < 0.001. The test statistic, degrees of freedom and P-values for the ANOVA are provided in Supplementary Table 6. WT = wild type.
Figure 8
Figure 8
HTT aggregates formed in R6/2(CAG)90 and R6/2(CAG)200 brains have different molecular properties. (A) Nuclear fractions from R6/2(CAG)90 and R6/2(CAG)200 hemispheres at 4 and 8 weeks of age were fractionated by AGERA and immunoprobed with either 4C9 or MW8 antibodies. (B) Cortical lysates from R6/2(CAG)90 and R6/2(CAG)200 mice were filtered through cellulose acetate filters and immunoprobed with either 4C9 or MW8 antibodies (wild type, n = 2; R6/2, n = 4/genotype/age). (C) Quantification of mutant huntingtin seeding activity (HSA) in brain extracts from the R6/2(CAG)90, R6/2 (CAG)200 and wild-type control mice (n = 4/genotype/age). Results for wild type mice are shown as an average Δt50 value. Cortical samples were from the same mice as had been used for the filter retardation assay in (B). (D) Effect of cortical homogenates from R6/2(CAG)90 and wild type mice at 2, 4, 8, 16 and 24 weeks of age on the Ex1Q48-CyPet and –YPet (1:1 mixture, 1.2 μM) co-aggregation. (E) Effect of cortical homogenates from R6/2(CAG)200 and wild type mice at 2, 4, 8 and 14 weeks of age on the Ex1Q48-CyPet and –YPet (1:1 mixture, 1.2 μM) co-aggregation. Statistical analysis was two-way ANOVA with Bonferroni post hoc correction. The test statistic, degrees of freedom and P-values for the ANOVA are provided in Supplementary Table 7. ***P < 0.001. WT = wild type.

References

    1. Ast A, Buntru A, Schindler F, Hasenkopf R, Schulz A, Brusendorf L, et al. mHTT seeding activity: a marker of disease progression and neurotoxicity in models of Huntington’s disease. Mol Cell 2018; 71: 675–88 e6. - PubMed
    1. Bates GP, Dorsey R, Gusella JF, Hayden MR, Kay C, Leavitt BR, et al. Huntington disease. Nat Rev Dis Primers 2015; 1: 15005. - PubMed
    1. Benn CL, Fox H, Bates GP. Optimisation of region-specific reference gene selection and relative gene expression analysis methods for pre-clinical trials of Huntington’s disease. Mol Neurodegeneration 2008; 3: 17. - PMC - PubMed
    1. Benn CL, Landles C, Li H, Strand AD, Woodman B, Sathasivam K, et al. Contribution of nuclear and extranuclear polyQ to neurological phenotypes in mouse models of Huntington’s disease. Hum Mol Genet 2005; 14: 3065–78. - PubMed
    1. Bobrowska A Donmez G Weiss A Guarente L Bates G.. SIRT2 Ablation has no effect on tubulin acetylation in brain, cholesterol biosynthesis or the progression of huntington's disease phenotypes in vivo. PLoS ONE 2012; 7: e34805. - PMC - PubMed

LinkOut - more resources