

Architecture of the centriole cartwheel-containing region revealed by cryo-electron tomography
- PMID: 32954513
- PMCID: PMC7667884
- DOI: 10.15252/embj.2020106246
Architecture of the centriole cartwheel-containing region revealed by cryo-electron tomography
Abstract
Centrioles are evolutionarily conserved barrels of microtubule triplets that form the core of the centrosome and the base of the cilium. While the crucial role of the proximal region in centriole biogenesis has been well documented, its native architecture and evolutionary conservation remain relatively unexplored. Here, using cryo-electron tomography of centrioles from four evolutionarily distant species, we report on the architectural diversity of the centriole's proximal cartwheel-bearing region. Our work reveals that the cartwheel central hub is constructed from a stack of paired rings with cartwheel inner densities inside. In both Paramecium and Chlamydomonas, the repeating structural unit of the cartwheel has a periodicity of 25 nm and consists of three ring pairs, with 6 radial spokes emanating and merging into a single bundle that connects to the microtubule triplet via the D2-rod and the pinhead. Finally, we identified that the cartwheel is indirectly connected to the A-C linker through the triplet base structure extending from the pinhead. Together, our work provides unprecedented evolutionary insights into the architecture of the centriole proximal region, which underlies centriole biogenesis.
Keywords: in situ; cartwheel; centriole; cryo-electron tomography; cryo-focused ion beam milling.
© 2020 The Authors. Published under the terms of the CC BY 4.0 license.
Conflict of interest statement
The authors declare that they have no conflict of interest.
Figures

- A, B
In situ cryo‐electron tomogram displaying the proximal region of a mature mother centriole (A) and procentriole (B). Mature centriole, MC; procentriole, PC; mitochondria, mito; vacuole, vac; white dashed line, lamella edge. Scale bars, 100 nm.
- C
Side view z‐projection of cartwheels containing the central hub and several CIDs from a mature centriole. Central hub, CH; cartwheel inner density, CID. Scale bar, 20 nm.
- D
Cross section of the cartwheel‐containing region from a mature centriole. Microtubule triplet, MTT; spokes, SP. Scale bar, 200 nm.
- F
Side view z‐projection of a cartwheel containing the central hub and several CIDs from a procentriole. Scale bar, 20 nm.
- G
Cross section of the cartwheel‐containing region from a procentriole. Scale bar, 200 nm.
- H
Ninefold symmetrized cross sections of the cartwheel‐containing region from a mature centriole (left side) and a procentriole (right side). Dashed white circle, central hub. Scale bars, 100 nm.
- J
Longitudinal periodicity measurements of the central hub and CIDs. Central hub, blue; CID, red. Mean values are displayed above the data range. Blue data points are measured distance between individual units of the central hub, and red data points are measured distances between individual units of the cartwheel inner density. Mature centriole, central hub, n = 30, mean = 4.1 ± 0.67 (SD); mature centriole, cartwheel inner density, n = 18, mean = 8.7 ± 1.6 (SD); procentriole, central hub, n = 10, mean = 4.0 ± 0.66 (SD); procentriole, cartwheel inner density, n = 5, mean = 8.6 ± 1.2 (SD).
- I, J
Ninefold symmetrized central hub z‐projections, starting at the proximal end of the cartwheel and continuing distally along the cartwheel by 5.4 nm steps in a mature centriole (I) and a procentriole (J). Red arrow, CID; blue arrow; central hub. Scale bar: 20 nm.
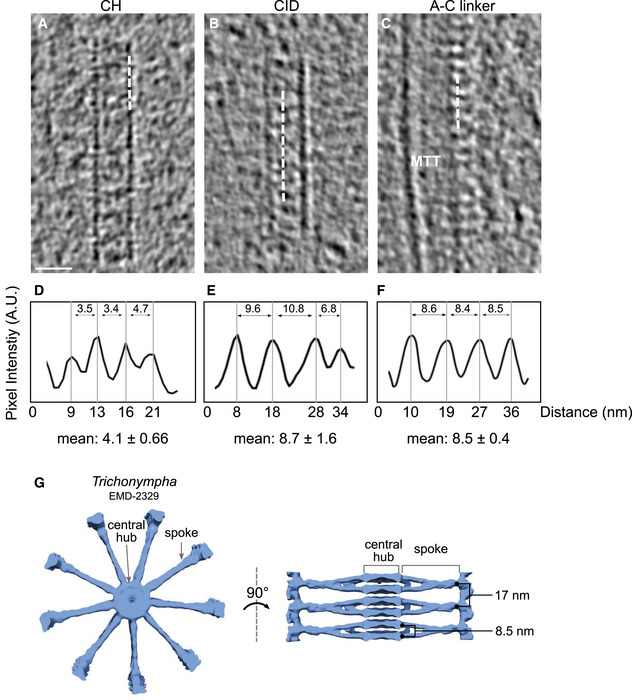
- A–C
Cryo‐ET sections depicting representative central hub (CH) (A), several cartwheel inner densities (CIDs) (B), and A‐C linker (C). Dashed white line denotes region from which plot profiles were generated. Microtubule triplet, MTT. Scale bar, 25 nm.
- D–F
Plot profiles with their associated mean periodicity displayed below.
- G
Top and side views of Trichonympha cartwheel and associated periodicities from (Guichard et al, 2013).

- A–C
Cryo‐electron tomograms of the proximal regions of a P. tetraurelia centriole (A), a N. gruberi centriole (B), and a H. sapiens procentriole (C). White arrows denote a broken cartwheel; procentriole, PC; mature centriole, MC; Scale bar, 100 nm. Note that most N. gruberi and H. sapiens centrioles were heavily compressed during the cryo‐EM preparation, as previously described (Guichard et al, 2010). The displayed N. gruberi centriole illustrates the damage caused by compression. The periodicities of N. gruberi and H. sapiens cartwheels were measured only on regions that were not damaged (see Fig EV2).
- D
Cross section from cartwheel‐containing region of a P. tetraurelia centriole. Scale bar, 50 nm.
- E
Zoomed side view of cartwheel from P. tetraurelia, displaying the central hub (CH) and several cartwheel inner densities (CIDs), white arrow. Scale bar, 25 nm.
- F
Cross section from cartwheel‐containing region of a N. gruberi centriole. Same scale bar as in (D).
- G
Zoomed side view of cartwheel from N. gruberi, displaying the central hub (CH) and several cartwheel inner densities (CIDs), white arrow. Same scale bar as in (E).
- H
Cross section from cartwheel‐containing region of a H. sapiens centriole. Same scale bar as in (D).
- I
Zoomed side view of cartwheel from H. sapiens, displaying the central hub (CH) and several cartwheel inner densities (CIDs), white arrow. Same scale bar as in (E).
- J
Longitudinal periodicity of the central hub and CIDs in P. tetraurelia, N. gruberi, and H. sapiens. Mean values are displayed above data range. Black lines indicate the mean and the standard deviation. Blue data points are measured distance between individual units of the central hub, and red data points are measured distances between adjacent cartwheel inner densities. P. tetraurelia, CH, n = 10, mean = 4.3 ± 0.38 (SD); N. gruberi, CH, n = 10, mean = 4.4 ± 0.53 (S.D); H. sapiens, CH, n = 10, mean = 4.2 ± 0.68 (S.D); P. tetraurelia, CID, n = 8, mean = 8.4 ± 1.3 (SD); N. gruberi, CID, n = 8, mean = 8.3 ± 1.8 (SD); H. sapiens, CID, n = 8, mean = 8.1 ± 2.5 (SD).
- K, L
Proximal protrusion length of the cartwheel beyond the microtubule triplets in C. reinhardtii, P. tetraurelia, N. gruberi, and H. sapiens. Internal cartwheel inside the microtubule barrel, dark blue (INT); external cartwheel beyond the microtubule wall, light blue (EXT). Mean values are displayed above each bar plot, with the black lines indicating the standard deviation (K). The start of each microtubule wall is delineated by a dashed white line (L). Mature C. reinhardtii, n = 4, external cartwheel length = 37.6 ± 3.4, internal cartwheel length = 74.2 ± 16.6; C. reinhardtii procentriole, n = 2, external cartwheel length = 52.8 ± 22.0, internal cartwheel length = 26.5 ± 29.7; P. tetraurelia, n = 23, external cartwheel length = 11.5 ± 9.2, internal cartwheel length = 66.6 ± 15.7; N. gruberi, n = 19, external cartwheel length = 41.0 ± 22.5, internal cartwheel length = 259.0 ± 87.2; human procentriole, n = 7, external cartwheel length = 23.1 ± 10.3, internal cartwheel length = 154.7 ± 47.7. Reported values are mean and errors are standard deviation. Scale bar, 50 nm.

- A–F
Side views of cartwheels in N. gruberi (A) and H. sapiens (B) with corresponding insets (C‐F) highlighting the hub periodicities (blue) and CIDs (red). Scale bar, 50 nm.
- G, H
Plot profiles of the boxed regions in (C‐F) depicting an average periodicity of the hub (blue) of 4.4 nm in N. gruberi and 4.2 nm in H. sapiens as well as for the CIDs with an average periodicity of 8.3 nm in N. gruberi and 8.1 nm in H. sapiens (see Fig 2).
- I, J
Top views of representative, compressed N. gruberi (I) and H. sapiens (J) centrioles displaying that the central hub of the cartwheel is off‐centered (white arrows). Scale bars, 100 nm.
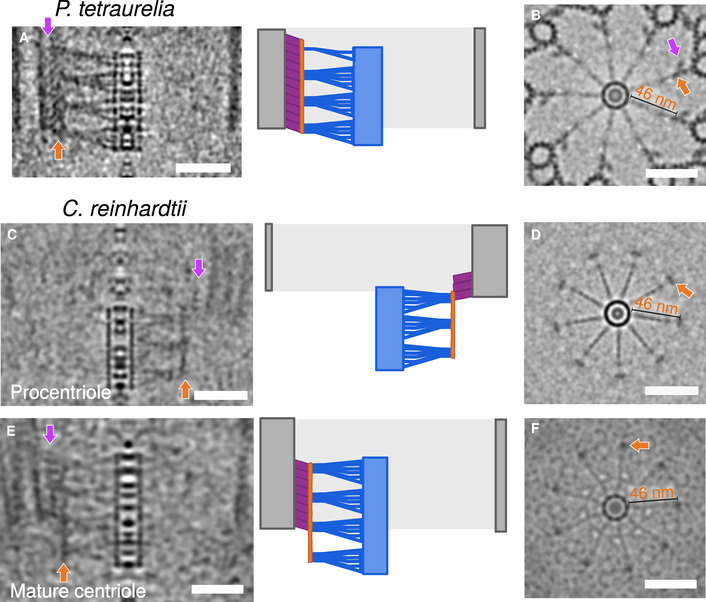
Side view of a symmetrized proximal region (left panel) from P. tetraurelia with the corresponding schematic representation (right panel) highlighting the different structural elements: cartwheel, blue; D2‐rod, dark orange; pinhead, purple; MTT, gray. Scale bar, 50 nm.
Top view of symmetrized proximal region from P. tetraurelia. The purple arrow marks the pinhead position. Dark orange arrow indicates the D2‐rod positioned 46 nm away from the central hub. Scale bar, 50 nm.
Side view of a symmetrized proximal region (left panel) from a C. reinhardtii procentriole with the corresponding schematic representation (right panel) highlighting the different structural elements: cartwheel, blue; D2‐rod, dark orange; pinhead, purple; MTT, gray. Scale bar, 50 nm.
Top view of symmetrized proximal region from a C. reinhardtii procentriole. For C. reinhardtii, the top view was obtained by z‐projecting the protruding cartwheel region only. Dark orange arrow indicates the D2‐rod positioned 46 nm away from the central hub. Scale bar, 50 nm.
Side view of a symmetrized proximal region (left panel) from a C. reinhardtii mature centriole with the corresponding schematic representation (right panel) highlighting the different structural elements: cartwheel, blue; D2‐rod, dark orange; pinhead, purple; MTT, gray. Scale bar, 50 nm.
Top view of symmetrized proximal regions from a C. reinhardtii mature centriole. For C. reinhardtii, the top view was obtained by z‐projecting the protruding cartwheel region only. Dark orange arrow indicates the D2‐rod positioned 46 nm away from the central hub. Scale bar, 50 nm.

Top view of cartwheel reconstruction from P. tetraurelia. Scale bar, 50 nm. Dark orange arrow marks the D2‐rod. Purple arrow marks part of the pinhead. Dotted yellow box with arrows denotes the central hub‐focused reslice shown in panel B; dashed white box with arrows denotes the spoke‐focused reslice shown in panel D.
Reslice of central hub‐containing region with spokes in P. tetraurelia. Scale bar, 50 nm. Dashed light yellow line denotes the zoomed view shown in panel C, black line with arrows indicates the ˜25 nm repeat distance between D1 densities formed by merged spokes. Dark orange arrow marks the D2‐rod.
Zoomed view displaying periodic repeats of the central hub (CH) and several cartwheel inner densities (CIDs) in P. tetraurelia. CIDs, red arrowheads and red plot profile; CH, blue arrowheads and blue plot profile. Overlay between CID and CH peaks is plotted on the right in red and blue. Mean distance between CID peaks, red 8.6 ± .8 (n = 5). Distances between CH peaks split into two distinct populations: smaller (within a ring pair), green 3.1 ± 1.3 (n = 6); larger (between ring pairs), blue 5.5 ± .7 (n = 5); average periodicity, black 4.2 ± 1.3 (n = 11).
Serial z‐projections of ˜4 nm thickness from one cartwheel repeat unit of P. tetraurelia. Left‐most z‐projections display the central hub, and right‐most projection shows the microtubule wall. Blue circles delineate one ring pair. White arrows mark individual emanating spokes. White arrowheads mark fused spokes. White dashed line follows the tilt of the spokes. Black arrow indicates the final merged spoke (D1 density). Dark orange arrow marks the D2‐rod. Scale bar, 50 nm.
Top view of cartwheel reconstruction from C. reinhardtii. Scale bar, 50 nm. Dark orange arrow marks the D2‐rod. Purple arrow marks part of the pinhead. Dotted yellow box with arrows denotes the central hub‐focused reslice shown in panel F; dashed white box with arrows denotes the spoke‐focused reslice shown in panel H.
Reslice of central hub‐containing region with spokes in C. reinhardtii. Scale bar, 50 nm. Dashed light yellow line denotes the zoomed view shown in panel G, black line with arrows indicates the ˜25 nm repeat distance between D1 densities formed by merged spokes. Dark orange arrow marks the D2‐rod.
Zoomed view displaying periodic repeats of the central hub (CH) and several cartwheel inner densities (CIDs) in C. reinhardtii. CIDs, red arrowheads and red plot profile; CH, blue arrowheads and blue plot profile. Overlay between CID and CH peaks is plotted on the right in red and blue. Mean distance between CID peaks, red 8.8 ± 1.0 (n = 5). Distances between CH peaks split into two distinct populations: smaller (within a ring pair), green 3.5 ± 1.3 (n = 6); larger (between ring pairs), blue 5.1 ± 0.4 (n = 5); average periodicity, black 4.2 ± 1.3 (n = 11).
Serial z‐projections of ˜4 nm thickness from one cartwheel repeat unit of C. reinhardtii. Left‐most z‐projections display the central hub, and right‐most projection shows the microtubule wall. Blue circles delineate one ring pair. White arrows mark individual emanating spokes. White arrowheads mark fused spokes. White dashed line follows the tilt of the spokes. Black arrow indicates the final merged spoke (D1 density). Dark orange arrow marks the D2‐rod. Scale bar, 50 nm.
Three‐dimensional rendering of the cartwheel reconstruction from P. tetraurelia. Left side, cartwheel oriented along the correct proximal–distal axis; right side, inverted proximal–distal axis, showing the asymmetry of spoke inclination. Dark orange arrows indicate the D2‐rod. Purple arrows indicate part of the pinhead. Dashed yellow box, inset of one spoke unit, with the major and minor tilt angles of the spokes relative to the central hub. White asterisks denote subunits of ring pairs. For three‐dimensional rendering of the C. reinhardtii cartwheel, see Fig EV4C.
Model of P. tetraurelia (left side) and C. reinhardtii (right side) cartwheel structures. Dashed gray box denotes one repeat unit of the cartwheel, dashed black lines, and boxes display cross sections of spokes.

- A, B
Serial z‐projections of ˜4 nm thickness through subtomogram averages of P. tetraurelia (A) and C. reinhardtii (B) cartwheels. The left‐most z‐projections display the central hub, and the right‐most projections show the pinhead. Yellow dashed lines delineate one repeat unit of the cartwheel. Blue circles indicate central hub ring pairs, white arrows mark individual spokes, white arrowheads mark fused spokes, white dashed lines indicate the spoke tilt, black arrows with a line mark the final merged spoke (D1 density) longitudinally spaced every 25 nm, and dark orange arrows indicate the D2‐rod. Scale bars, 50 nm.
- C
Three‐dimensional rendering of the cartwheel reconstruction from C. reinhardtii. Right panel, cartwheel oriented along the proximal–distal axis (left side) and oriented along the inverted proximal–distal axis (right side), showing the slight asymmetry of spoke inclination. Dark orange arrows indicate the D2‐rod. Dashed yellow box, inset of one spoke unit (left panel), with the major and minor tilt angles of the spokes relative to the central hub. White asterisks denote subunits of ring pairs.
- D
Bandpass filter applied to a P. tetraurelia subtomogram average projection with a cutoff at 38 Å. Blue arrows denote positions of the associated plot profiles through the central hub for the unfiltered (left) and filtered projections (right), respectively. The unfiltered projection displays a mean periodicity of 4.0 ± 1.3 nm (SEM), while the projection filtered to 38 Å displays a mean periodicity of 8.6 ± 0.4 nm (SEM). Scale bar, 20 nm.
- E
Plot profile along the previously published Trichonympha central hub (dark blue) (EMD‐2329) displaying a longitudinal periodicity of 8.2 nm. Scale bar, 20 nm.

- A
Cryo‐electron tomogram of P. tetraurelia centriole. Blue arrow denotes cartwheel, and orange arrow denotes inner scaffold. White dashed box delimits the inset represented in (D, E). Red lines and arrows indicate the position and the direction of the cross sections made in (B). Scale bar, 100 nm.
- B
Ninefold symmetrizations of serial cross sections taken along the proximal to distal axis in P. tetraurelia. Each section is a z‐projection of 20.7 nm. White dashed circles delineate the structures highlighted in C. Scale bar, 60 nm.
- C
Zoomed images from panel B of proximal centriole substructures from ninefold symmetrizations of P. tetraurelia along the proximal–distal axis. Each panel corresponds to the above image from panel B. Purple arrow, pinhead; light green arrow, triplet base; turquoise arrow, A‐C linker; orange arrow, inner scaffold. Scale bar, 50 nm.
- D
Side view showing the transition from pinhead to inner scaffold in P. tetraurelia. Scale bar, 100 nm.
- E
Cartoon representation of panel D.
- F
Representative model of a cross section of a centriole's proximal region. Colored arrows indicate the different structural features identified.
- G
Cryo‐electron tomogram of C. reinhardtii centriole. Blue arrow denotes cartwheel, and orange arrow denotes inner scaffold. White dashed box delimits the inset represented in (J, K). Red lines and arrows indicate the position and the direction of the cross sections made in (H). Same scale bar as in (A).
- H
Ninefold symmetrizations of serial cross sections taken along the proximal to distal axis in C. reinhardtii. Each section is a z‐projection of 20.7 nm. White dashed circles delineate the structures highlighted in I. Scale bar, 60 nm.
- J
Zoomed images of proximal centriole substructures from ninefold symmetrizations of C. reinhardtii along the proximal–distal axis. Each panel corresponds to the above image from panel H. Purple arrow, pinhead; light green arrow, triplet base; turquoise arrow, A‐C linker; orange arrow, inner scaffold. Scale bar, 50 nm.
- J, K
Side views showing the transition from pinhead to inner scaffold in C. reinhardtii from two consecutive sections from a tomogram. Scale bar, 100 nm.
- L
Cartoon representation combining the z‐projections in panels J and K.
- M, N
Positioning of the different structures along the proximal length from representative P. tetraurelia (M) and C. reinhardtii (N) centrioles. Distance between the ends of the pinhead and cartwheel regions is denoted by zone 1 (for quantification, see Fig EV4E). Distance between end of the pinhead region and start of the inner scaffold region is denoted by zone 2 (for quantification, see Fig EV4F).
- O
Cartwheel and A‐C linker length in C. reinhardtii (n = 5 centrioles), P. tetraurelia (n = 16 centrioles), N. gruberi (n = 11 centrioles), and H. sapiens (n = 5 centrioles). Means and standard deviations of the mean are displayed above the range. A‐C linker, turquoise; cartwheel, blue; microtubule triplets, gray.

Microtubule triplet reconstruction from the beginning of the proximal region, displayed with a low contour threshold value to show the triplet base density (green) connected to the pinhead (purple) and the A‐C linker (turquoise).
Two adjacent triplets from the beginning of proximal region, displayed with a higher contour threshold than in A. The A‐C linker is segmented into different substructures (patterned turquoise colors) according to nomenclature (Li et al, 2019). The green dashed line indicates the putative position of the triplet base. Non‐tubulin densities are colored in dark salmon and dijon. The pinhead has been hidden in this view, as its reconstruction is not correct due to the 8.5 nm initial subvolume picking that imposes this periodicity on the structure.
Three‐dimensional side view of the A‐C linker from the lumen of the centriole.
Three‐dimensional side view of the A‐C linker from outside the centriole (rotated 180° from C).
Top views of independent averages from the more proximal (gray) and more distal (blue) parts of the P. tetraurelia proximal region.
Focus on the A‐C linker from the most proximal region (left, gray), the most distal proximal region (middle, blue), and the superimposition of both structures (right).

- A
Z‐projection of the reconstructed junction between adjacent proximal microtubule triplets. The yellow dotted line and arrow indicate the position and direction of the reslice. Scale bar, 50 nm.
- B
Cross section highlighting the lateral periodicity of the A‐C linker's trunk and its associated plot profile (right) measured along the light blue dotted line. Scale bar, 50 nm.
- C
Three‐dimensional view of two adjacent proximal microtubule triplets seen from the outside of the centriole. Yellow dashed lines indicate the position of the A‐tusk from the adjacent triplet. The double‐headed red arrow indicates the longitudinal shift between the position of two consecutive A‐tusks along the centriole's long axis.
- D
Projection image of two adjacent proximal microtubule triplets. The red line indicates the position of the cross section shown in (E). Scale bar, 50 nm.
- E
Cross section of two proximal microtubules triplets showing the longitudinal shift of the A‐tusk on one triplet (A‐tusk 2) compared to the A‐tusk on the adjacent triplet (A‐tusk 1). Horizontal line along two consecutive MTTs crossing an A‐tusk 2. The red arrows indicate the distances between the A‐tusk 2 position along z with the A‐tusks 1 (one upper, one lower) from the following MTT. Scale bar, 50 nm.
- F–H
Three‐dimensional views of P. tetraurelia (F), C. reinhardtii (G, EMD‐9174, filtered to 45 Å), and Trichonympha (H, EMD‐2330). The dotted red lines define the distance between consecutive microtubule triplets. Note that this distance varies between species. Microtubule triplets are in gray, and the A‐C linker is in light blue/green. Dashed blue: arms A and B, blue: trunk, red: legs. Dark green: A‐tusk.

Similar articles
-
Novel features of centriole polarity and cartwheel stacking revealed by cryo-tomography.EMBO J. 2020 Nov 16;39(22):e106249. doi: 10.15252/embj.2020106249. Epub 2020 Sep 20. EMBO J. 2020. PMID: 32954505 Free PMC article.
-
Native architecture of the centriole proximal region reveals features underlying its 9-fold radial symmetry.Curr Biol. 2013 Sep 9;23(17):1620-8. doi: 10.1016/j.cub.2013.06.061. Epub 2013 Aug 8. Curr Biol. 2013. PMID: 23932403
-
Cell-free reconstitution reveals centriole cartwheel assembly mechanisms.Nat Commun. 2017 Mar 23;8:14813. doi: 10.1038/ncomms14813. Nat Commun. 2017. PMID: 28332496 Free PMC article.
-
Centriole structure.Philos Trans R Soc Lond B Biol Sci. 2014 Sep 5;369(1650):20130457. doi: 10.1098/rstb.2013.0457. Philos Trans R Soc Lond B Biol Sci. 2014. PMID: 25047611 Free PMC article. Review.
-
The Rise of the Cartwheel: Seeding the Centriole Organelle.Bioessays. 2018 Apr;40(4):e1700241. doi: 10.1002/bies.201700241. Epub 2018 Mar 6. Bioessays. 2018. PMID: 29508910 Review.
Cited by
-
How COVID-19 Hijacks the Cytoskeleton: Therapeutic Implications.Life (Basel). 2022 May 30;12(6):814. doi: 10.3390/life12060814. Life (Basel). 2022. PMID: 35743845 Free PMC article.
-
The Endothelial Centrosome: Specific Features and Functional Significance for Endothelial Cell Activity and Barrier Maintenance.Int J Mol Sci. 2023 Oct 20;24(20):15392. doi: 10.3390/ijms242015392. Int J Mol Sci. 2023. PMID: 37895072 Free PMC article. Review.
-
Time-series reconstruction of the molecular architecture of human centriole assembly.Cell. 2024 Apr 25;187(9):2158-2174.e19. doi: 10.1016/j.cell.2024.03.025. Epub 2024 Apr 10. Cell. 2024. PMID: 38604175 Free PMC article.
-
Cryo-electron tomography on focused ion beam lamellae transforms structural cell biology.Nat Methods. 2023 Apr;20(4):499-511. doi: 10.1038/s41592-023-01783-5. Epub 2023 Mar 13. Nat Methods. 2023. PMID: 36914814 Review.
-
Molecular architectures of centrosomes in C. elegans embryos visualized by cryo-electron tomography.Dev Cell. 2025 Mar 24;60(6):885-900.e5. doi: 10.1016/j.devcel.2024.12.002. Epub 2024 Dec 24. Dev Cell. 2025. PMID: 39721584
References
-
- Azimzadeh J, Bornens M (2007) Structure and duplication of the centrosome. J Cell Sci 120: 2139–2142 - PubMed
-
- van Breugel M, Hirono M, Andreeva A, Yanagisawa H‐A, Yamaguchi S, Nakazawa Y, Morgner N, Petrovich M, Ebong I‐O, Robinson CV et al (2011) Structures of SAS‐6 suggest its organization in centrioles. Science 331: 1196–1199 - PubMed
Publication types
MeSH terms
Grants and funding
LinkOut - more resources
Full Text Sources
Other Literature Sources
