. 2020 Nov;24(21):12491-12503.
doi: 10.1111/jcmm.15785. Epub 2020 Sep 20.

C-Cbl regulates c-MPL receptor trafficking and its internalization

Affiliations

C-Cbl regulates c-MPL receptor trafficking and its internalization

Melanie Märklin et al. J Cell Mol Med. 2020 Nov.

Abstract

Thrombocyte formation from megakaryocyte and their progenitor cells is tightly regulated by thrombopoietin (TPO) and its receptor c-MPL, thereby maintaining physiological functionality and numbers of circulating platelets. In patients, dysfunction of this regulation could cause thrombocytopenia or myeloproliferative syndromes. Since regulation of this pathway is still not completely understood, we investigated the role of the ubiquitin ligase c-Cbl which was previously shown to negatively regulated c-MPL signalling. We developed a new conditional mouse model using c-Cblfl/fl Pf4Cre mice and demonstrated that platelet-specific knockout of c-Cbl led to severe microthrombocytosis and impaired uptake of TPO and c-MPL receptor internalization. Furthermore, we characterized a constitutive STAT5 activation c-Cbl KO platelets. This study identified c-Cbl as a potential player in causing megakaryocytic and thrombocytic disorders.

Keywords: C-Cbl; c-MPL; megakaryocytes; platelets; thrombocytosis.


Conflict of interest statement

The authors confirm that there are no conflicts of interest.

Figures
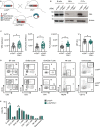
FIGURE 1
FIGURE 1
C‐Cbl‐deficient mice showed increased microthrombocytosis and lymphocytosis. A, Mouse breeding scheme to generate c‐Cblfl/flPf4Cre mice. B, c‐CBL protein expression in CD19+ B cells, megakaryocytes and platelets from c‐Cblfl/fl and c‐Cblfl/flPf4Cre mice assessed by Western blotting. Actin was used as loading control. C, White blood count (WBC), lymphocytes, platelet numbers (PLTs) and mean platelet volume (MPV) (n = 65‐66 per group) were analysed in c‐Cblfl/fl and c‐Cblfl/flPf4Cre mice at an age of 8‐16 wk (Mean ± SEM, *P ≤ .05). D, Representative FACS blots for flow cytometric analysis of B cells (CD19+), T (CD3+, CD3+CD4+, CD3+CD8+) cells, B1 (CD19+CD5+) and B2 (CD19+CD5) B cells, NK cells (Nkp46+) and granulocytes (Gr‐1+CD11b+) in the peripheral blood of c‐Cblfl/fl and c‐Cblfl/flPf4Cre mice at an age of 12‐16 wk. E, Flow cytometric analysis of the peripheral blood of c‐Cblfl/fl and c‐Cblfl/flPf4Cre mice at an age of 12‐16 wk (n = 9 per group, Mean ± SEM, *P ≤ .05)
FIGURE 2
FIGURE 2
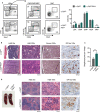
C‐Cbl‐deficient mice showed increased megakaryopoiesis. A, Representative FACS blots for flow cytometric analysis of LSKs (LinSca‐1+c‐kit+), CMPs (LinSca‐1c‐kit+CD34CD16/32), GMPs (LinSca‐1c‐kit+CD34+CD16/32), MEPs (LinSca‐1c‐kit+CD34+CD16/32+) and MkP (LinSca‐1c‐kit+CD41+CD150+) in the bone marrow and combined data of c‐Cblfl/fl and c‐Cblfl/flPf4cre mice at an age of 12‐16 wk (n = 4 per group, Mean ± SEM, *P ≤ .05). B, H&E staining, Gomori staining and immunohistochemistry for GPIbα of paraffin‐embedded bone marrow sections of one representative c‐Cblfl/fl and c‐Cblfl/flPf4cre mouse (age: 16‐18 wk). C, Number of GPIbα+ megakaryocytes per image (n = 2) identified by immunohistochemistry of paraffin‐embedded bone marrow sections of c‐Cblfl/fl and c‐Cblfl/flPf4cre mice (age: 16‐18 wk) (n = 3 per group, *P ≤ .05). D, A representative picture of spleens from c‐Cblfl/fl and c‐Cblfl/flPf4cre mice (age: 30 wk) (left) and H&E staining and immunohistochemistry for GPIbα of paraffin‐embedded spleen sections of one representative c‐Cblfl/fl and c‐Cblfl/flPf4cre mouse (age: 16‐18 wk) (right)
FIGURE 3
FIGURE 3
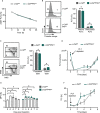
c‐Cblfl/flPf4Cre mice showed increased platelet recovery. A, c‐Cblfl/fl and c‐Cblfl/flPf4Cre mice (n = 4 per group, 10‐14 wk old) were iv injected with X488 (2 µg) antibody, and platelets lifespan was assessed by flow cytometry at the indicated time‐points (Mean ± SEM). B, RNA of platelets of c‐Cblfl/fl and c‐Cblfl/flPf4Cre mice (n = 6, 10‐14 wk old) was analysed with thiazole orange (TO) staining by flow cytometry. Representative plots of mature TO platelets and reticulated TO+ platelets (left) and combined results (right) (n = 10 mice per group, Mean ± SEM, *P ≤ .05). C, To determine the turnover of platelets, c‐Cblfl/fl and c‐Cblfl/flPf4Cre mice were iv injected with X488 (0.15 µg/g bodyweight) antibody and 24 h later iv injected with NHS‐biotin (600 µg). Platelets were analysed for double labelling (population label) and NHS single labelling (cohort label) after 3 h by flow cytometry (n = 3‐4 mice per group, 10‐14 wk old) (Mean ± SEM, *P ≤ .05). D, c‐Cblfl/fl and c‐Cblfl/flPf4Cre mice were analysed for initial platelet counts in the peripheral blood followed by platelet depletion with i.p. injection of R300 (3 µg/g bodyweight) antibody. Platelet recovery was monitored for 8 d. Combined data of three independent experiments are shown (n = 3‐7 mice per group, 10‐14 wk old) (Mean ± SEM, *P ≤ .05). E, MPV of platelets before (n = 7 per group) and after the depletion were analysed (Mean ± SEM, *P ≤ .05). F, c‐Cblfl/fl and c‐Cblfl/flPf4Cre mice were analysed for reticulated platelet by thiazole orange staining by flow cytometry followed by platelet depletion with i.p. injection of R300 (3 µg/g bodyweight) antibody. Reticulated platelet recovery was monitored for 7 d (n = 3 mice per group, 10‐14 wk old) (Mean ± SEM, *P ≤ .05)
FIGURE 4
FIGURE 4
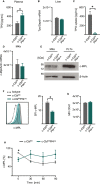
c‐Cblfl/flPf4Cre mice showed impaired TPO uptake and c‐Mpl internalization. A, Plasma of c‐Cblfl/fl and c‐Cblfl/flPf4Cre mice was harvested and TPO plasma levels were measured by ELISA (n = 10 mice per group, 10‐14 wk old) (Mean ± SEM, *P ≤ .05). B, TPO mRNA of livers from c‐Cblfl/fl and c‐Cblfl/flPf4Cre mice were analysed by qRT‐PCR. TPO gene expression was normalized to Gapdh (n = 5‐6 mice per group, 10‐14 wk old) (Mean ± SEM). C, To determine the TPO uptake platelets of c‐Cblfl/fl and c‐Cblfl/flPf4Cre mice were harvested and stimulated with TPO (2 ng/mL) for 2 h. TPO levels in the supernatant were measured by ELISA and the TPO uptake was calculated as follows TPOpg/mLuntreatedcontrolTPOpg/mL1×106Platelets (n = 8 mice per group, 10‐12 wk old) (Mean ± SEM, *P ≤ .05). D, Megakaryocytes were generated from bone marrow of c‐Cblfl/fl and c‐Cblfl/flPf4Cre mice. C‐Mpl mRNA level were measured by qRT‐PCR and normalized to Actin expression (n = 5‐6 per group, 12‐16 wk old) (Mean ± SEM). E, Megakaryocytes were generated from bone marrow of c‐Cblfl/fl and c‐Cblfl/flPf4Cre mice and platelets were harvested. Expression of c‐MPL was assessed by Western blot analysis. One exemplary result with β‐Actin as loading control is shown. F, Platelets of c‐Cblfl/fl and c‐Cblfl/flPf4Cre were stained for c‐MPL surface expression. SFIs were calculated with respective isotype controls (n = 3‐4 per group, 10‐14 wk old) (Mean ± SEM, *P ≤ .05). G, Platelets of c‐Cblfl/fl and c‐Cblfl/flPf4Cre were stained for CD41 surface expression (n = 4 per group, 10‐14 wk old) (Mean ± SEM). H, Platelets of c‐Cblfl/fl and c‐Cblfl/flPf4Cre mice were isolated and treated with TPO (25 ng/mL) for the indicated time‐points. C‐MPL internalization was measured by flow cytometry. Combined data of three independent experiments is shown (n = 3‐5 per group, 10‐14 wk old) (Mean ± SEM, *P ≤ .05)
FIGURE 5
FIGURE 5
PLTs of c‐Cblfl/flPf4Cre mice showed impaired c‐MPL receptor signalling. After staining of bone marrow cells and PLTs cells were stimulated with 100 ng/mL TPO for the indicated time‐points and c‐Mpl receptor activation was assessed by intracellular staining of STAT5/P‐STAT5(Y694) and ERK1/2/P‐ERK1/2(T202/Y204) in LSKs (LinSca‐1+c‐kit+), MkP (LinSca‐1c‐kit+CD41+CD150+) and PLTs (CD41+) with flow cytometry. A, Total STAT5 and ERK protein expression in LSKs, MkPs and PLTs of one representative result out of three independent experiments is shown. B, Exemplary results for P‐STAT5 and P‐ERK induction after TPO stimulation of LSKs, MkPs and PLTs for one representative mouse per genotype (12‐16 wk old) are shown. C, Pooled result of P‐STAT5+ and P‐ERK1/2+ for LSKs (n = 6‐8 per group), MkPs (n = 5‐7) and PLTs (n = 5‐8 per group) at the indicated time‐points of is shown (Mean ± SEM, *P ≤ .05). D, Induction of P‐STAT5+ and P‐ERK1/2+ in LSKs, MkPs and PLTs was calculated by “% positive cells at x min” − “% positive cells at 0 min” (Mean ± SEM, *P ≤ .05)

References

    1. Kaushansky K. Thrombopoietin and the hematopoietic stem cell. Ann N Y Acad Sci. 2005;1044:139‐141. - PubMed
    1. Kaushansky K, Drachman JG. The molecular and cellular biology of thrombopoietin: the primary regulator of platelet production. Oncogene. 2002;21(21):3359‐3367. - PubMed
    1. Fox N, Priestley G, Papayannopoulou T, Kaushansky K. Thrombopoietin expands hematopoietic stem cells after transplantation. J Clin Invest. 2002;110(3):389‐394. - PMC - PubMed
    1. Geddis AE. Congenital amegakaryocytic thrombocytopenia and thrombocytopenia with absent radii. Hematol Oncol Clin North Am. 2009;23(2):321‐331. - PMC - PubMed
    1. Steinberg O, Gilad G, Dgany O, et al. Congenital amegakaryocytic thrombocytopenia‐3 novel c‐MPL mutations and their phenotypic correlations. J Pediatr Hematol Oncol. 2007;29(12):822‐825. - PubMed

Publication types