. 2020 Sep 21:9:e53994.
doi: 10.7554/eLife.53994.

AANAT1 functions in astrocytes to regulate sleep homeostasis

Affiliations

AANAT1 functions in astrocytes to regulate sleep homeostasis

Sejal Davla et al. Elife. .

Abstract

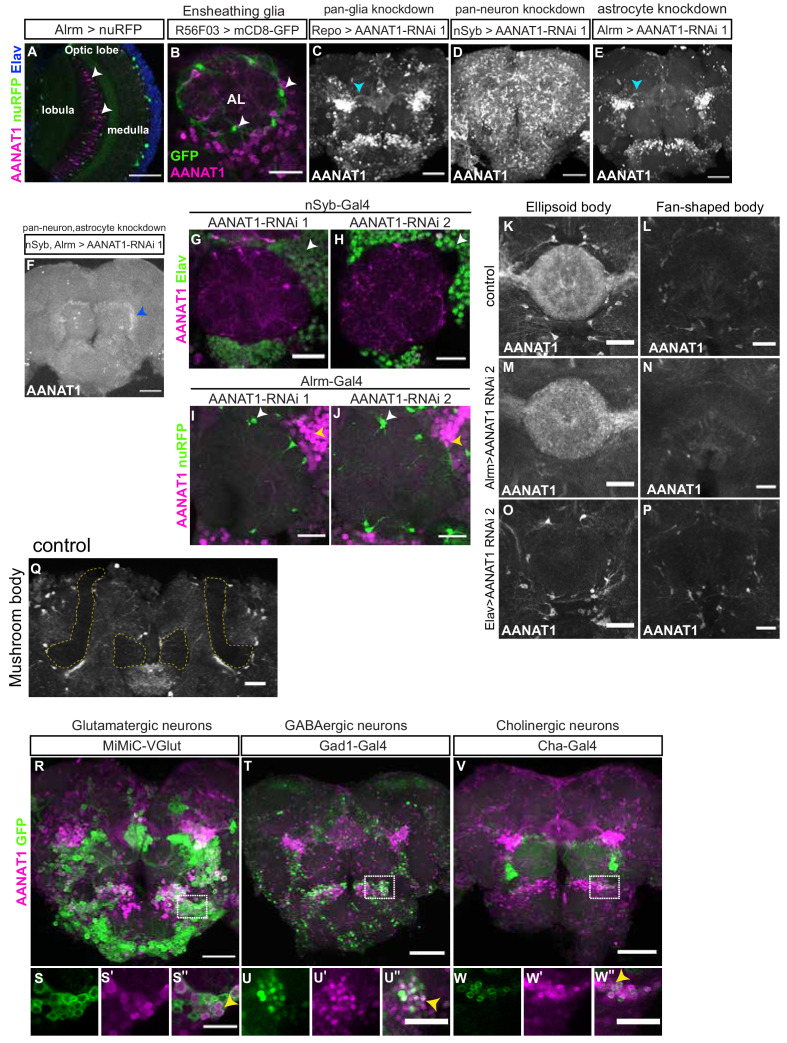
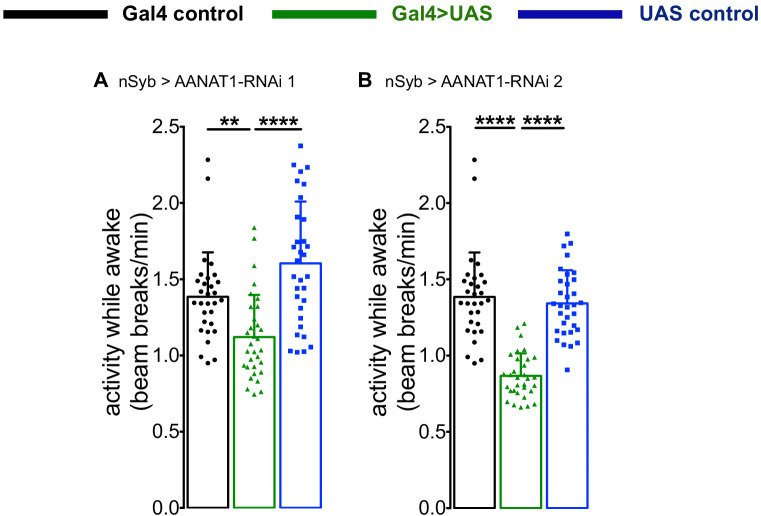
How the brain controls the need and acquisition of recovery sleep after prolonged wakefulness is an important issue in sleep research. The monoamines serotonin and dopamine are key regulators of sleep in mammals and in Drosophila. We found that the enzyme arylalkylamine N-acetyltransferase 1 (AANAT1) is expressed by Drosophila astrocytes and specific subsets of neurons in the adult brain. AANAT1 acetylates monoamines and inactivates them, and we found that AANAT1 limited the accumulation of serotonin and dopamine in the brain upon sleep deprivation (SD). Loss of AANAT1 from astrocytes, but not from neurons, caused flies to increase their daytime recovery sleep following overnight SD. Together, these findings demonstrate a crucial role for AANAT1 and astrocytes in the regulation of monoamine bioavailability and homeostatic sleep.

Keywords: AANAT1; D. melanogaster; astrocytes; dopamine; monoamines; neuroscience; serotonin; sleep.

Plain language summary

Sleep is essential for our physical and mental health. A lack of sleep can affect our energy and concentration levels and is often linked to chronic illnesses and mood disorders. Sleep is controlled by an internal clock in our brain that operates on a 24-hour cycle, telling our bodies when we are tired and ready for bed, or fresh and alert to start a new day. In addition, the brain tracks the need for sleep and drives the recovery of sleep after periods of prolonged wakefulness – a process known as sleep-wake homeostasis. Chemical messengers in the brain such as dopamine and serotonin also play an important part in regulating our sleep drive. While dopamine keeps us awake, serotonin can both prevent us from and help us falling asleep, depending on the part of the brain in which it is released. Most research has focused on the role of different brain circuits on sleep, but it has been shown that a certain type of brain cell, known as astrocyte, may also be important for sleep regulation. So far, it has been unclear if astrocytes could be involved in regulating the need for recovery sleep after a sleep-deprived night – also known as rebound sleep. Now, Davla, Artiushin et al. used sleep-deprived fruit flies to investigate this further. The flies were kept awake over 12 hours (from 6pm to 6am), using intermittent physical agitation. The researchers found that astrocytes in the brains of fruit flies express a molecule called AANAT1, which peaked at the beginning of the night, declined as the night went on and recovered by morning. In sleep deprived flies, it inactivated the chemical messengers and so lowered the amount of dopamine and serotonin in the brain. However, in mutant flies that lacked AANAT1, both dopamine and serotonin levels increased in the brain after sleep deprivation. When AANAT1 was selectively removed from astrocytes only, sleep-deprived flies needed more rebound sleep during the day to make up for lost sleep at night. This shows that both astrocytes and AANAT1 play a crucial role in sleep homeostasis. Molecules belonging to the AANAT family exist in both flies and humans, and these results could have important implications for the science of sleep. The study of Davla, Artiushin et al. paves the way for understanding the mechanisms of sleep homeostasis that are similar in both organisms, and may in the future, help to identify sleep drugs that target astrocytes and the molecules they express.


Conflict of interest statement

SD, GA, YL, DC, SL, Dv No competing interests declared, AS Reviewing editor, eLife

Figures

Figure 1.
Figure 1.. AANAT1 expression in the adult Drosophila brain.
(A–B) AANAT1 IHC in the ventral nerve cords of age-matched embryos (stage 17) of a w1118 control (A) and an AANAT1-null homozygous for Df(BSC)356 (B). (C–M) AANAT1 IHC in the central brain of adults. (C) Z-stack projection showing AANAT1 (green) and neuropil marker nc82 (magenta) in Alrm-Gal4/+ control animals. (D–D') Single optical slice showing AANAT1 (magenta) and the pan-neuronal marker Elav (green). Yellow arrowheads point to neurons co-expressing both (D'). (E–E'). Single optical slice of AANAT1 (magenta) and the pan-glial marker Repo (green) in control animals where most glia express AANAT1 (E'; yellow arrowheads), but not all (E'; white arrowheads). AL = antennal lobe. Glia were labeled less intensely for AANAT1 than neurons, and so the adjusted imaging parameters reveal higher background levels in the antennal lobe than seen in D-D'. (F–F'') Single slice of AANAT1 (magenta), Elav (blue), and astrocyte marker Alrm-Gal4; UAS-nuRFP (Alrm >nuRFP, green) showing co-expression of AANAT1 and nuRFP in astrocytes (F''; yellow arrowheads) and with Elav (F''; yellow asterisk). (G–G'') MCFO-labeled single-cell astrocyte clones (anti-V5, green) co-labeled with AANAT1 (magenta). Yellow arrowheads indicate AANAT1-positive astrocyte cell bodies and cytoplasm. AL = antennal lobe. (H–M'') Z-stack projections and single=slice images of AANAT1 (magenta) and GFP (green) IHC in monoaminergic neurons labeled with type-specific Gal4 drivers. Dotted boxes in H, J and L show regions approximating those selected for imaging at higher power in animals of the same genotypes shown in I, K and M, respectively. AANAT1 is expressed in some serotonergic neurons (I''; yellow arrowhead), but not in dopaminergic or octopaminergic neurons (K'', M''; white arrowheads). (N) Quantification of the mean number of GFP-positive and GFP/AANAT1 double-positive cells in the central brains of animals where Gal4 is used to express GFP in serotonergic (green), dopaminergic (blue) or octopaminergic (red) neurons. Error bars represent standard deviation. (O) Summary of AANAT1 expression in cell types of the adult Drosophila central brain. Scale bars in A, B, D-G, I, K, M = 20 µm. Scale bars in C, H, J, L = 50 μm.
Figure 1—figure supplement 1.
Figure 1—figure supplement 1.. AANAT1 expression in the adult Drosophila brain.
(A) Single optical slice showing AANAT1 (magenta), Elav (blue) and Alrm >nuRFP (green), with AANAT1-negative astrocytes (white arrowheads) in the optic lobe. (B) Single optical slice showing AANAT1 (magenta) and R56F03 > mCD8 GFP (green) showing absence of AANAT1 in ensheathing glia (white arrowheads). (C–F) AANAT1 expression upon AANAT1 knockdown with UAS-HMS01617 RNAi driven in all glia (C; Repo-Gal4;UAS-Dcr-2), all neurons (D; nSyb-Gal4), astrocytes (E; Alrm-Gal4,UAS-nuRFP), and both in neurons and astrocytes (F; nSyb-Gal4;Alrm-Gal4). Cyan arrowheads in C and E depict axonal bundles. Blue arrowhead in F shows background signal. (G, H) Single slices of IHC for AANAT1 (magenta) and Elav (green) showing loss of AANAT1 expression (white arrowheads) upon knockdown in neurons using nSyb-Gal4 to drive either UAS-HMS01617 (G; RNAi 1) or UAS-JF02142 (H; RNAi 2). (I, J) Single slices of IHC for AANAT1 (magenta) and Alrm >nuRFP (green) showing loss of AANAT1 expression (white arrowheads) upon knockdown in astrocytes using Alrm-Gal4 to drive RNAi 1 (I) or RNAi 2 (J). Yellow arrowheads indicate AANAT1 expression in neurons. (K–P) Z-stack projections showing AANAT1 (gray) expression in ellipsoid body (K,M,O) and fan-shaped body (L,N,P) neuropil regions in UAS-JF02142/+ controls (K,L) and upon knockdown of AANAT1 with AANAT1-RNAi2 driven in astrocytes using Alrm-Gal4 (M,N) or in neurons using Elav-Gal4 (O,P). (Q) Single-slice of AANAT1 IHC (gray) showing absence of AANAT1 expression in the α and βγ lobes of the mushroom body (outlined with dotted yellow line). (R–W'') Z-stack projections (R,T,V) and single-slice images (S-S'';U-U'';W-W'') of AANAT1 (magenta) and GFP (green) IHC in non-monoaminergic neurons labeled with type-specific drivers. Dotted boxes in R, T and V show regions approximating those selected for imaging at higher magnification in animals of the same genotypes shown in S-S'', U-U'' and W-W'', respectively. AANAT1 is expressed in subsets of glutamatergic, GABAergic and cholinergic neurons (S'', U'', W''; yellow arrowheads). Scale bars in A, C-F, R, T, V = 50 µm. Scale bars in B, G-J, K-P, S'', U'', W''=20 μm.
Figure 2.
Figure 2.. Characterization of AANAT1lo.
(A) Western blot of lysates prepared from dissected brains (ZT9-10) of iso31, AANAT1lo and AANAT1lo/Df(In(2LR)Px[4]) adult males. (B) Quantification of AANAT1 expression normalized to that of actin (mean + standard deviation, n = 3 biological replicates). (C–E) Z-stack images showing AANAT1 (gray) in iso31 (C), AANAT1lo (D) and AANAT1lo/Df(In(2LR)Px[4]) (E) animals. Blue arrowhead in E represents background signal. Scale bars = 50 µm. (F, G) Single optical slices showing AANAT1 (gray or magenta) and Elav (green) in iso31 (F, F') and AANAT1lo (G, G'). Yellow arrowhead shows AANAT1+ astrocytes. Scale bars = 20 µm. (H) Schematic of experiment for HPLC-MS analysis. (I) HPLC-MS measurement of serotonin (one-way ANOVA with Tukey’s post-hoc test, *p<0.05, **p<0.01,) and dopamine (Kruskal–Wallis test, Dunn’s multiple comparisons, *p<0.05,) in iso31 (black) and AANAT1lo (red) fly brains under control and sleep deprivation (SD) conditions. Box and whisker plots show 25–75% interquartile range (box), minimum and maximum (whiskers), median (horizontal line in box), and mean (+). n = 5 per genotype. (J) Western blot of lysates prepared from dissected brains (ZT24-25) of iso31 females in control (no SD) and SD conditions. (K) Quantification of AANAT1 (paired t-test, p=0.0831, n = 3) expression, normalized to actin levels in iso31 animals under control (no SD) and SD conditions.
Figure 2—figure supplement 1.
Figure 2—figure supplement 1.. Characterization of AANAT1lo.
(A) Quantification of Ebony expression normalized to that of actin (mean + standard deviation, n = 3 biological replicates, one-way ANOVA with Tuckey’s post-hoc test). (B) HPLC-MS measurement of octopamine (Mann-Whitney test, p<0.533) in AANAT1lo animals under control (n = 2) and SD (n = 5) conditions. Box and whisker plot as in Figure 2F. (C) Quantification of Ebony (paired t-test, p=0.7036, n = 3) expression normalized to actin levels in iso31 animals under control and SD conditions.
Figure 3.
Figure 3.. AANAT1 knockdown in neurons.
(A–D) Baseline sleep upon knockdown with UAS-HMS01617 (RNAi 1). 24 hr sleep profile showing light/dark conditions on X-axis (A), and quantification during day (ZT 0–12) versus night (ZT 12–24) of total sleep duration (B), sleep bout length (C) and bout number (D) for the nSyb-Gal4 control (black, n = 30), the UAS-HMS01617 control (blue, n = 32), and knockdown animals (nSyb >HMS01617, green, n = 32). (bar graphs show mean + standard deviation, one-way ANOVA with Tukey’s post-hoc test, *p<0.05, ***p<0.001, ****p<0.0001). (E–H) Baseline sleep upon knockdown with UAS-JF02142 (RNAi 2). (E) 24 hr sleep profile showing light/dark conditions on X-axis. Quantification of total sleep duration (F), sleep bout length (G) and bout number (H) for the nSyb-Gal4 control (black, n = 30), the UAS- JF02142 control (blue, n = 32), and knockdown animals (nSyb >JF02142, green, n = 32). The plotted nSyb-Gal4 control data is the same as in A-D, as the experiments were done simultaneously. (one-way ANOVA with Tukey’s post-hoc test, ***p<0.001, ****p<0.0001). (I, J) Recovery sleep upon knockdown with UAS-HMS01617 (RNAi 1). (I) 24 hr sleep profile of baseline and recovery days, and (J) the duration of sleep during ZT0-6 recovery period. nSyb-Gal4 control (black), the UAS-HMS01617 control (blue), and knockdown animals (nSyb >HMS01617, green). (n = 27 per genotype, one-way ANOVA with Tukey’s post-hoc test). (K, L) Recovery sleep upon knockdown with UAS-JF02142 (RNAi 2). (K) 24 hr sleep profile of baseline and recovery day, (L) duration of sleep during ZT0-6 recovery period (L). nSyb-Gal4 control (black), the UAS- JF02142 control (blue), and knockdown animals (nSyb >HMS01617, green). (n = 32 per genotype, one-way ANOVA with Tukey’s post-hoc test).
Figure 3—figure supplement 1.
Figure 3—figure supplement 1.. AANAT1 knockdown in neurons.
(A) Activity Index for knockdown with UAS-HMS01617 (RNAi 1) for the nSyb-Gal4 control (black; n = 30), the UAS-HMS01617 control (blue; n = 32), and knockdown animals (nSyb >HMS01617, green; n = 32). (B) Activity Index for knockdown with UAS-JF02142 (RNAi 2) for the nSyb-Gal4 control (black; n = 30), the UAS-JF02142 control (blue; n = 32), and knockdown animals (nSyb >HMS01617, green; n = 32).
Figure 4.
Figure 4.. AANAT1 knockdown in astrocytes.
(A) Compared with Alrm-Gal4 controls (Alrm>), the number of nuRFP labeled astrocytes in the central brain is unaffected upon RNAi knockdown of AANAT1 with HMS01617 (AANAT1-RNAi 1) or JF02142 (AANAT1-RNAi 2). Box and whisker plot as in Figure 2F. One-way ANOVA with Tukey’s post-hoc test, n = 7–9 per genotype. (B, C) Baseline sleep upon knockdown with UAS-HMS01617 (RNAi 1). 24 hr sleep profile (B), and total sleep duration (C) for the Alrm-Gal4 control (black; n = 32), the UAS-HMS01617 control (blue; n = 26), and knockdown animals (Alrm >HMS01617, green; n = 32), (one-way ANOVA with Tukey’s post-hoc test). (D, E) Baseline sleep upon knockdown with UAS-JF02142 (RNAi 2). 24 hr sleep profile (D), and total sleep duration (E) for the Alrm-Gal4 control (black; n = 32), the UAS-JF02142 control (blue; n = 32), and knockdown animals (Alrm >JF02142, green; n = 30). The plotted Alrm-Gal4 control data is the same as in B and C, as the experiments were done simultaneously, (one-way ANOVA with Tukey’s post-hoc test). (F, G) Recovery sleep upon knockdown with UAS-HMS01617 (RNAi 1). 24 hr sleep profile of baseline day and recovery day (F), and the duration of sleep during ZT0-6 recovery period (G) for the Alrm-Gal4 control (black), the UAS-HMS01617 control (blue), and knockdown animals (Alrm >HMS01617, green). (n = 31 per genotype, Kruskal–Wallis one-way ANOVA with Dunn’s post-hoc test, ****p<0.0001). (H, I) Recovery sleep upon knockdown with UAS-JF02142 (RNAi 2). 24 hr sleep profile of baseline day and recovery day (H), and the duration of sleep during ZT0-6 recovery period (I) for the Alrm-Gal4 control (black), the UAS-JF02142 control (blue), and knockdown animals (Alrm >HMS01617, green). (n = 32 per genotype, error bars are mean + standard deviation, one-way ANOVA with Tukey’s post-hoc test, ****p<0.0001). (J) HPLC-MS measurement of serotonin (Mann-Whitney t-test) and dopamine (Mann-Whitney t-test) in Alrm-Gal4 control (black; n = 7 for dopamine; n = 5 for serotonin) and Alrm >JF02142 (green; n = 6) fly brains under sleep deprivation (SD) conditions. For UAS controls (not shown), some samples fell below the limit of detection, leaving too few data points for robust statistical analysis. Box and whisker plots show 25–75% interquartile range (box), minimum and maximum (whiskers), median (horizontal line in box), and mean (+). (K) AANAT1 levels in astrocyte cell bodies normalized to nuRFP at ZT12,15,18,21 and 24 time-points. (n = 3 per time-point, 10 cells per sample, mean+ SEM).
Figure 4—figure supplement 1.
Figure 4—figure supplement 1.. AANAT1 knockdown in astrocytes.
(A) Activity Index for knockdown with UAS-HMS01617 (RNAi 1) for the Alrm-Gal4 control (black; n = 32), the UAS-HMS01617 control (blue; n = 26), and knockdown animals (Alrm >HMS01617, green; n = 32). (B) Activity Index for knockdown with UAS-JF02142 (RNAi 2) for the Alrm-Gal4 control (black; n = 32), the UAS-JF02142 control (blue; n = 32), and knockdown animals (Alrm >JF02142, green; n = 30). (C, D) Nighttime sleep (C) and activity index (D) for AANAT1lo/+ heterozygotes (gray; n = 16) and AANAT1lo homozygous mutants (red; n = 15). (Error bars are mean + standard deviation, Mann-Whitney t-test, p=0.0003). (E) Recovery sleep measured as the duration of sleep during ZT0-6 recovery period for AANAT1lo/+ heterozygous (gray; n = 32) and AANAT1lo homozygous mutants (red; n = 26). (Error bars are mean + standard deviation, Mann-Whitney t-test, p=0.0131). (F) Recovery sleep upon overexpression with UAS-AANAT1. The duration of sleep during ZT0-6 recovery period for the Alrm-Gal4 control (black), the UAS-AANAT1 control (blue), and overexpression animals (Alrm >AANAT1, brown). (n = 96 per genotype, error bars are mean + standard deviation, Kruskal-Wallis one-way ANOVA with Dunn’s post-hoc test, ****p<0.0001). (G–I'') Single slices of IHC for AANAT1 (magenta) and Alrm >nuRFP (green) showing AANAT1 expression above background levels (yellow arrowheads) in astrocytes during pupal development time 48 hr after puparium formation ( APF) (G–G''), 72 APF (H–H'') and 96 APF (I–I''). White arrowheads indicate astrocytes that do not express AANAT1. Scale bars in G'',H'',I''=20 μm. (J–K) Recovery sleep after adult-specific knockdown of AANAT1 with UAS-HMS01617 (RNAi 1) in astrocytes. 24 hr sleep profile of baseline and recovery day (J) and the duration of sleep during ZT0-6 recovery period (K). The duration of sleep during ZT0-6 recovery period (K) for the Eaat1-Gal4;tubGal80ts control (black, n = 42), the UAS-HMS01617 control (blue, n = 46), and knockdown animals (Eaat1-Gal4;tubGal80ts>HMS01617, green, n = 44). Kruskal–Wallis one-way ANOVA with Dunn’s post-hoc test, **p<0.01, ***p<0.001.

Similar articles

Cited by

References

    1. Alekseyenko OV, Lee C, Kravitz EA. Targeted manipulation of serotonergic neurotransmission affects the escalation of aggression in adult male Drosophila melanogaster. PLOS ONE. 2010;5:e10806. doi: 10.1371/journal.pone.0010806. - DOI - PMC - PubMed
    1. Andretic R, van Swinderen B, Greenspan RJ. Dopaminergic modulation of arousal in Drosophila. Current Biology. 2005;15:1165–1175. doi: 10.1016/j.cub.2005.05.025. - DOI - PubMed
    1. Artiushin G, Zhang SL, Tricoire H, Sehgal A. Endocytosis at the Drosophila blood-brain barrier as a function for sleep. eLife. 2018;7:e43326. doi: 10.7554/eLife.43326. - DOI - PMC - PubMed
    1. Artiushin G, Sehgal A. The Drosophila circuitry of sleep-wake regulation. Current Opinion in Neurobiology. 2017;44:243–250. doi: 10.1016/j.conb.2017.03.004. - DOI - PMC - PubMed
    1. Bacq A, Balasse L, Biala G, Guiard B, Gardier AM, Schinkel A, Louis F, Vialou V, Martres MP, Chevarin C, Hamon M, Giros B, Gautron S. Organic cation transporter 2 controls brain norepinephrine and serotonin clearance and antidepressant response. Molecular Psychiatry. 2012;17:926–939. doi: 10.1038/mp.2011.87. - DOI - PubMed

Publication types