. 2020 Sep 2:(163):10.3791/61515.
doi: 10.3791/61515.

Whole Animal Imaging of Drosophila melanogaster using Microcomputed Tomography

Affiliations

Whole Animal Imaging of Drosophila melanogaster using Microcomputed Tomography

Todd A Schoborg. J Vis Exp. .

Abstract

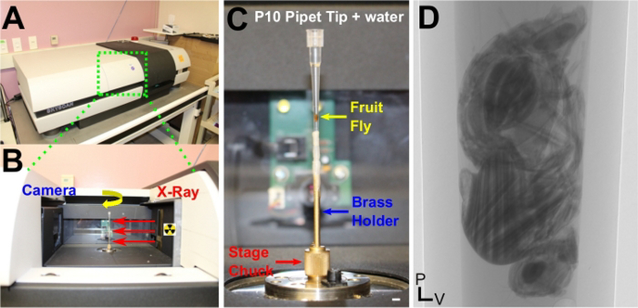
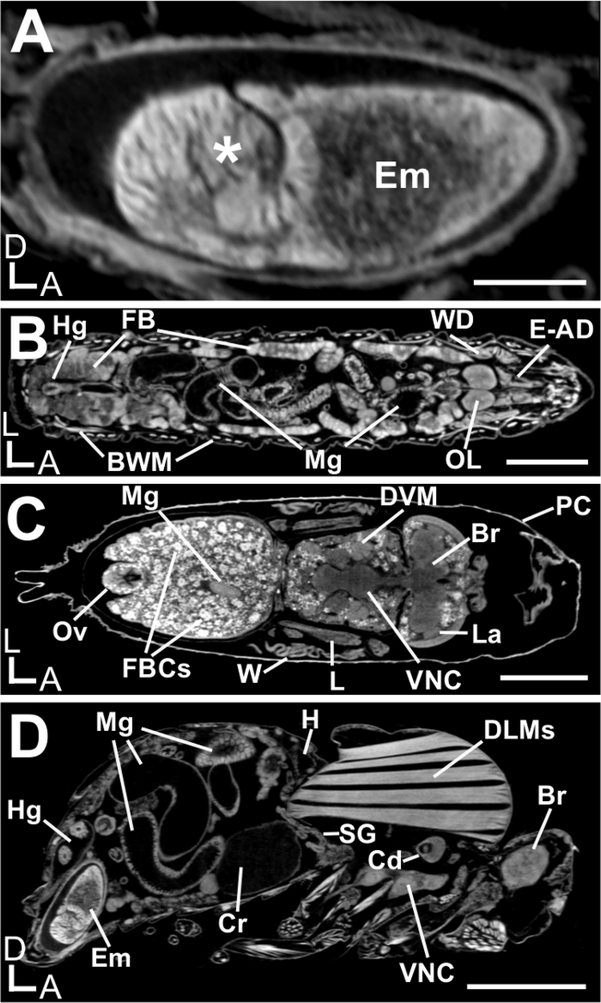
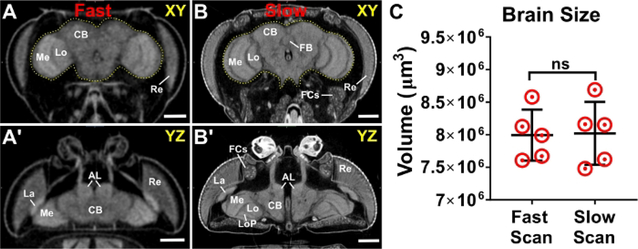
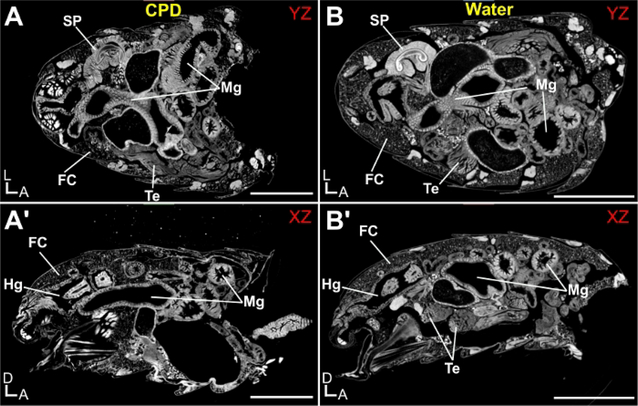
Biomedical imaging tools permit investigation of molecular mechanisms across spatial scales, from genes to organisms. Drosophila melanogaster, a well-characterized model organism, has benefited from the use of light and electron microscopy to understand gene function at the level of cells and tissues. The application of imaging platforms that allow for an understanding of gene function at the level of the entire intact organism would further enhance our knowledge of genetic mechanisms. Here a whole animal imaging method is presented that outlines the steps needed to visualize Drosophila at any developmental stage using microcomputed tomography (µ-CT). The advantages of µ-CT include commercially available instrumentation and minimal hands-on time to produce accurate 3D information at micron-level resolution without the need for tissue dissection or clearing methods. Paired with software that accelerate image analysis and 3D rendering, detailed morphometric analysis of any tissue or organ system can be performed to better understand mechanisms of development, physiology, and anatomy for both descriptive and hypothesis testing studies. By utilizing an imaging workflow that incorporates the use of electron microscopy, light microscopy, and µ-CT, a thorough evaluation of gene function can be performed, thus furthering the usefulness of this powerful model organism.


Conflict of interest statement

Disclosures

The author declares no competing or financial interests.

Figures

Figure 1:
Figure 1:. Overview of scanner design and sample mounting for μ-CT.
(A) A commercial benchtop μ-CT scanner. (B) View inside the scanner. The X-ray source (right) emits X-Rays that pass through the sample located on a rotating stage (yellow arrow). Attenuation of these X-rays generate image contrast as they pass through the sample and onto the detector, which consists of a scintillation screen that converts X-rays to photons and a standard CCD camera (left). (C) Mounting an adult fruit fly for hydrated imaging in water. The connection points between the pipette tip and the brass holder are wrapped in paraffin film to prevent leakage and potential damage to the scanner. The stage chuck is also highlighted. Note that the pipette tip was positioned slightly off-axis, which led to a longer scan time and reduced resolution in the final reconstruction. (D) A single 2D projection image of an adult female fly; hundreds to thousands of these projections are acquired during a scan along the rotation axis and are used for reconstruction to generate tomograms containing isotropic resolution and accurate 3D information. Scale Bars (C) = 2 mm. P, Posterior; V, Ventral. This figure has been modified from Schoborg et al...
Figure 2:
Figure 2:. ll Drosophila melanogaster life cycle stages, imaged by μ-CT.
A Samples stained with iodine and imaged hydrated in water. Shown is a single 2D slice. (A) An embryo that has completed the early stages of gastrulation (asterisk). (B) A third instar larva. (C) A P7 pharate adult during metamorphosis. (D) An adult female. Various organs are highlighted: BWM, body wall muscles; Br, brain; Cd, cardia; Cr, crop; DLMs, dorsal longitudinal muscles; DVM, dorsal ventral muscles; E-AD, eye-antennal disc; Em, embryo; FB, fat bodies; FBCs, fat body cells; H, heart; Hg, hindgut; La, lamina; L, leg; Mg, midgut; OL, brain optic lobe; Ov, ovipositor; PC, pupal cuticle; SG, salivary glands; VNC, ventral nerve cord; W, wing; WD, wing disc. Scale Bars (A) = 100 μm; (B)-(D) = 500 μm. D, Dorsal; A, Anterior; L, Left. Scanning parameters: Source to Sample Distance (mm): (A, D) 36.5, (B) 48.8, (C) 40.3. Source to Camera Distance (mm): (A, D) 350, (B, C) 285. Camera Pixel Size (μm): (A-D) 11.6. Image Pixel Size (μm): (A, D) 1.2, (B) 1.9, (C) 1.7.
Figure 3:
Figure 3:. Scanning parameters and image resolution do not alter morphometric analyses.
An adult head scanned using both (A, A’) ‘fast’ scanner settings (hundreds of projections) and (B, B’) ‘slow’ scanner settings (thousands of projections). The brain is outlined in yellow. (C) Brain volume measurements from slow and fast scans. Highlighted structures: AL; antennal lobe; CB, central brain; FB, fan shaped body; FCs, fat cells; La, lamina; Lo, lobula; LoP, lobula plate; Me, medulla; Re, retina. n = 5, Welch’s t-test. ns = not significant. Scale bars = 100 μm. Scanning parameters: Source to Sample Distance (mm): (A) 44.4, (B) 36.5. Source to Camera Distance (mm): (A) 348 (B) 350. Camera Pixel Size (μm): (A-B) 11.6. Image Pixel Size (μm): (A) 2.95, (B) 1.2. This figure has been modified from Schoborg et al...
Figure 4:
Figure 4:. Drosophila melanogaster abdomen imaged by X-ray Microscopy.
Abdomens were stained with 0.5% PTA and imaged hydrated (water) or following critical point drying (CPD). (A) Critical Point Dried abdomen, shown from the YZ perspective and (A’) XZ perspective. (B) Hydrated abdomen, shown from the YZ perspective and (B’) XZ perspective. Various organs are highlighted: FC, fat cells; Hg, hindgut; Mg, Midgut; SP, Sperm Pump; Te, Testes. Scale Bars (A) = 250 μm. D, Dorsal; A, Anterior; L, Left. Scanning parameters: Source to Sample Distance (mm): (A) 6.7, (B) 7. Source to Camera Distance (mm): (A) 28 (B) 29.5. Objective: (A-B) 4X. Image Pixel Size (μm): (A-B) 0.65.

References

    1. Metscher BD MicroCT for comparative morphology: simple staining methods allow high-contrast 3D imaging of diverse non-mineralized animal tissues. BMC Physiology. 9, 11 (2009). - PMC - PubMed
    1. Rahman IA, Smith SY Virtual paleontology: computer-aided analysis of fossil form and function. Journal of Paleontology. 88 (04), 633–635 (2014).
    1. Carlson WD Three-dimensional imaging of earth and planetary materials. Earth and Planetary Science Letters. 249 (3–4), 133–147 (2006).
    1. Gutiérrez Y, Ott D, Töpperwien M, Salditt T, Scherber C X-ray computed tomography and its potential in ecological research: A review of studies and optimization of specimen preparation. Ecology and Evolution. 8 (15), 7717–7732 (2018). - PMC - PubMed
    1. Abel RL et al. Digital preservation and dissemination of ancient lithic technology with modern micro-CT. Computers & Graphics. 35 (4), 878–884 (2011).

Publication types

MeSH terms

LinkOut - more resources