. 2020 Oct 14;20(10):7287-7295.
doi: 10.1021/acs.nanolett.0c02691. Epub 2020 Sep 21.

Glutathione-S-transferase Fusion Protein Nanosensor

Affiliations

Glutathione-S-transferase Fusion Protein Nanosensor

Ryan M Williams et al. Nano Lett. .

Abstract

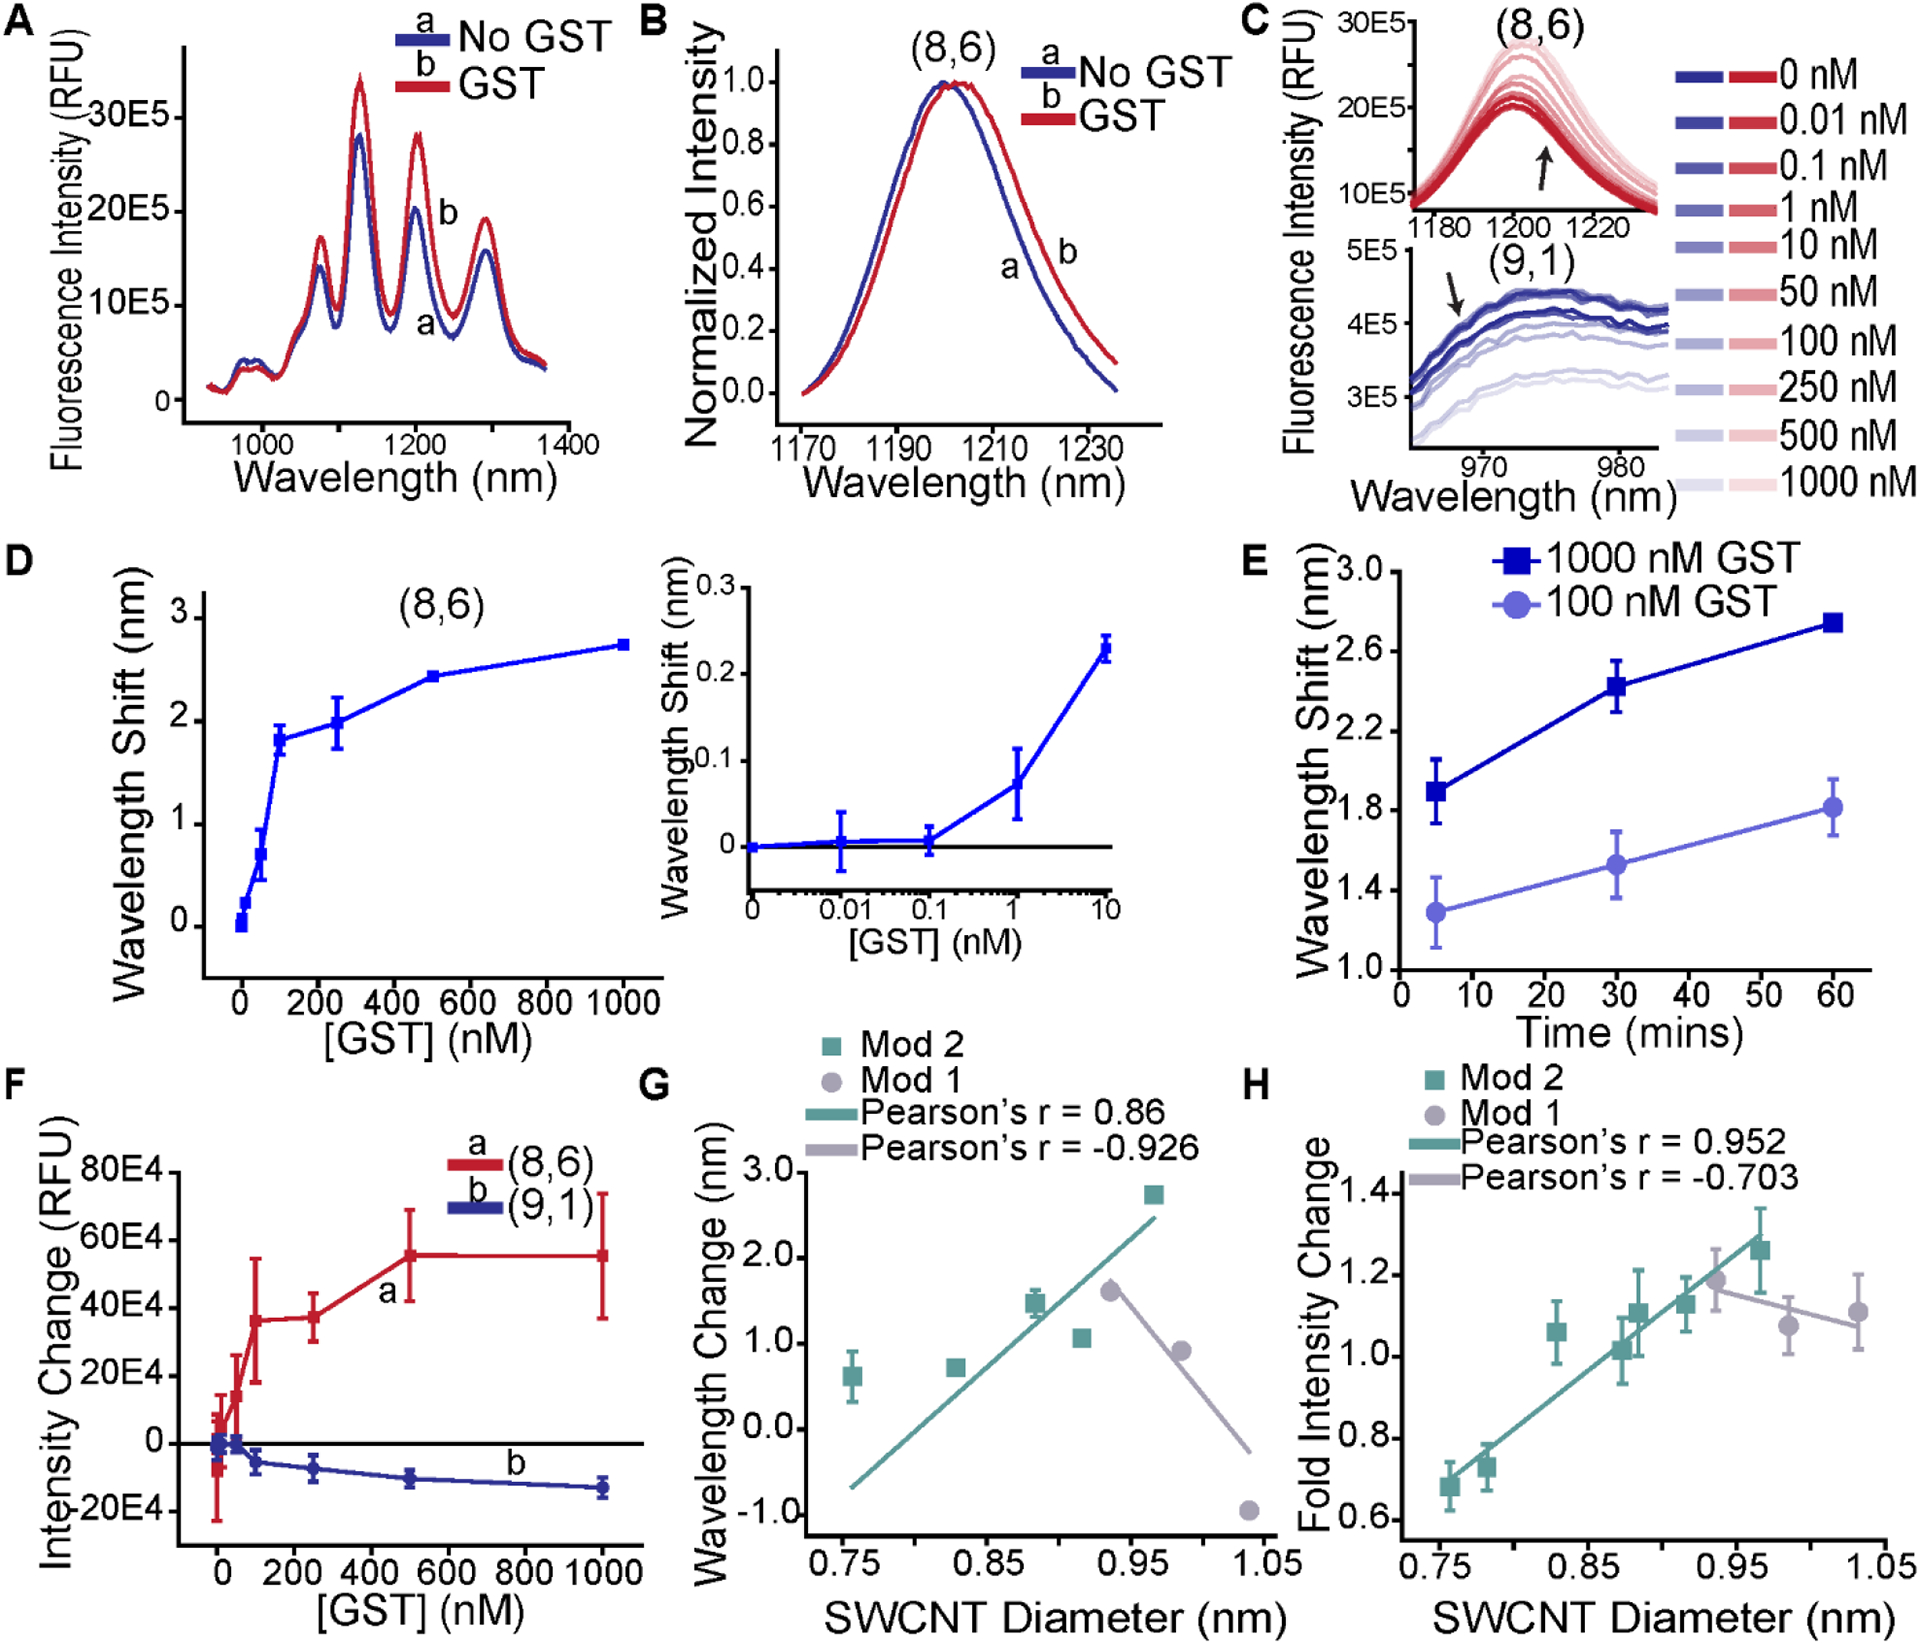
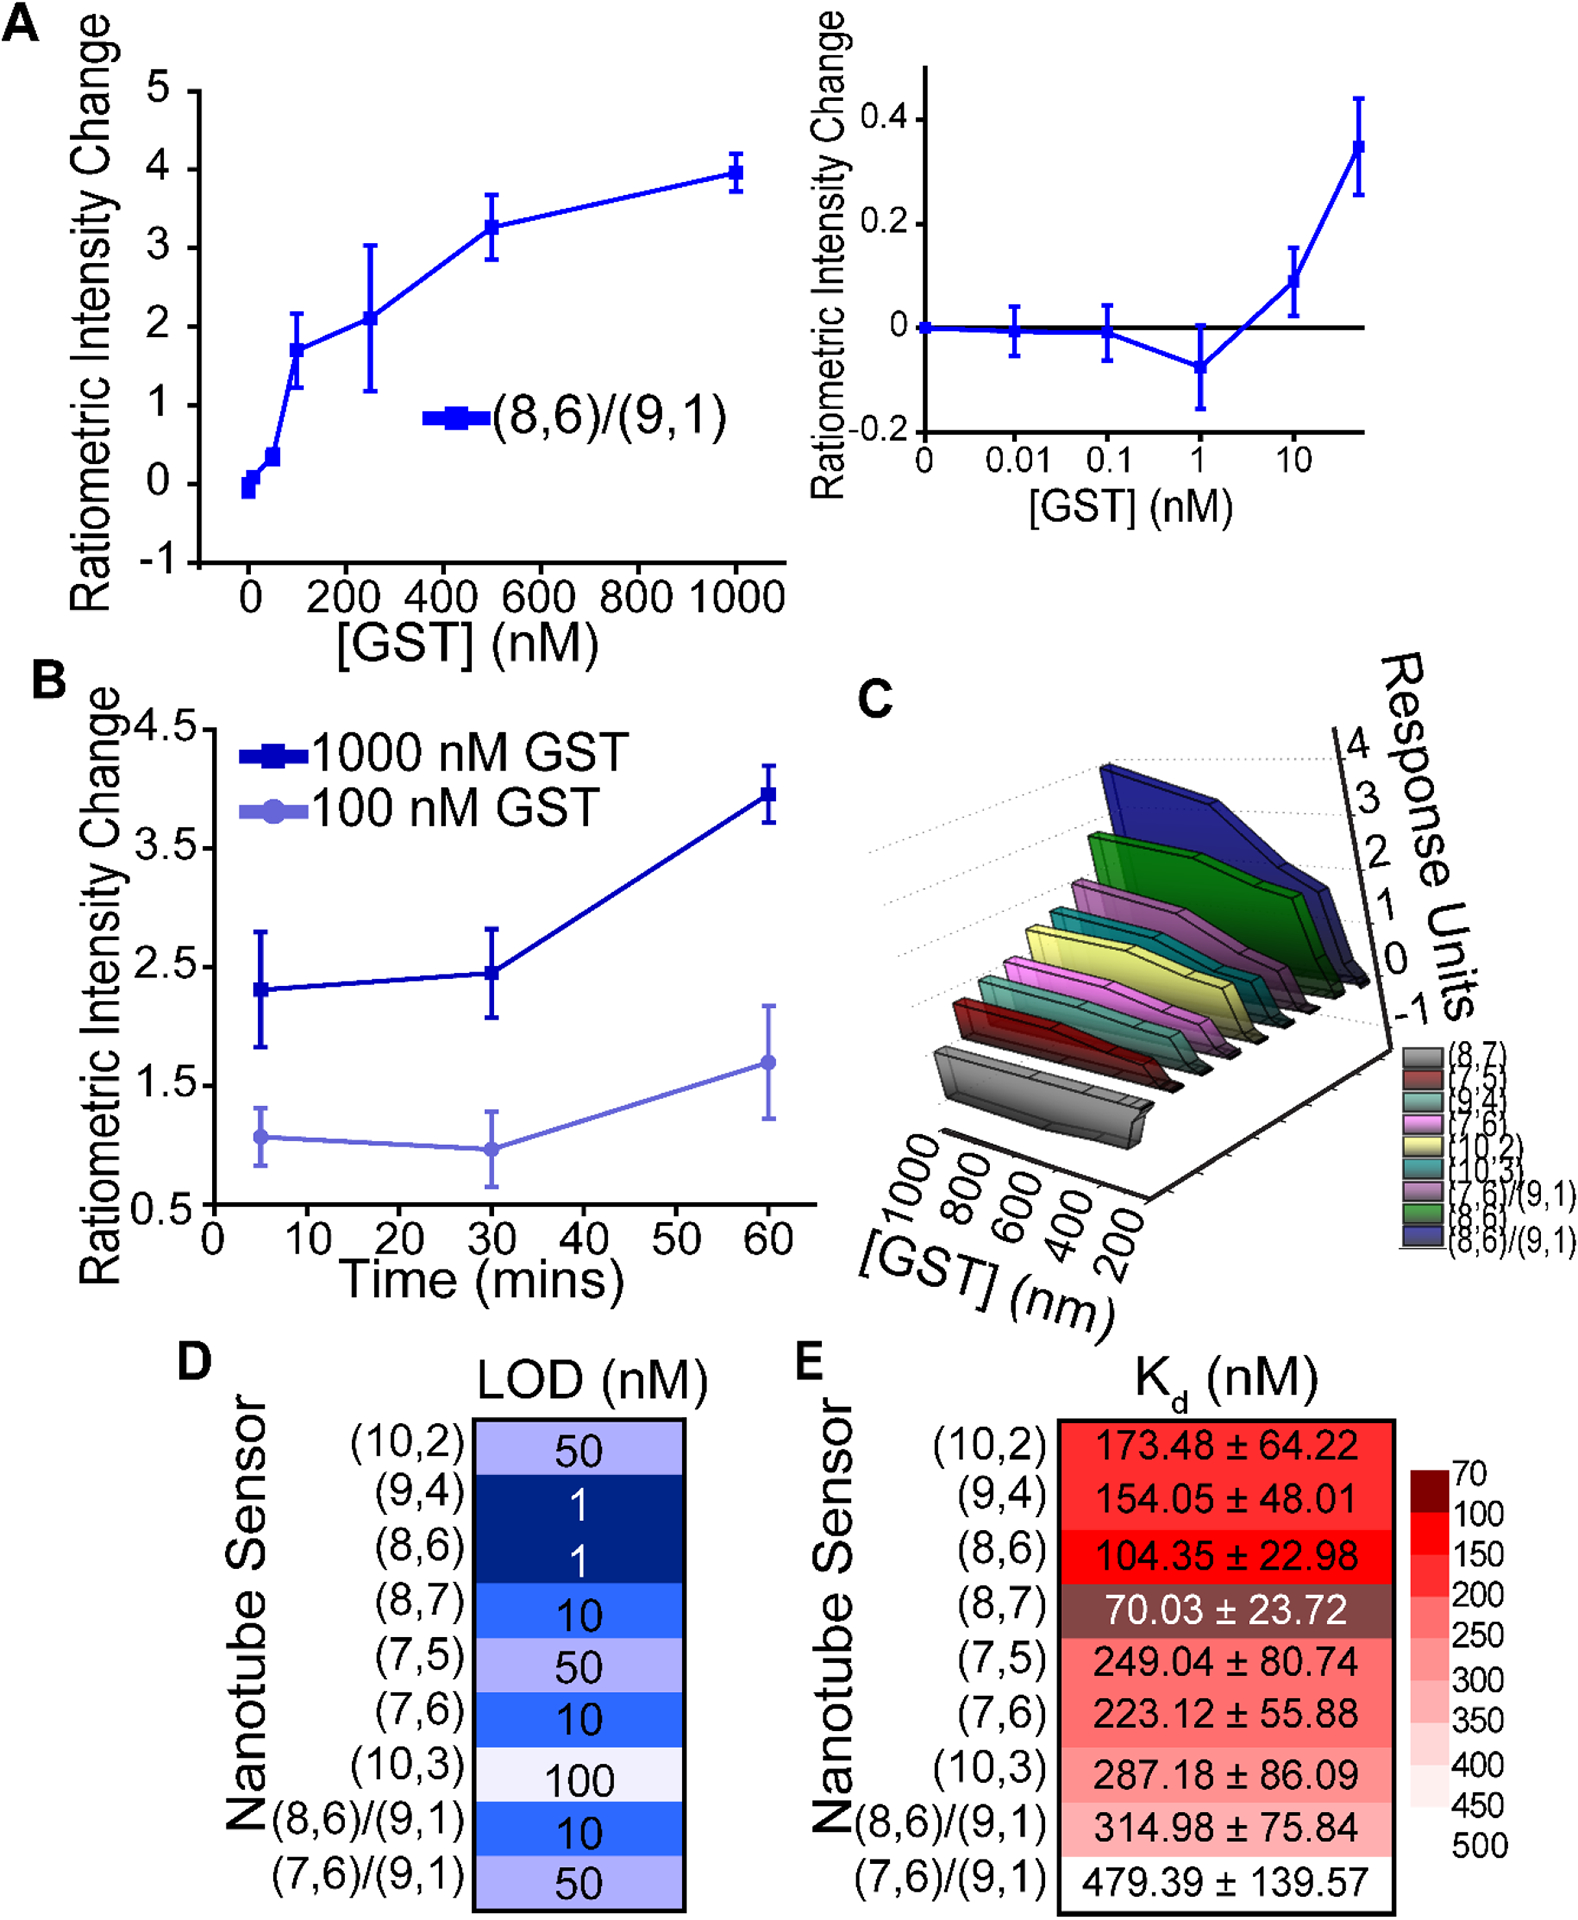
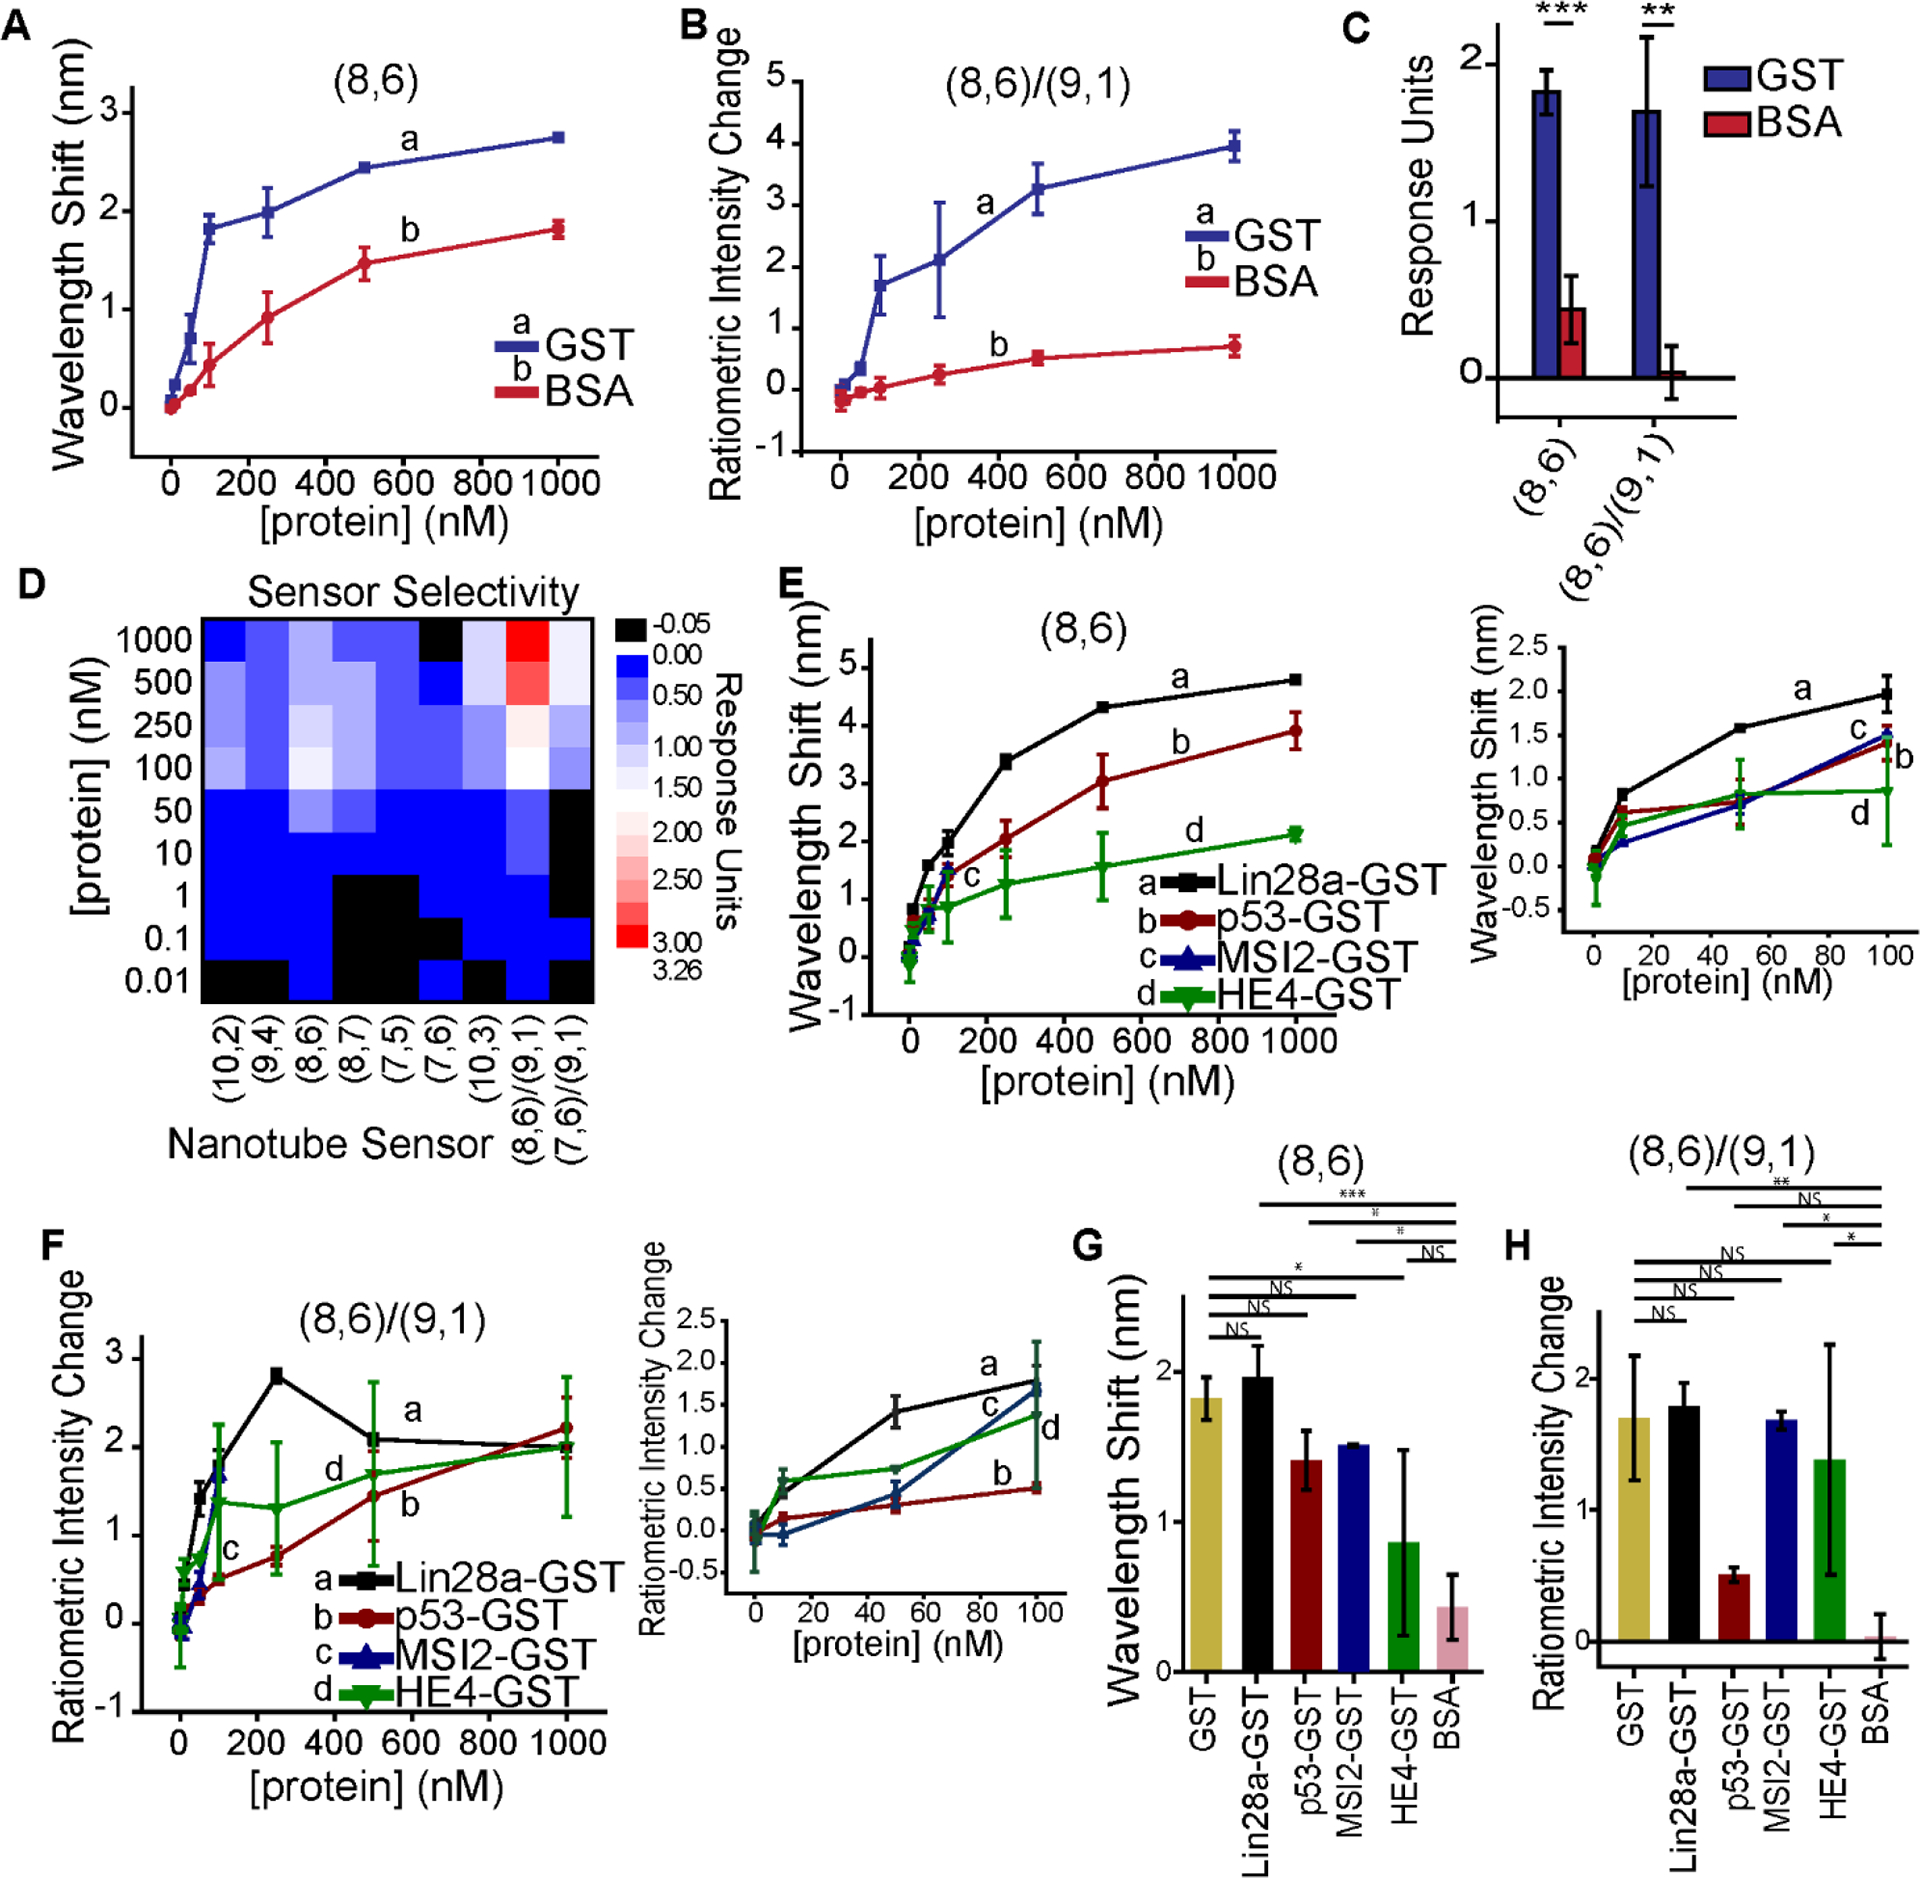
Fusion protein tags are widely used to capture and track proteins in research and industrial bioreactor processes. Quantifying fusion-tagged proteins normally requires several purification steps coupled with classical protein assays. Here, we developed a broadly applicable nanosensor platform that quantifies glutathione-S-transferase (GST) fusion proteins in real-time. We synthesized a glutathione-DNA-carbon nanotube system to investigate glutathione-GST interactions via semiconducting single-walled carbon nanotube (SWCNT) photoluminescence. We found that SWCNT fluorescence wavelength and intensity modulation occurred specifically in response to GST and GST-fusions. The sensor response was dependent on SWCNT structure, wherein mod(n - m, 3) = 1 nanotube wavelength and intensity responses correlated with nanotube diameter distinctly from mod(n - m, 3) = 2 SWCNT responses. We also found broad functionality of this sensor to diverse GST-tagged proteins. This work comprises the first label-free optical sensor for GST and has implications for the assessment of protein expression in situ, including in imaging and industrial bioreactor settings.

Keywords: Fluorescent sensor; affinity tag; nanocarbon; solvatochromism.


Conflict of interest statement

Conflicts of Interest

D.A.H. is a cofounder and officer with equity interest in LipidSense, Inc., Nirova Biosense, Inc., and Goldilocks Therapeutics, Inc. D.A.H. is a member of the scientific advisory board of Concarlo Holdings, LLC and Nanorobotics, Inc. R.M.W. is a scientific advisor with equity interest in Goldilocks Therapeutics, Inc.

Figures

Figure 1.
Figure 1.. Synthesis and characterization of GSH-DNA-SWCNT complexes.
(a) Schematic of the synthesis scheme. (b) Absorption spectrum of the GSH-DNA-SWCNT complexes. (c) Two-dimensional photoluminescence (PL) excitation-emission plot of the GSH-DNA-SWCNT complexes. Scale represents relative fluorescence from minimum (0) to maximum (1).
Figure 2.
Figure 2.. Response of GSH-DNA-SWCNT complexes to GST.
(a) Representative photoluminescence spectrum of the GSH-DNA-SWCNT complexes in the presence of 1000 nM GST, upon excitation at 730 nm. (b) Representative normalized intensity spectra (0 = minimum, 1 = maximum) of the (8,6) nanotube chirality without and with 1000 nM GST upon excitation at 730 nm to illuminate the bathochromic shift. (c) Representative emission spectra of the (8,6) chirality (top) and (9,1) chirality (bottom) for each concentration of added GST. (d) Change in emission center wavelength of the (8,6) chirality as a function of GST concentration. Inset (right): Magnified low-concentration regime of (8,6) response to GST to illuminate the lower range of sensitivity. (e) Temporal response in (8,6) center wavelength in response to maximum (1000 nM) or plateau (100 nM) concentrations of GST. All points d-e represent mean (n = 3 separate samples) ± SD. (f) Photoluminescence intensity change for the (8,6) and (9,1) chiralities as a function of added GST concentration. (g) Wavelength change for each nanotube chirality as a function of chiral diameter. (h) Intensity change for each chirality as a function of chiral diameter. Each point is mean (n = 3 separate samples) ± SD.
Figure 3.
Figure 3.. Sensor response evaluation.
(a) Ratiometric intensity change, defined as a change in (8,6) intensity divided by change in (9,1) intensity, as a function of GST concentration. Inset (right): Magnified low-concentration regime of (8,6)/(9,1) ratiometric intensity response to GST to illuminate the lower range of sensitivity. (b) Temporal response of (8,6)/(9,1) ratiometric intensity change in response to maximum (1000 nM) or plateau (100 nM) concentrations of GST. All points a-b represent mean (n = 3 separate samples) ± SD. (c) Three-dimensional representation of the solvatochromic (7 chiralities) or ratiometric intensity responses (2 sets of chiralities) viewed from smallest to largest maximum response. Response units are defined as wavelength change or intensity ratio. Each point represents the mean of 3 separate samples. (d) Limit of detection (in nM) of each sensor output response, with darker squares corresponding to lower LOD and lighter squares corresponding to higher LOD. LOD is determined for the mean response of 3 separate samples. (e) Dissociation constant (in nM) of each sensor output response, with darker squares corresponding to lower Kd and light squares corresponding to higher Kd. Kd is determined for the mean response of 3 separate samples.
Figure 4.
Figure 4.. Sensor selectivity and response to GST-tagged proteins.
(a) Wavelength response of the (8,6) chirality as a function of GST or BSA concentration. (b) Ratiometric intensity response of the (8,6)/(9,1) chiralities as a function of GST or BSA concentration. (c) Direct comparison of sensor response to GST or BSA at the plateau concentration (100 nM) for the (8,6) wavelength response (left; *** = p = 7.5E−4) or (8,6)/(9,1) intensity response (right; ** = p = 4.7E−3); two-sided t-test. (d) Sensor selectivity for each solvatochromic (7) nanotube response and each ratiometric intensity response (2) at each concentration of protein added. Response units are defined as the mean (n = 3 separate samples) GST change minus mean BSA change in each type of measurement. (e) Ratiometric intensity change of the (8,6)/(9,1) chiralities for four GST-tagged proteins: Lin28a, p53, MSI2 (note: only extends to 100 nM), and HE4. Inset (right): magnification of the same data displayed to 100 nM. (f) Bathochromic response of the (8,6) chirality to the same four proteins. Inset (right): magnification of the same data displayed to 100 nM. (g) Comparative (8,6)/(9,1) ratiometric intensity change at 100 nM protein for the same four proteins as (e) with GST and BSA responses from above. Two-sided one-way ANOVA with Tukey post-hoc analysis; GST:Lin28a-GST NS = p = 0.999; GST:p53GST NS = p = 0.758; GST:MSI2GST NS = p = 1.00; GST:HE4GST NS = p = 0.936; BSA:Lin28a-GST ** = p = 3.29E−3; BSA:p53GST NS = p = 0.758; BSA:MSI2GST * = p = 0.0105; BSA:HE4GST * = p = 0.0346. (h) Comparative (8,6) bathochromic change at 100 nM protein for the same proteins as (e) with GST and BSA responses from above. Two-sided one-way ANOVA with Tukey post-hoc analysis; GST:Lin28a-GST NS = p = 0.991; GST:p53GST NS = p = 0.581; GST:MSI2GST NS = p = 0.790; GST:HE4GST * = p = 0.0293; BSA:Lin28a-GST *** = p = 5.77E−4; BSA:p53GST * = p = 0.0254; BSA:MSI2GST * = p = 0.0147; BSA:HE4GST NS = p = 0.525. All points a-h represent mean (n = 3 separate samples) ± SD; NS = not significant.

References

    1. Terpe K, Overview of tag protein fusions: from molecular and biochemical fundamentals to commercial systems. Applied microbiology and biotechnology 2003, 60 (5), 523–533. - PubMed
    1. Kimple ME; Brill AL; Pasker RL, Overview of affinity tags for protein purification. Current Protocols in Protein Science 2013, 9.9. 1–9.9. 23. - PMC - PubMed
    1. Lichty JJ; Malecki JL; Agnew HD; Michelson-Horowitz DJ; Tan S, Comparison of affinity tags for protein purification. Protein expression and purification 2005, 41 (1), 98–105. - PubMed
    1. Porath J; Carlsson J; Olsson I; Belfrage G, Metal chelate affinity chromatography, a new approach to protein fractionation. Nature 1975, 258, 598–599. - PubMed
    1. Hopp TP; Prickett KS; Price VL; Libby RT; March CJ; Cerretti DP; Urdal DL; Conlon PJ, A short polypeptide marker sequence useful for recombinant protein identification and purification. Biotechnology 1988, 6 (10), 1204–1210.

Publication types