

Excess mortality due to COVID-19 in Germany
- PMID: 32956730
- PMCID: PMC7501062
- DOI: 10.1016/j.jinf.2020.09.012
Excess mortality due to COVID-19 in Germany
Abstract
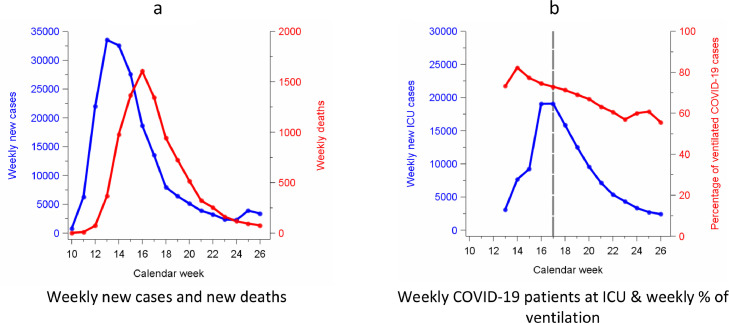
Objectives: The first wave of the SARS-CoV-2 pandemic in Germany lasted from week 10 to 23 in 2020. The aim is to provide estimates of excess mortality in Germany during this time.
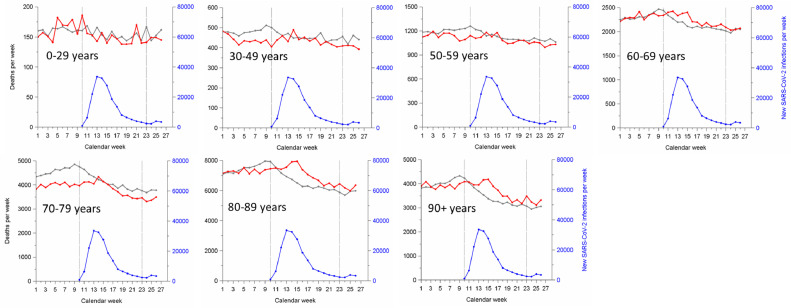
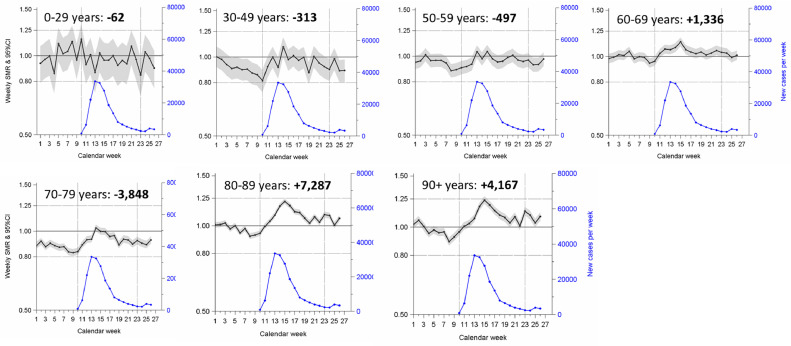
Methods: We analyzed age-specific numbers of deaths per week from 2016 to week 26 in 2020. We used weekly mean numbers of deaths of 2016-2019 to estimate expected weekly numbers for 2020. We estimated standardized mortality ratios (SMR) and 95% confidence intervals.
Results: During the first wave observed numbers of deaths were higher than expected for age groups 60-69, 80-89, and 90+. The age group 70-79 years did not show excess mortality. The net excess number of deaths for weeks 10-23 was +8,071. The overall SMR was 1•03 (95%CI 1•03-1•04). The largest increase occurred among people aged 80-89 and 90+ (SMR=1•08 and SMR=1•09). A sensitivity analysis that accounts for demographic changes revealed an overall SMR of 0•98 (95%CI 0•98-0•99) and a deficit of 4,926 deaths for week 10-23, 2020.
Conclusions: The excess mortality existed for two months. The favorable course of the first wave may be explained by a younger age at infection at the beginning of the pandemic, lower contact rates, and a more efficient pandemic management.
Keywords: COVID-19; Corona virus; Germany; Mortality; Pandemic.
Copyright © 2020 The British Infection Association. Published by Elsevier Ltd. All rights reserved.
Conflict of interest statement
Declaration of Competing Interest None of the authors declares a competing interest.
Figures
Comment in
-
COVID-19: Spatial resolution of excess mortality in Germany and Italy.J Infect. 2021 Mar;82(3):414-451. doi: 10.1016/j.jinf.2020.10.020. Epub 2020 Oct 25. J Infect. 2021. PMID: 33115657 No abstract available.
References
-
- Statistisches Bundesamt. Sterbefälle - Fallzahlen nach Tagen, Wochen, Monaten, Altersgruppen und Bundesländern für Deutschland 2016 – 2020. https://www.destatis.de/DE/Themen/Gesellschaft-Umwelt/Bevoelkerung/Sterb... (accessed 24.07 2020).
MeSH terms
LinkOut - more resources
Full Text Sources
Miscellaneous
