. 2020 Dec:42:101083.
doi: 10.1016/j.molmet.2020.101083. Epub 2020 Sep 18.

Changes in circulating miRNA19a-3p precede insulin resistance programmed by intra-uterine growth retardation in mice

Affiliations

Changes in circulating miRNA19a-3p precede insulin resistance programmed by intra-uterine growth retardation in mice

Sarah Saget et al. Mol Metab. 2020 Dec.

Abstract

Objective: Individuals born with intrauterine growth retardation (IUGR) are more prone to cardio-metabolic diseases as adults, and environmental changes during the perinatal period have been identified as potentially crucial factors. We have studied in a preclinical model early-onset molecular alterations present before the development of a clinical phenotype.

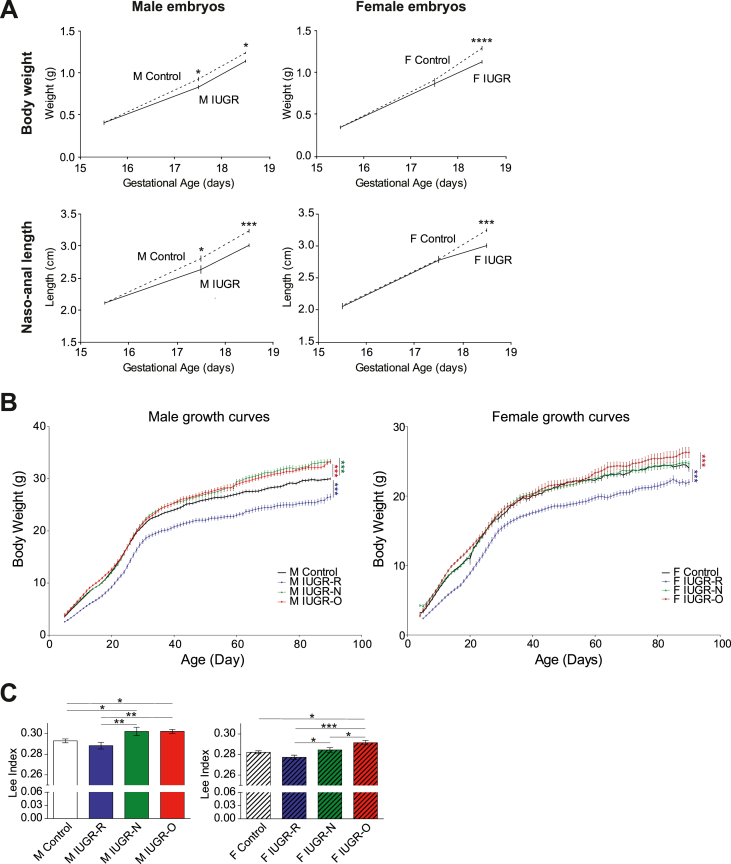
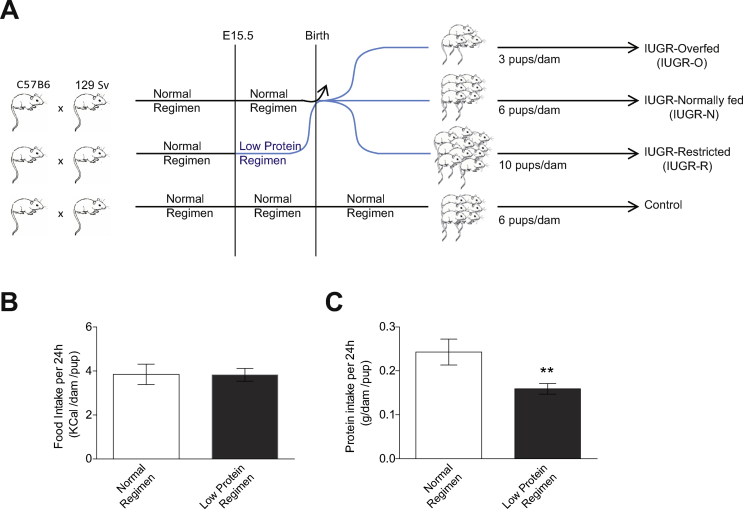
Methods: We used a preclinical mouse model of induced IUGR, in which we modulated the nutrition of the pups during the suckling period, to modify their susceptibility to cardio-metabolic diseases in adulthood.

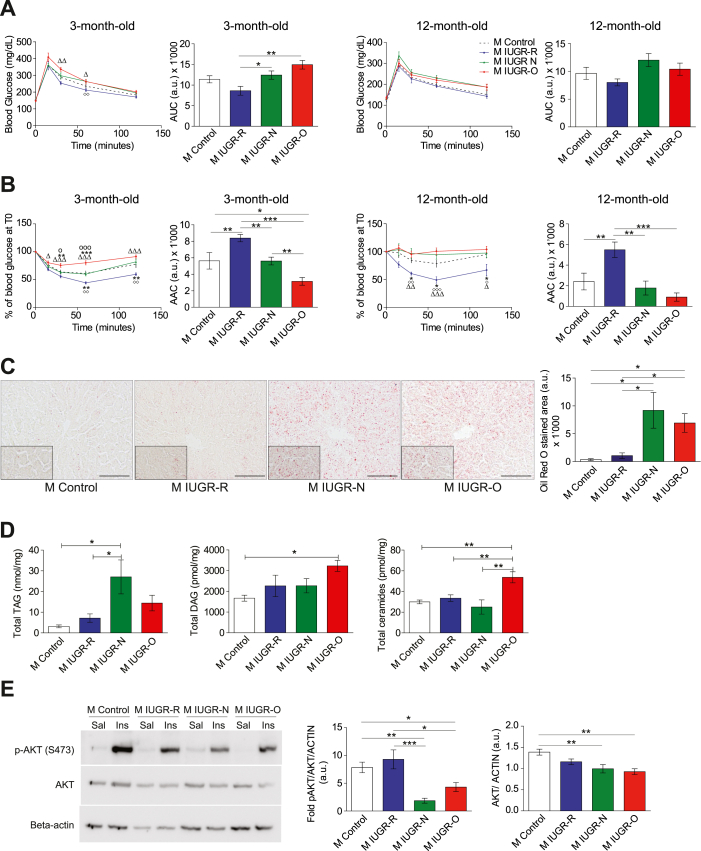
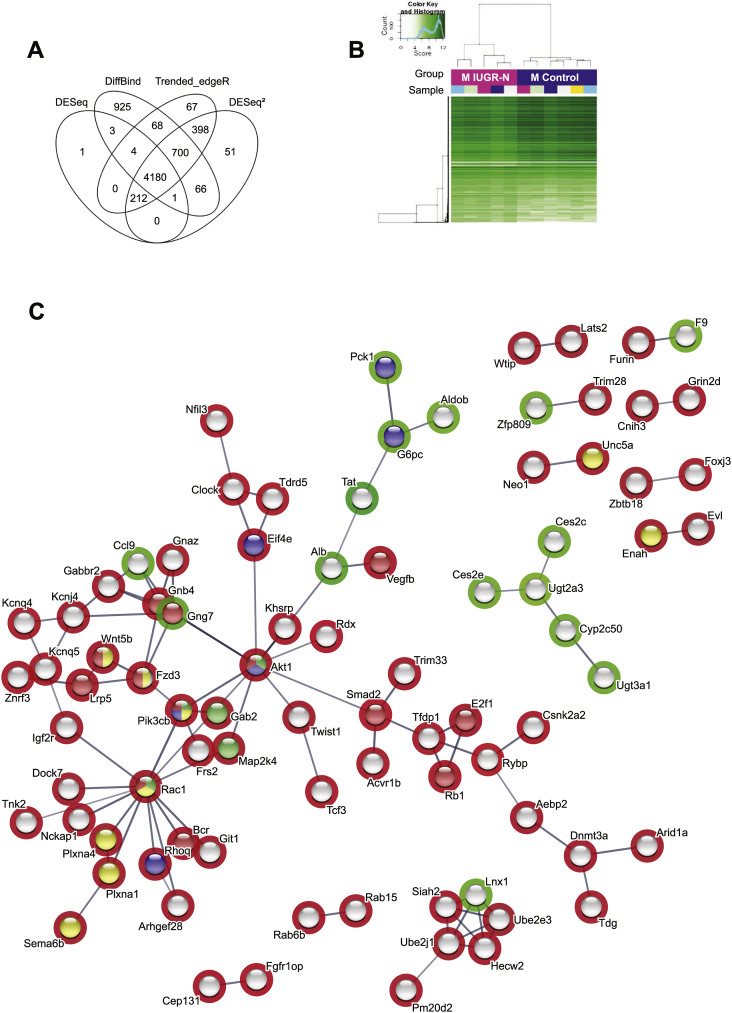
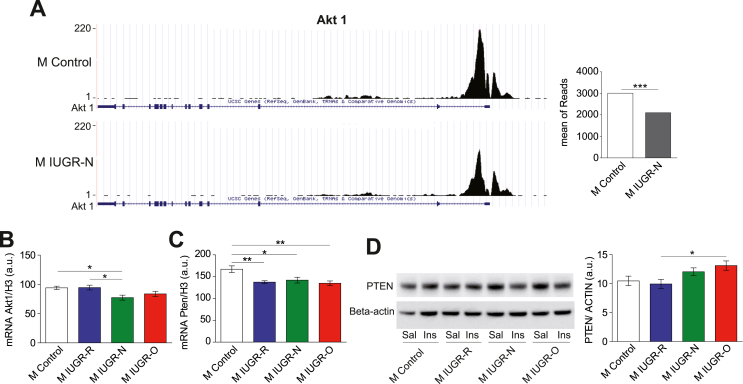
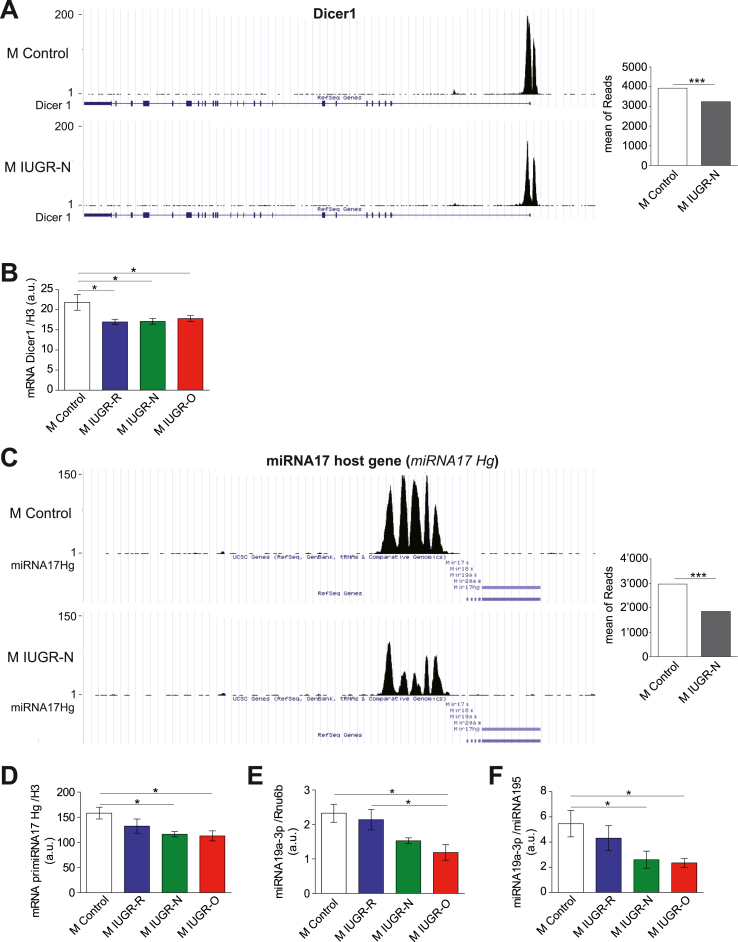
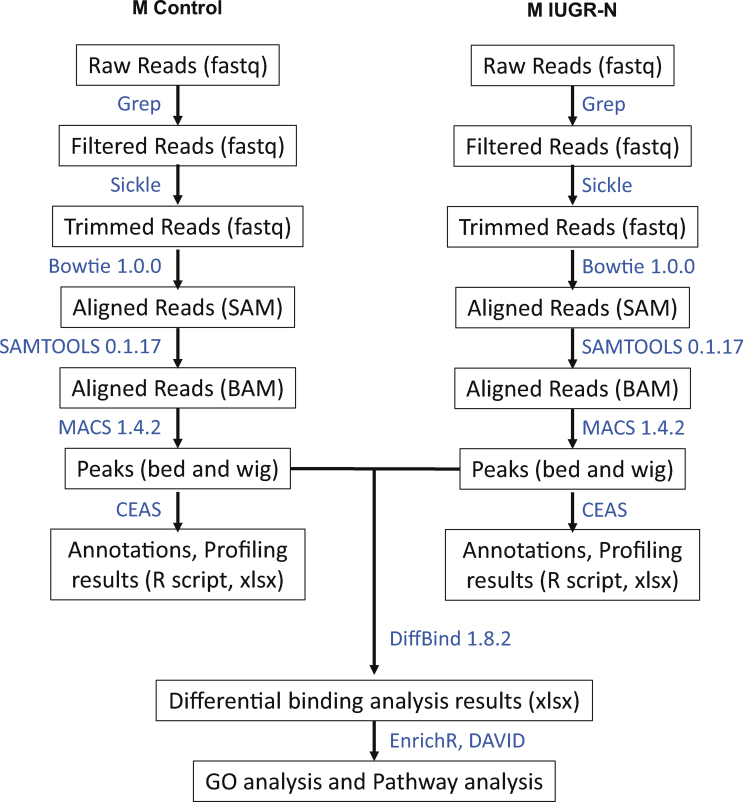
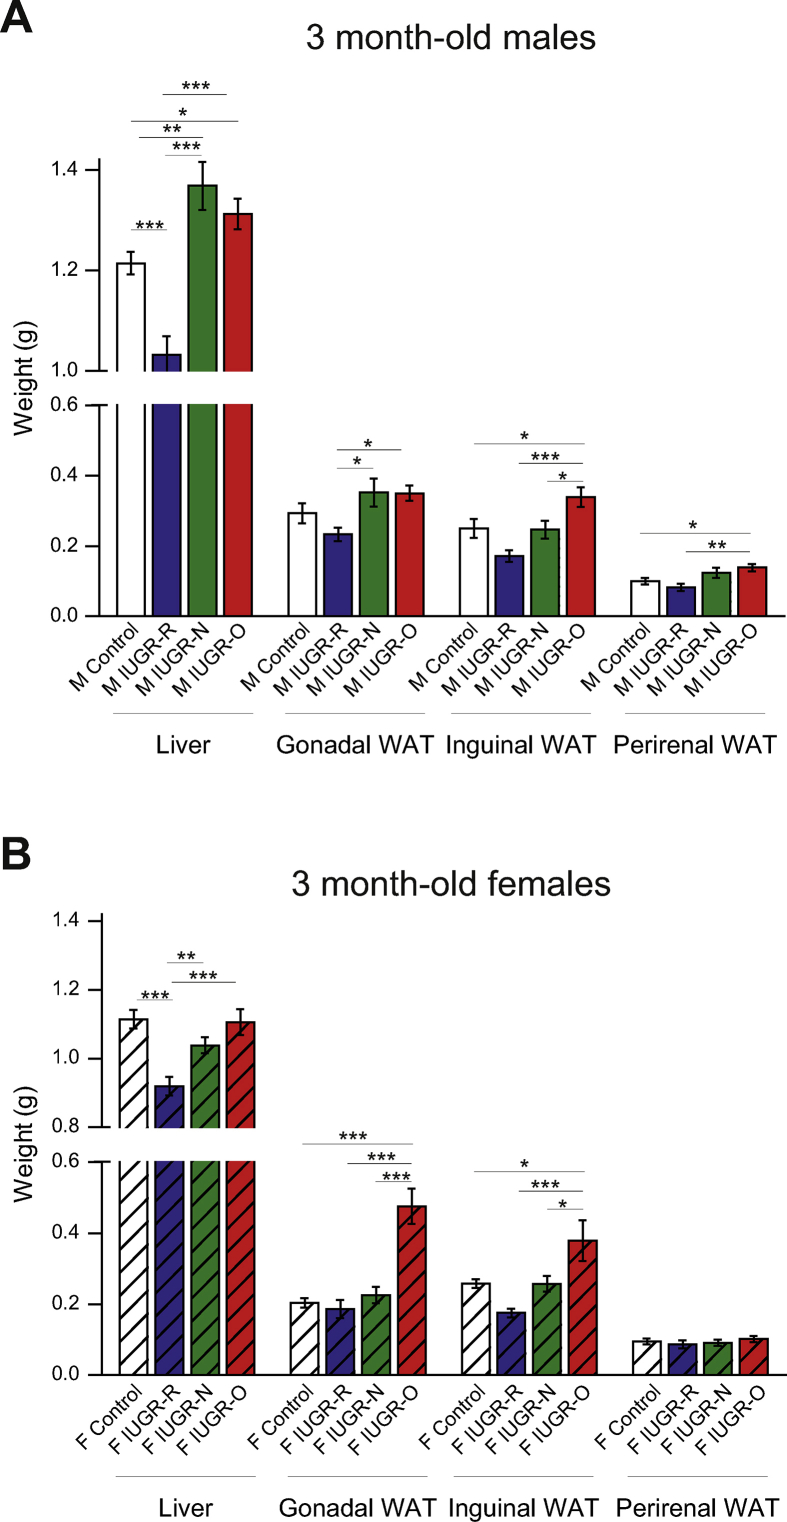
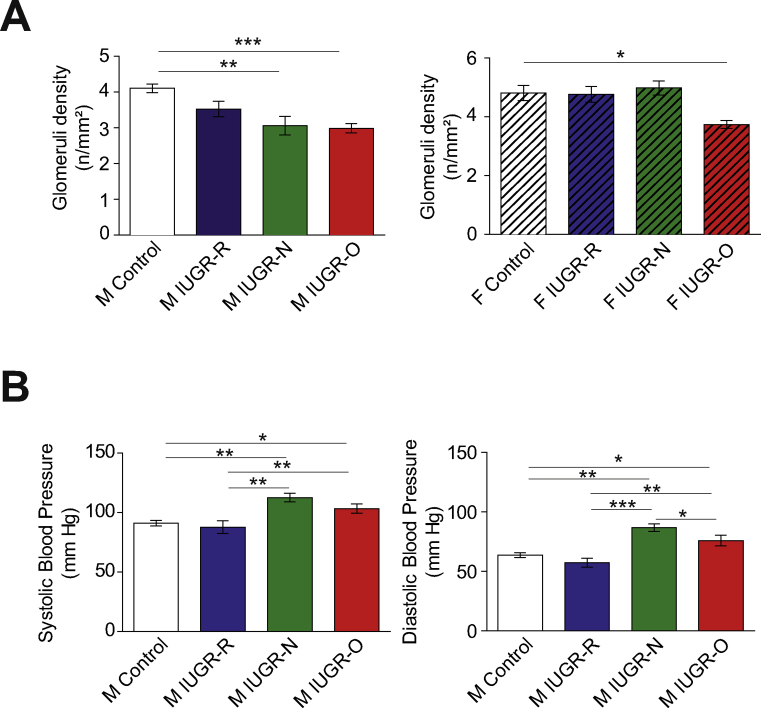
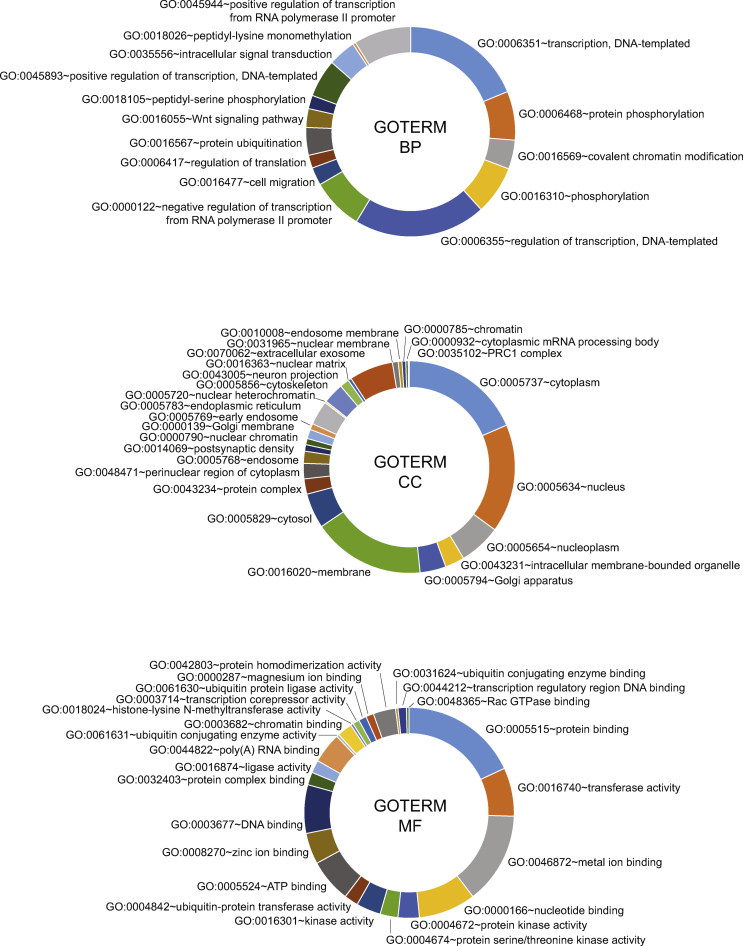
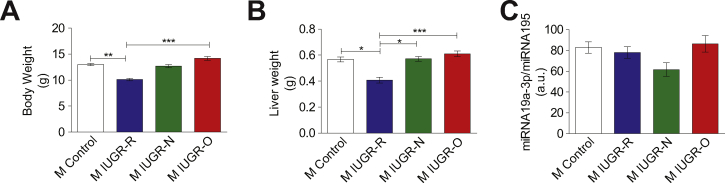
Results: Mice born with IUGR that were overfed (IUGR-O) during lactation rapidly developed obesity, hepatic steatosis and insulin resistance, by three months of age, whereas those subjected to nutrition restriction during lactation (IUGR-R) remained permanently thin and highly sensitive to insulin. Mice born with IUGR and fed normally during lactation (IUGR-N) presented an intermediate phenotype and developed insulin resistance by 12 months of age. Molecular alterations to the insulin signaling pathway with an early onset were observed in the livers of adult IUGR-N mice, nine months before the appearance of insulin resistance. The implication of epigenetic changes was revealed by ChIP sequencing, with both posttranslational H3K4me3 histone modifications and microRNAs involved.

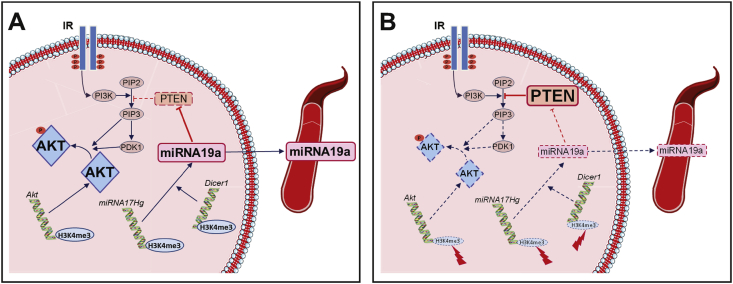
Conclusions: These two changes lead to the coherent regulation of insulin signaling, with a decrease in Akt gene transcription associated with an increase in the translation of its inhibitor, Pten. Moreover, we found that the levels of the implicated miRNA19a-3p also decreased in the blood of young adult IUGR mice nine months before the appearance of insulin resistance, suggesting a possible role for this miRNA as an early circulating biomarker of metabolic fate of potential use for precision medicine.

Keywords: Biomarker; DOHaD; Epigenetics; Histone modifications; IUGR; Nutrition; microRNA19a.


Figures

Figure 1
Figure 1
Changes in nutrition during lactation modulate the long-term consequences of IUGR on growth in male and female mice. (A) Body weight (top panels) and naso-anal length (bottom panels) were measured at E15.5, E17.5, and E18.5 in male (left panels) and female (right panels) embryos in both the control (dashed line) (n = 8–9) and IUGR (solid line) (n = 8) groups. The impact of maternal diet on both of these parameters was more pronounced in the males, with significant differences starting at E17.5 in the males and E18.5 in the females. (B) Post-natal growth curves from days 5–90 in the male (left panel) and female (right panel) mice in the control (dark line), IUGR-R (blue line), IUGR-N (green line), and IUGR-O (red line) groups (n = 8–13 per group). The male (M) and female (F) IUGR-R mice remained lighter throughout the study's course. The IUGR-N and IUGR-O mice of both sexes displayed rapid catch-up growth. From the age of 30 days, the male IUGR-N and IUGR-O mice gained significantly more weight than the controls. The female IUGR-O mice became heavier than the controls only in adulthood. (C) BMI calculated with the Lee index for rodents in the 3-month-old control, IUGR-R, IUGR-N, and IUGR-O mice of both sexes (the males in the left panel and the females in the right panel). Note the increase in the Lee index in the male IUGR-N and IUGR-O mice relative to the control and IUGR-R mice (n = 8–14 per group). In the females, only the IUGR-O mice had a higher BMI than the control mice. ∗p < 0.05, ∗∗p < 0.01, and ∗∗∗p < 0.001 between groups.
Figure 2
Figure 2
Energy homeostasis is affected by changes in nutrition during lactation in male mice with IUGR. (A) Blood glucose concentration during an intraperitoneal glucose tolerance test (ipGTT) in the male (M) young adult (3-month-old mice, left panels, n = 7–12 per group) or old (12-month-old mice, right panels, n = 5–9 per group) control (dashed line), IUGR-R (blue line), IUGR-N (green line), and IUGR-O (red line) mice. The calculation of the area under the curve (AUC) for the young males showed differences between the IUGR-R and IUGR-N/IUGR-O mice. No significant differences in AUC values were observed in the older males. (B) Percent decrease in the glucose levels during an insulin tolerance test (ITT) in the male young adult (3 months old, left panels, n = 9–12 per group) or old (12 months old, right panels, n = 6–10 per group) control, IUGR-R, IUGR-N, and IUGR-O mice. The area above the curve (AAC) indicates better insulin sensitivity in the 3-month-old male IUGR-R mice, an effect that persisted at 12 months of age. Conversely, lower insulin sensitivity was observed in the IUGR-O mice at 3 months, which persisted at 12 months of age. ∗p < 0.05, ∗∗p < 0.01, and ∗∗∗p < 0.001 for the control vs IUGR, with statistical significance reported with the following comparison symbols Δ: IUGR-O vs IUGR-R, o: IUGR-O vs IUGR-N, and ◊: IUGR-N vs IUGR-R. The corresponding results for the females are shown in Supplementary Figure S4. (C) Representative photomicrographs of Oil Red O-stained sections of livers from the male 3-month-old control, IUGR-R, IUGR-N, and IUGR-O mice (scale bar, 200 μm), with a higher magnification shown in the inset. Quantifications (right panel) indicated a stronger accumulation of lipids in the IUGR-N and IUGR-O mice than in the control and IUGR-R mice (n = 4 per group). (D) Hepatic triacylglycerol (TAG) (left panel), diacylglycerol (DAG) (middle panel), and total ceramide (right panel) contents were determined in the 3-month-old male mice by liquid chromatography-tandem mass spectrometry (LC-MS/MS). The TAG levels were higher in the IUGR-N and IUGR-O mice than in the control and IUGR-R mice, whereas DAG and total ceramide contents were higher in the male IUGR-O mice than in the male IUGR-N and control mice. (E) Representative immunoblots of Ser473-phosphorylated AKT (p-AKT), total AKT, and β-actin in the livers of the 3-month-old male mice after saline (Sal) or insulin (Ins) injections (left panel). The increase in the p-AKT/AKT ratio (normalized against β-actin) in the insulin-stimulated mice compared to the saline-injected mice was lower in the IUGR-N and IUGR-O mice than in the control and IUGR-R mice (n = 6–7 blots per group) (middle panel). The total AKT protein content of the liver was lower in the 3-month-old IUGR-N and IUGR-O mice after saline injections than in the control mice (n = 5–8 blots per group) (right panel). ∗p < 0.05, ∗∗p < 0.01, and ∗∗∗p < 0.001 between groups.
Figure 3
Figure 3
Epigenetic modifications in the livers of male young adult IUGR-N mice. (A) The four statistical analysis approaches indicated overlapping significant differential H3K4me3 peaks (adjusted p value < 0.05) between the 3-month-old male IUGR-N and control mice (n = 5–6 per group) as revealed by ChIP sequencing. Statistically significant differential peaks common to Trended_edgeR and DESeq2 (5490 peaks) were conserved for further analysis. (B) The heatmap of differential H3K4me3 peaks showed that the male controls (blue group) and IUGR-N (pink group) mice were segregated. (C) Protein interactions with high confidence illustrated with the STRING database for the subset of genes displaying differential enrichment (>1.5-fold) between the IUGR-N and control groups. Each node corresponds to one protein, and relevant connections are illustrated with connecting lines. The red core indicates proteins related to pathways in cancer, the blue core denotes insulin signaling pathway proteins, the yellow core represents axon guidance proteins, and the green core demonstrates Fc epsilon RI-mediated signaling pathway proteins according to the KEGG pathway analysis with the STRING database. The green circles indicate greater enrichment in the H3K4me3 mark in the IUGR-N group and the red circles indicate higher enrichment in the control group.
Figure 4
Figure 4
Altered insulin signaling pathway in the livers of male young adult IUGR mice. (A) Representative ChIPSeq data for the H3K4me3 peak at the Akt1 gene in the control and IUGR-N mice. The mean number of reads was lower in the male IUGR-N mice than in the controls (n = 5–6 per group) and (B) this result was confirmed by the RNA analysis (n = 6–8 per group). (C) The levels of Pten mRNA were lower in all of the IUGR groups irrespective of the nutritional conditions during the lactation period (n = 5–8 per group). (D) Representative immunoblots for PTEN and β-actin in the livers of the mice after the injection of saline (Sal) or insulin (Ins) (left panel). The hepatic PTEN content was higher in the IUGR-O mice than in the IUGR-R mice (n = 7–8 per group) after saline injection. ∗p < 0.05, ∗∗p < 0.01, and ∗∗∗p < 0.001 between groups.
Figure 5
Figure 5
Plasma levels and liver contents of miRNA19a-3p are lower in male young adult IUGR mice. (A) Representative ChIPSeq data for the H3K4me3 peak at the Dicer1 gene in the control and IUGR-N mice. The mean number of reads was lower in the male IUGR-N mice than in the control mice (n = 5–6 per group). (B) The Dicer1 mRNA levels were lower in all of the 3-month-old male mice with IUGR irrespective of their nutritional conditions during the lactation period than in the control animals (n = 7 per group). (C) Representative ChIPSeq data for the H3K4me3 peak in the miRNA 17 host gene (miRNA17Hg) in the control and IUGR-N mice. The mean number of reads was lower in the male IUGR-N mice than in the control mice (n = 5–6 per group). (D) The levels of primiRNA17Hg non-coding RNA (also called primiRNA17-92) were significantly lower in the livers of the young adult (3 months old) IUGR-N and IUGR-O mice than in the control mice (n = 5–8 per group). (E) The levels of mature miRNA19a-3p were lower in the livers of the male IUGR-O mice than in the control and IUGR-R mice (n = 5–8 per group). (F) The circulating miRNA19a-3p levels were lower in the plasma of the 3-month-old male IUGR-N and IUGR-O mice than in the control animals (n = 7–8 per group). ∗p < 0.05 and ∗∗p < 0.001 between groups.
Figure 6
Figure 6
Graphical summary. Relative to the control conditions (A), perinatal changes in nutrition in mice induce multiple and coherent epigenetic alterations in hepatocytes (B), notably affecting key genes involved in insulin signaling: lower amounts of AKT are synthesized, potentially leading to a predisposition to developing insulin resistance with age. This effect is aggravated by complementary epigenetic alterations to the primiRNA17Hg and Dicer1 genes, leading to a decrease in miRNA19a-3p levels. The decrease in miRNA19a-3p leads to an increase in the translation of PTEN, a well-known inhibitor of AKT activation, and may also contribute to a predisposition to developing insulin resistance with age. The change in miRNA19a-3p levels in the asymptomatic adult mice with IUGR was also detectable in the blood, making it possible to envisage using this miRNA as an early biomarker of a higher risk of developing insulin resistance.
figs1
figs1
figs2
figs2
figs3
figs3
figs4
figs4
figs5
figs5
figs6
figs6
figs7
figs7

References

    1. WHO Obesity and overweight. 2018. http://www.who.int/news-room/fact-sheets/detail/obesity-and-overweight 16 February 2018.
    1. WHO . 2016. Consideration of the evidence on childhood obesity for the Commission on Ending Childhood Obesity: report of the ad hoc working group on science and evidence for ending childhood obesity.
    1. Hales C.N., Barker D.J. Type 2 (non-insulin-dependent) diabetes mellitus: the thrifty phenotype hypothesis. Diabetologia. 1992;35(7):595–601. - PubMed
    1. McMillen I.C., Robinson J.S. Developmental origins of the metabolic syndrome: prediction, plasticity, and programming. Physiological Reviews. 2005;85(2):571–633. - PubMed
    1. Roseboom T., de Rooij S., Painter R. The Dutch famine and its long-term consequences for adult health. Early Human Development. 2006;82(8):485–491. - PubMed

Publication types

MeSH terms