. 2020 Sep 21;12(18):18297-18321.
doi: 10.18632/aging.103695. Epub 2020 Sep 21.

Glioblastoma cell differentiation trajectory predicts the immunotherapy response and overall survival of patients

Affiliations

Glioblastoma cell differentiation trajectory predicts the immunotherapy response and overall survival of patients

Zihao Wang et al. Aging (Albany NY). .

Abstract

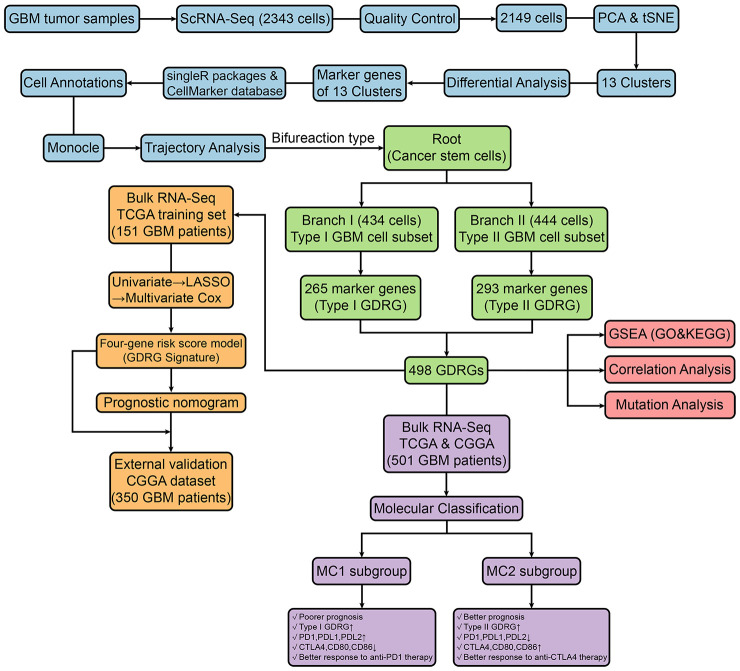
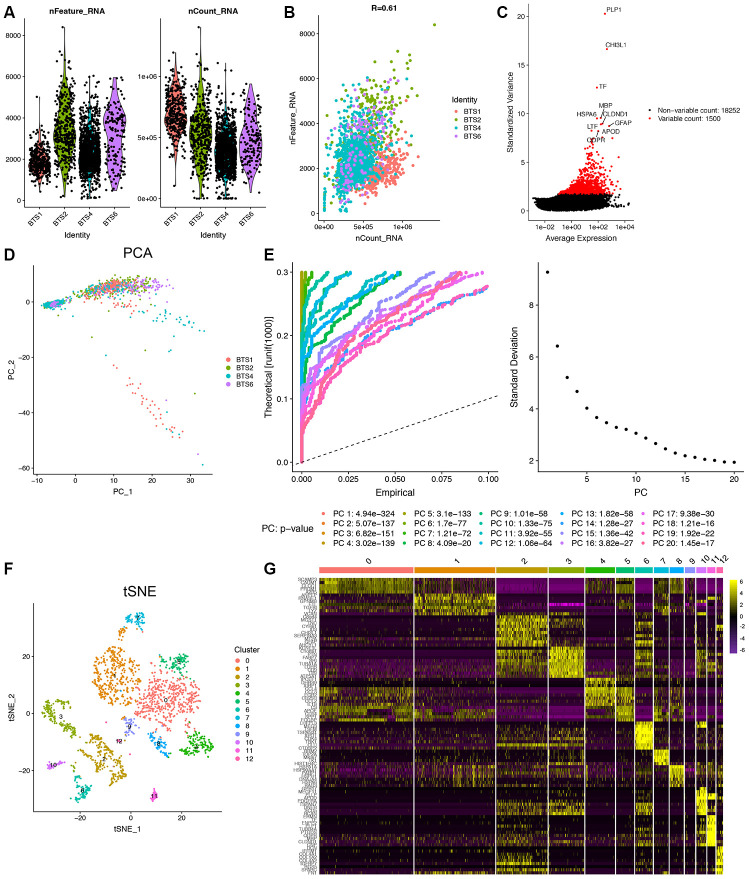
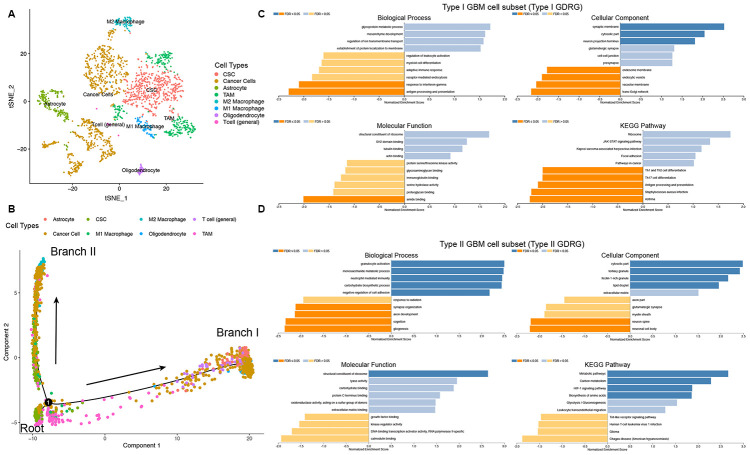
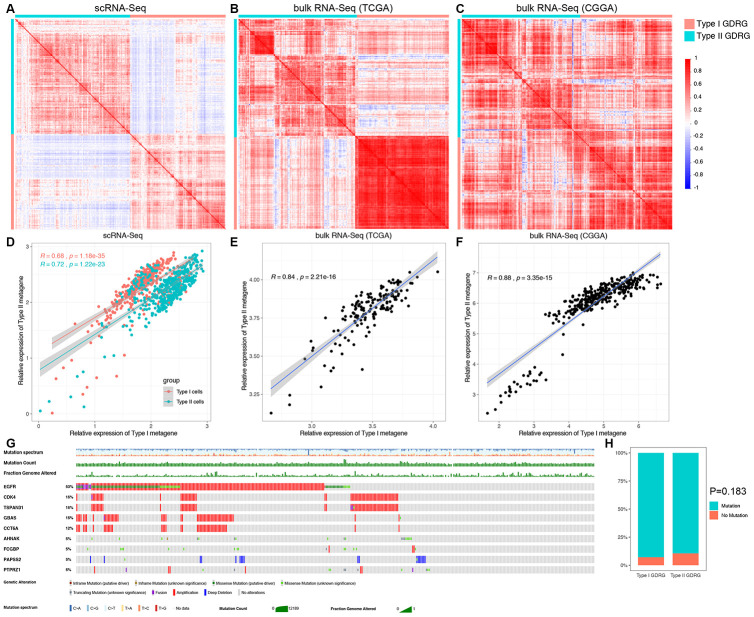
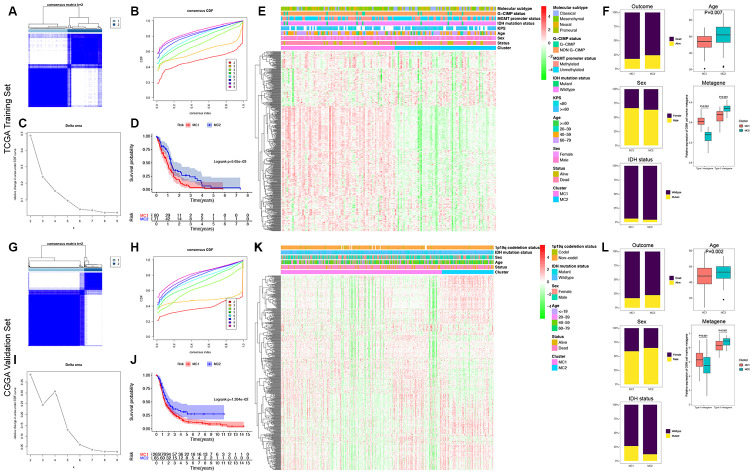
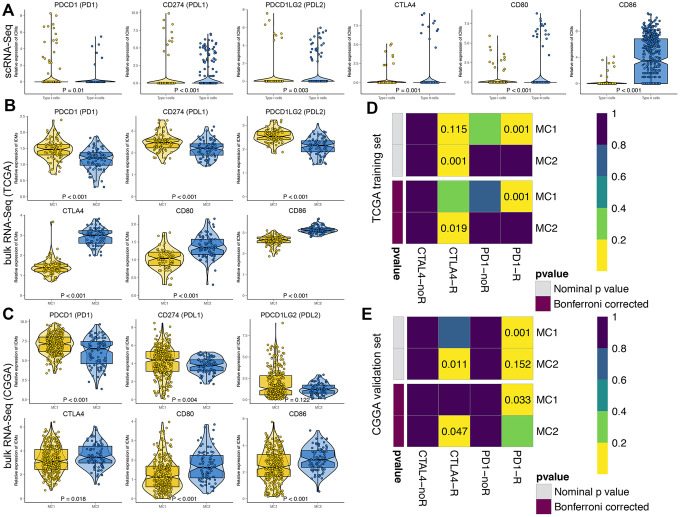
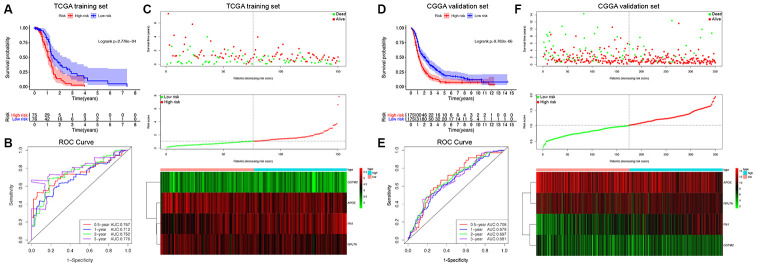
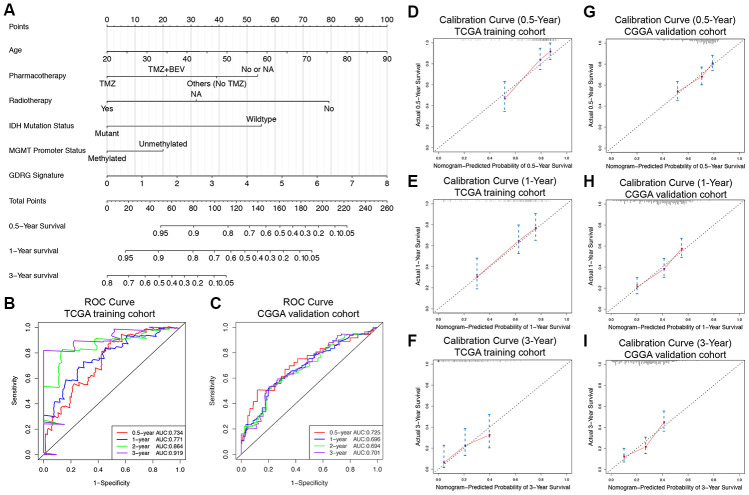
Glioblastoma (GBM) is the most common and lethal primary brain tumor. In this study, we aimed to investigate the differentiation states of GBM cells and their clinical relevance. Integrated single-cell RNA-sequencing (scRNA-seq) data and bulk RNA-seq data from GBM samples were used for analysis. Two subsets of GBM cells in distinct differentiation states were characterized, and 498 GBM cell differentiation-related genes (GDRGs) were identified. GDRGs were significantly correlated with immune regulation and metabolic pathways. We classified the GBM patients into two groups based on the expression of GDRGs in tumors and found that the cell differentiation-based classification successfully predicted patient overall survival (OS), immune checkpoint expression and likelihood of immunotherapy response in GBMs. FN1, APOE, RPL7A and GSTM2 were the 4 most significant survival-predicting GDRGs, and patients with different expression levels of each of these genes had distinct survival outcomes. Finally, a nomogram composed of the GDRG signature, age, pharmacotherapy, radiotherapy, IDH mutations and MGMT promoter methylation was generated and validated in two large GBM cohorts to predict GBM prognosis. This study highlights the significant roles of cell differentiation in predicting the clinical outcomes of GBM patients and their potential response to immunotherapy, suggesting promising therapeutic targets for GBM.

Keywords: cancer cell differentiation; glioblastoma; immunotherapy response; overall survival; trajectory analysis.


Conflict of interest statement

CONFLICTS OF INTEREST: The authors have no conflicts of interest to declare.

Figures

Figure 1
Figure 1
Schematic diagram showing the study design and principal findings.
Figure 2
Figure 2
Identification of 13 cell clusters with diverse annotations revealing high cellular heterogeneity in GBM tumors based on single-cell RNA-seq data. (A) After quality control of the 2,343 cells from the tumor cores of 4 human GBM samples, 2,149 cells were included in the analysis. (B) The numbers of detected genes were significantly related to the sequencing depth, with a Pearson’s correlation coefficient of 0.61. (C) The variance diagram shows 19,752 corresponding genes throughout all cells from GBMs. The red dots represent highly variable genes, and the black dots represent nonvariable genes. The top 10 most variable genes are marked in the plot. (D) PCA did not demonstrate clear separations of cells in GBMs. (E) PCA identified the 20 PCs with an estimated P value < 0.05. (F) The tSNE algorithm was applied for dimensionality reduction with the 20 PCs, and 13 cell clusters were successfully classified. (G) The differential analysis identified 8,025 marker genes. The top 20 marker genes of each cell cluster are displayed in the heatmap. A total of 96 genes are listed beside of the heatmap after omitting the same top marker genes among clusters. The colors from purple to yellow indicate the gene expression levels from low to high.
Figure 3
Figure 3
Cell annotation, trajectory analysis and GSEA of two GBM cell subsets with distinct differentiation patterns. (A) All 13 clusters of cells in GBMs were annotated by singleR and CellMarker according to the composition of the marker genes. (B) Trajectory analysis revealed two subsets of GBM cells with distinct differentiation patterns. GBM CSCs were mainly located in the root, whereas GBM cells were located in either branch. Branch I GBM cells were defined by the type I GBM cell subset (434 GBM cells). Branch II GBM cells were defined by the type II GBM cell subset (444 GBM cells). (C and D) GSEA of type I and II GBM cell subsets was performed to identify related molecular mechanisms and pathways. An FDR ≤ 0.05 was considered statistically significant.
Figure 4
Figure 4
Correlation analysis and somatic mutation analysis of the two subtypes of GDRGs. The correlation heatmaps, which were generated to determine whether the observed GBM cell subsets could be identified using bulk RNA-seq data, demonstrated that the type I GDRGs were highly correlated in both scRNA-seq data (A) and bulk RNA-seq data, including the TCGA (B) and CGGA cohorts (C). The same result was observed for the type II GDRGs (AC). The correlation analysis demonstrated that the expression of type I and type II metagenes was significantly correlated in both scRNA-seq data (D) and bulk RNA-seq data, including the TCGA (E) and CGGA cohorts (F). (G) OncoPlot analysis of the somatic mutation status of the GDRGs in the TCGA cohort revealed the top 9 mutated genes with mutation frequencies ≥ 5%. (H) Mutation frequencies of type I and type II GDRGs. A total of 246 genes (92.8%) were mutated in type I GDRGs, and 262 genes (89.4%) were mutated in type II GDRGs (P=0.183).
Figure 5
Figure 5
Identification and validation of the GDRG-based classification of GBM patients. Consensus clustering matrix for k = 2, which was the optimal cluster number in the TCGA training cohort (A) and CGGA validation cohort (G). (B and H) CDF curves of the consensus score (k = 2-9) in the TCGA and CGGA cohorts. (C and I) Relative change in the area under the CDF curve (k = 2-9) in the TCGA and CGGA cohorts. Kaplan-Meier survival analyses of the patients with MC1 and MC2 GBMs in the TCGA (D) and CGGA (J) cohorts, indicating that the patients with MC1 GBMs had poorer OS than those with MC2 GBMs. Heatmap and clinicopathological features of the two MCs in the TCGA (E) and CGGA (K) cohorts showing that the expression levels of the type I GDRG metagene were significantly higher and the levels of the type II GDRG metagene were significantly lower in patients with MC1 GBMs than in patients with MC2 GBMs. (F and L) Comparisons of the clinicopathological variables and type I and II metagenes between the two MCs of GBM patients in the TCGA and CGGA cohorts.
Figure 6
Figure 6
Predictions of the immunotherapy response in GBM patients. The violin plots present the expression of 6 principal immune checkpoint molecules, namely, PDCD1 (PD1), CD274 (PDL1), PDCD1LG2 (PDL2), CTLA4, CD80, and CD86, in scRNA-seq data (A) and bulk RNA-seq data, including the TCGA (B) and CGGA cohorts (C). Subclass mapping analysis was used to predict the likelihood of the clinical response to anti-PD1 and anti-CTLA4 therapy for MC1 and MC2 GBM patients from the TCGA (D) and CGGA (E) cohorts. R represents immunotherapy responders, while noR represents immunotherapy nonresponders. A Bonferroni-corrected P value < 0.05 was considered statistically significant.
Figure 7
Figure 7
Survival analysis, prognostic performance and risk score analysis of the GDRG-based risk score model in GBM patients. Kaplan-Meier survival analysis was performed to estimate the OS of high-risk and low-risk patients in the TCGA training cohort (A) and CGGA validation cohort (D). The high-risk groups had significantly poorer OS than the low-risk groups. Time-dependent ROC curve analysis was performed to evaluate the prognostic performance of the GDRG signature for predicting the 0.5-, 1-, 2-, and 3-year OS rates in the TCGA (B) and CGGA cohorts (E). Risk score analysis of the GDRG signatures in the TCGA (C) and CGGA (F) cohorts were calculated, and the patients were divided into either a high-risk group or a low-risk group using the median value of the risk score as the cutoff value. Upper panel: Patient survival status and time distributed by the risk score. Middle panel: Risk score curves of the GDRG signatures. Bottom panel: Heatmaps of the expression levels of the 4 GDRGs in the GBM samples. The colors from green to red indicate the gene expression levels from low to high.
Figure 8
Figure 8
Prognostic nomogram to predict the 0.5-, 1-, and 3-year OS of GBM patients. (A) Nomogram model to predict the prognosis of GBM patients based on the TCGA training cohort. Age, pharmacotherapy, radiotherapy, IDH mutation status, MGMT promoter methylation status, and the GDRG signature were included in the prediction model. The prognostic performance of the nomogram demonstrated by the time-dependent ROC curve for predicting the 0.5-, 1-, and 3-year OS rates in the TCGA training cohort (B) and CGGA validation cohort (C). Calibration plots of the prognostic nomogram for predicting OS at 0.5, 1, and 3 years in the TCGA (DF) and CGGA (GI) cohorts. Actual survival is plotted on the y-axis, and nomogram-predicted probability is plotted on the x-axis.

References

    1. Ostrom QT, Cioffi G, Gittleman H, Patil N, Waite K, Kruchko C, Barnholtz-Sloan JS. CBTRUS statistical report: primary brain and other central nervous system tumors diagnosed in the United States in 2012-2016. Neuro Oncol. 2019. (Suppl 5); 21:v1–100. 10.1093/neuonc/noz150 - DOI - PMC - PubMed
    1. Omuro A, DeAngelis LM. Glioblastoma and other Malignant gliomas: a clinical review. JAMA. 2013; 310:1842–50. 10.1001/jama.2013.280319 - DOI - PubMed
    1. Alexander BM, Cloughesy TF. Adult glioblastoma. J Clin Oncol. 2017; 35:2402–09. 10.1200/JCO.2017.73.0119 - DOI - PubMed
    1. Delgado-López PD, Corrales-García EM. Survival in glioblastoma: a review on the impact of treatment modalities. Clin Transl Oncol. 2016; 18:1062–71. 10.1007/s12094-016-1497-x - DOI - PubMed
    1. Medikonda R, Dunn G, Rahman M, Fecci P, Lim M. A review of glioblastoma immunotherapy. J Neurooncol. 2020. [Epub ahead of print]. 10.1007/s11060-020-03448-1 - DOI - PubMed