

Venous Waveform Analysis Correlates With Echocardiography in Detecting Hypovolemia in a Rat Hemorrhage Model
- PMID: 32957831
- PMCID: PMC8480433
- DOI: 10.1177/1089253220960894
Venous Waveform Analysis Correlates With Echocardiography in Detecting Hypovolemia in a Rat Hemorrhage Model
Abstract
Background: Assessing intravascular hypovolemia due to hemorrhage remains a clinical challenge. Central venous pressure (CVP) remains a commonly used monitor in surgical and intensive care settings for evaluating blood loss, despite well-described pitfalls of static pressure measurements. The authors investigated an alternative to CVP, intravenous waveform analysis (IVA) as a method for detecting blood loss and examined its correlation with echocardiography.
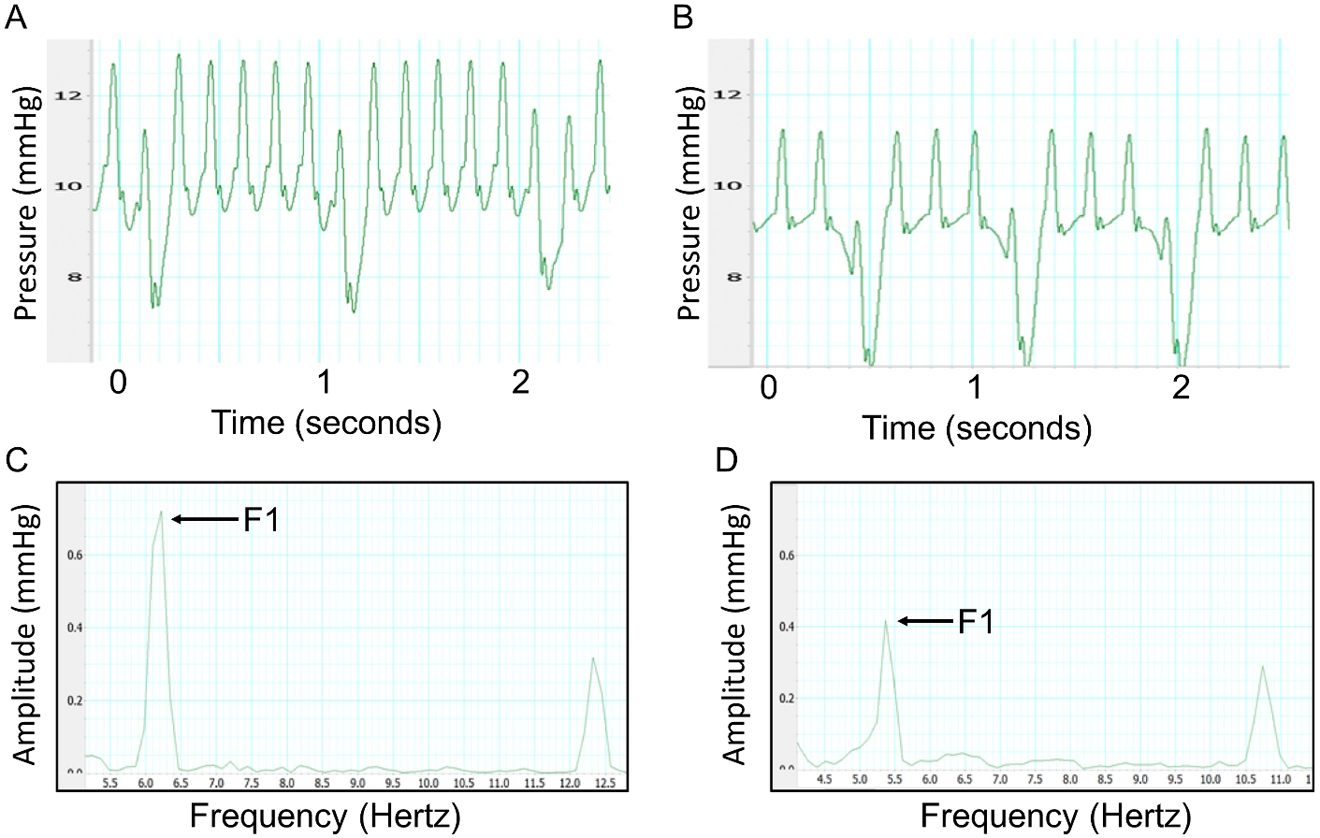
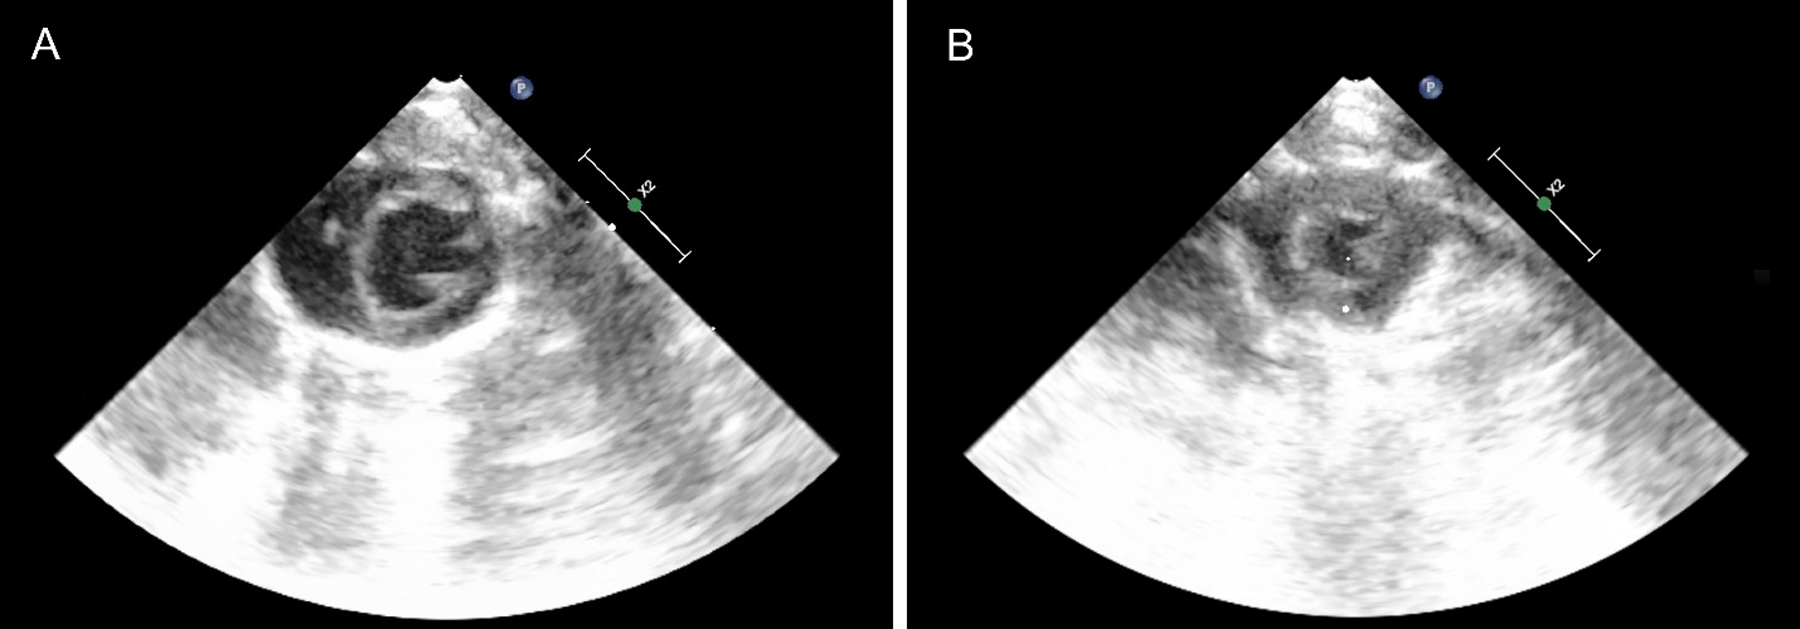
Methods: Seven anesthetized, spontaneously breathing male Sprague Dawley rats with right internal jugular central venous and femoral arterial catheters underwent hemorrhage. Mean arterial pressure (MAP), heart rate, CVP, and IVA were assessed and recorded. Hemorrhage was performed until each rat had 25% estimated blood volume removed. IVA was obtained using fast Fourier transform and the amplitude of the fundamental frequency (f1) was measured. Transthoracic echocardiography was performed utilizing a parasternal short axis image of the left ventricle during hemorrhage. MAP, CVP, and IVA were compared with blood removed and correlated with left ventricular end diastolic area (LVEDA).
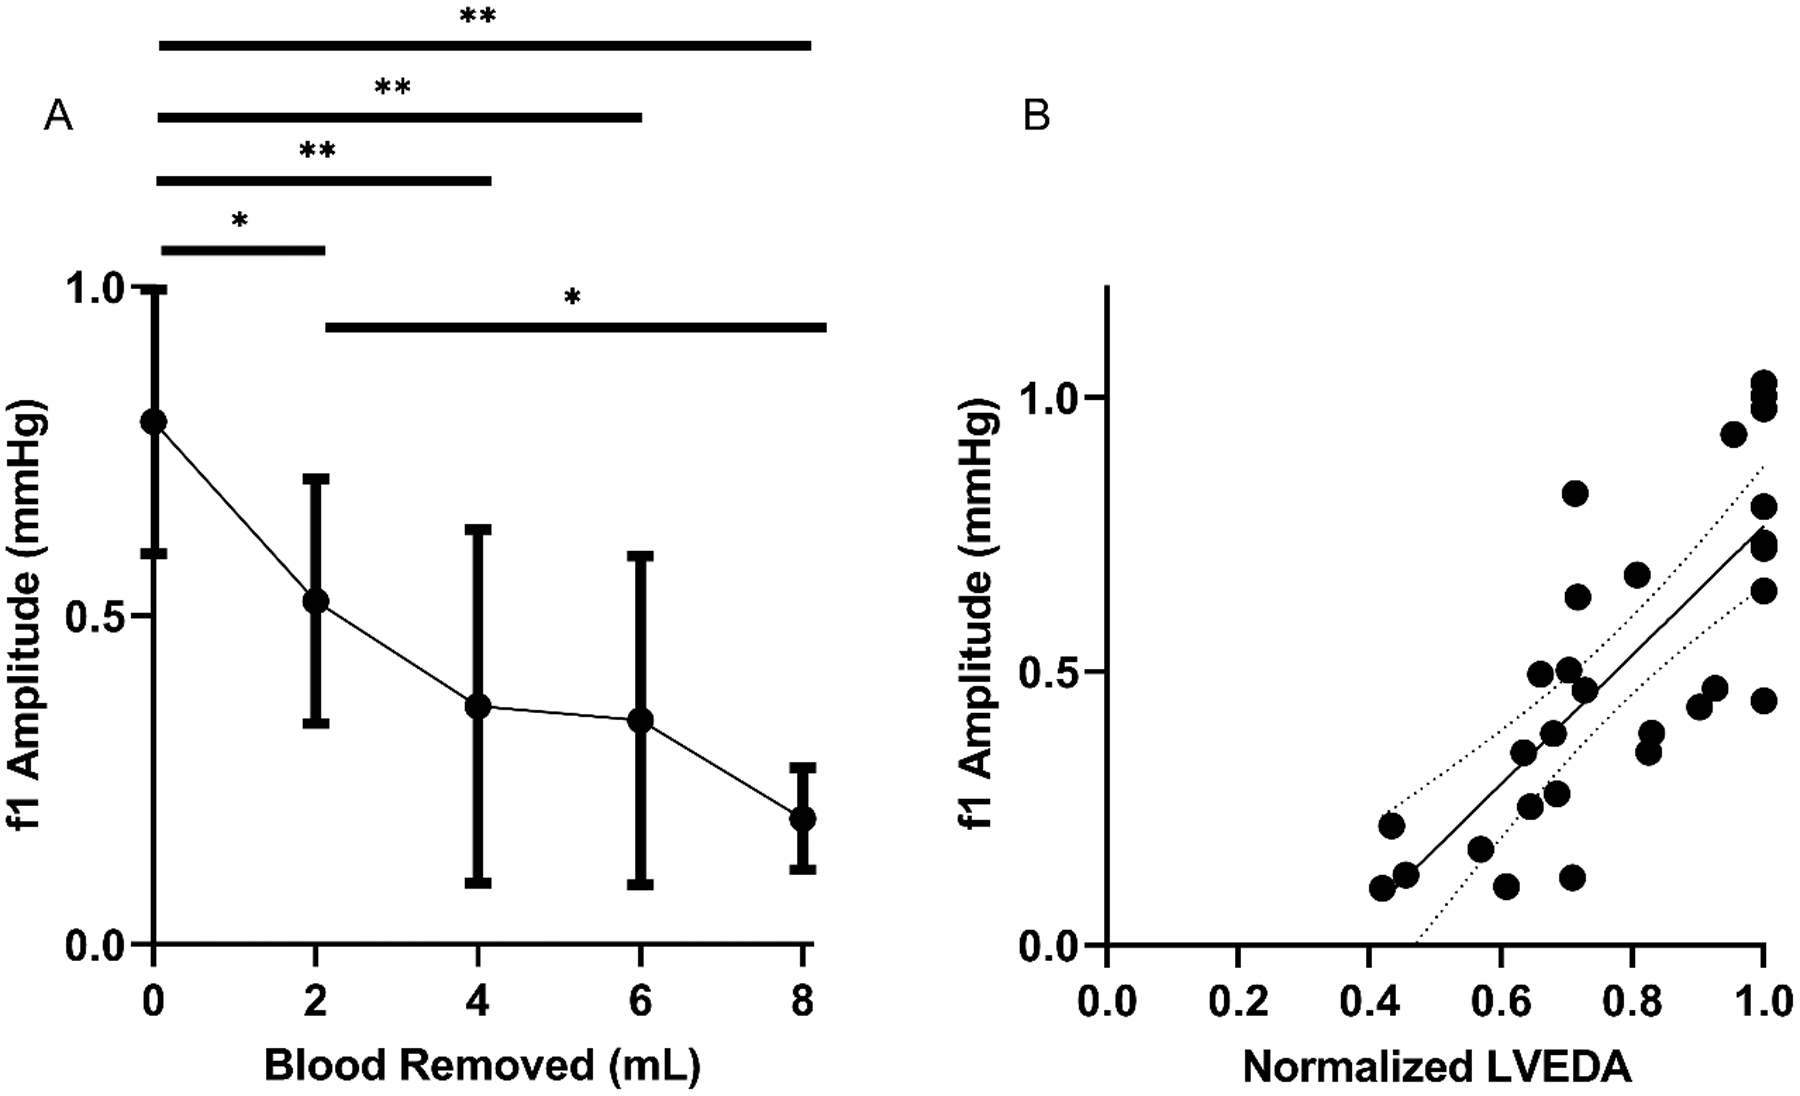
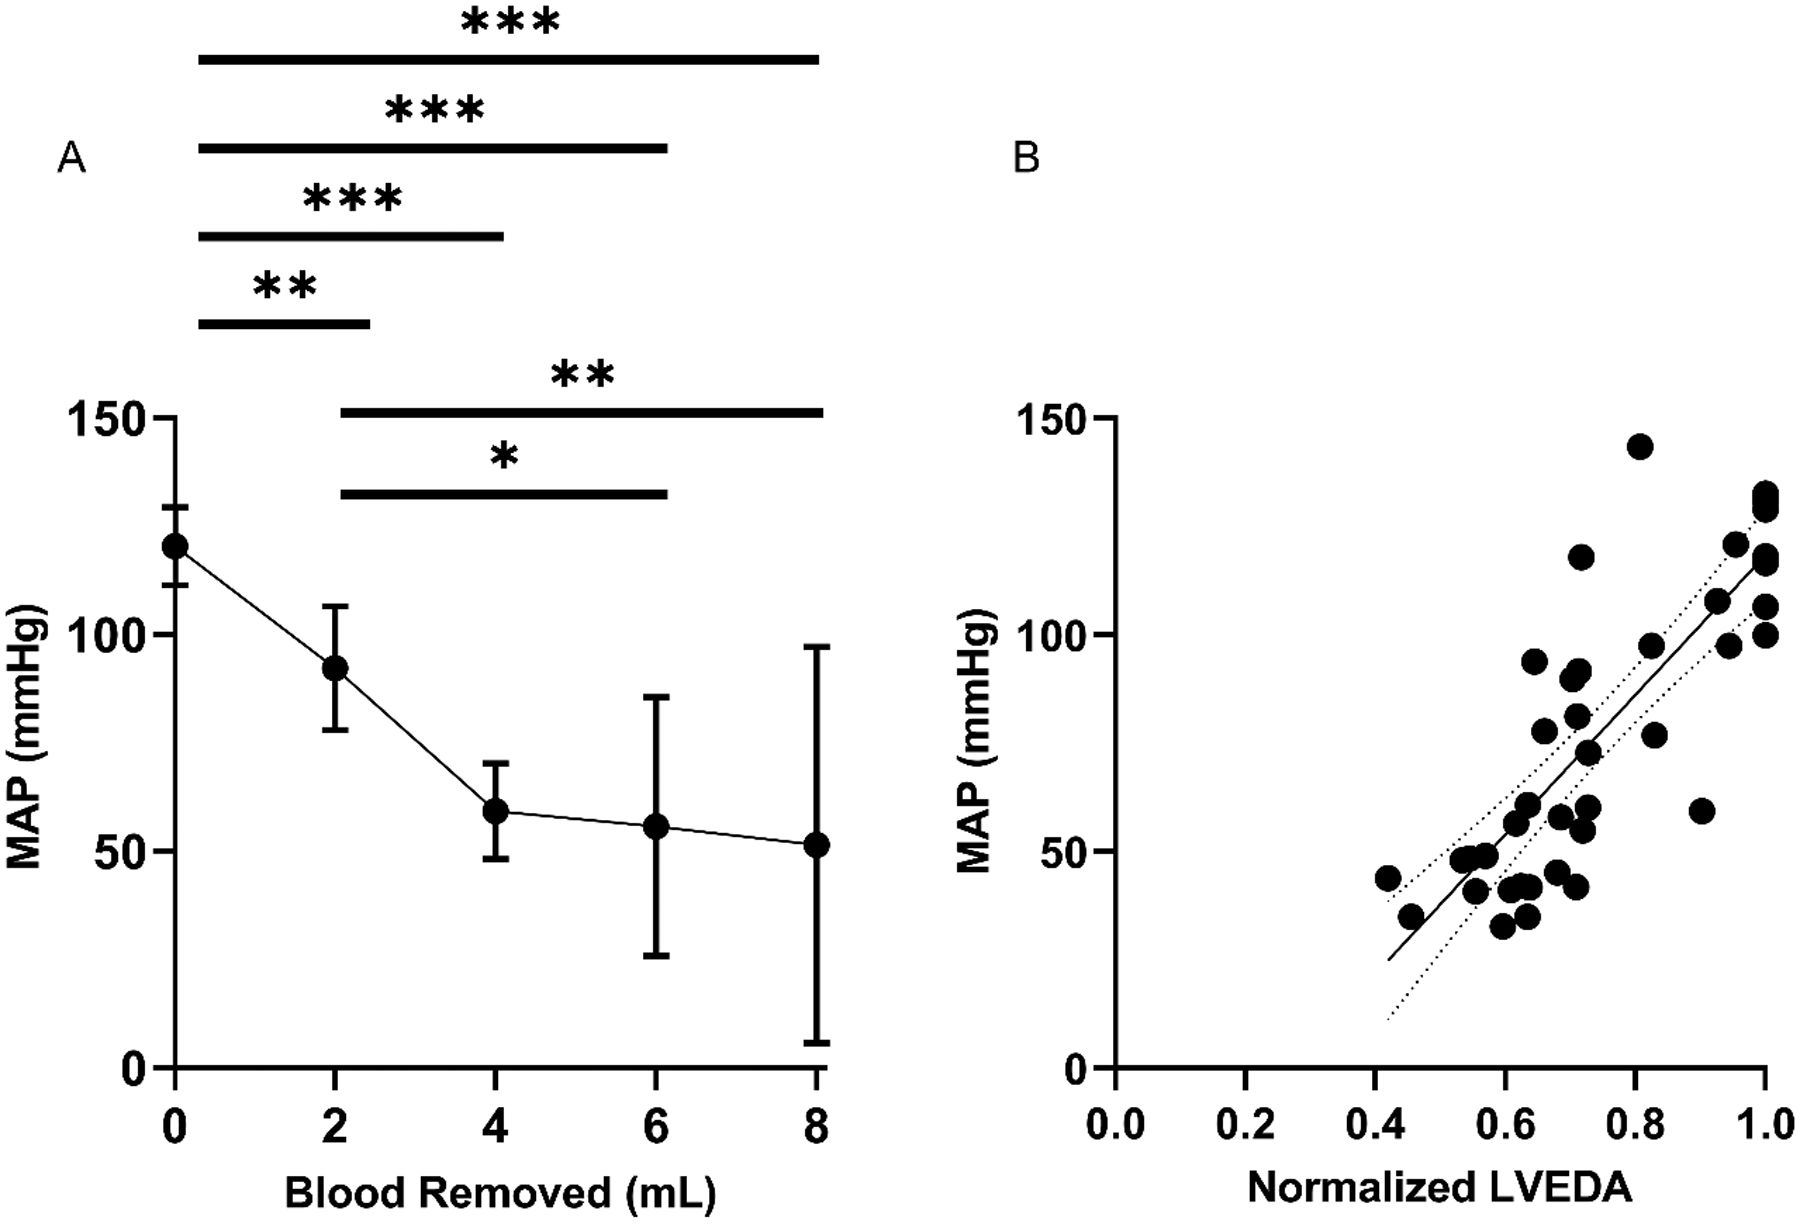
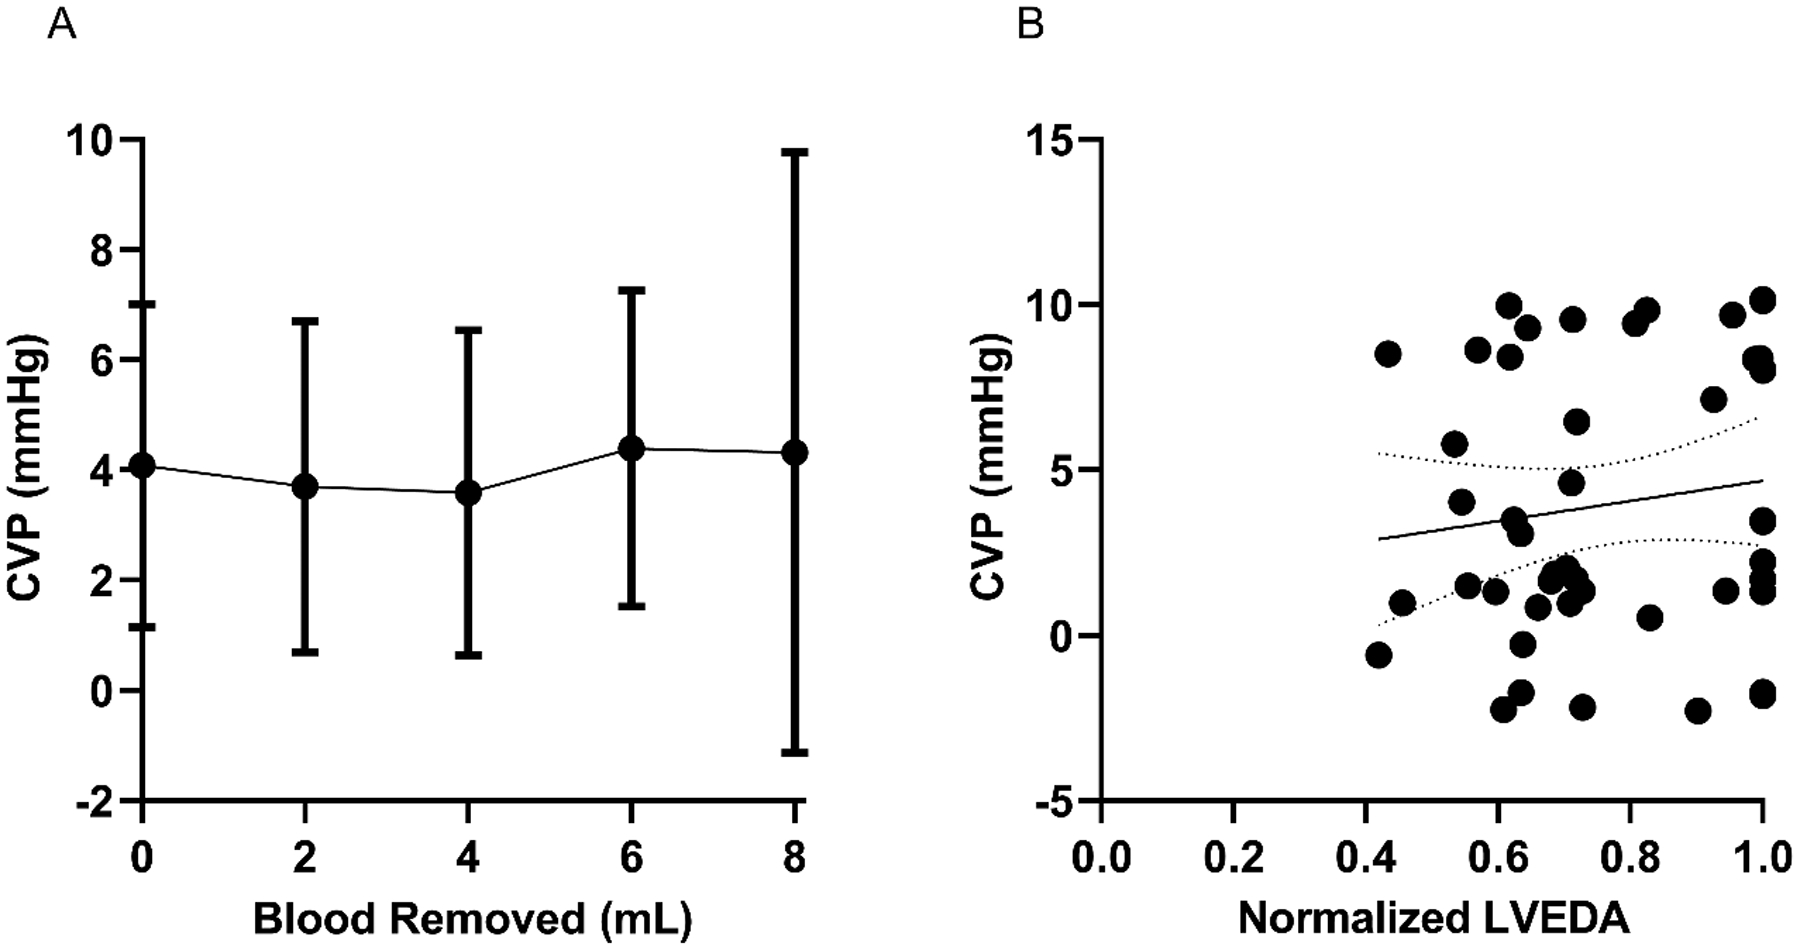
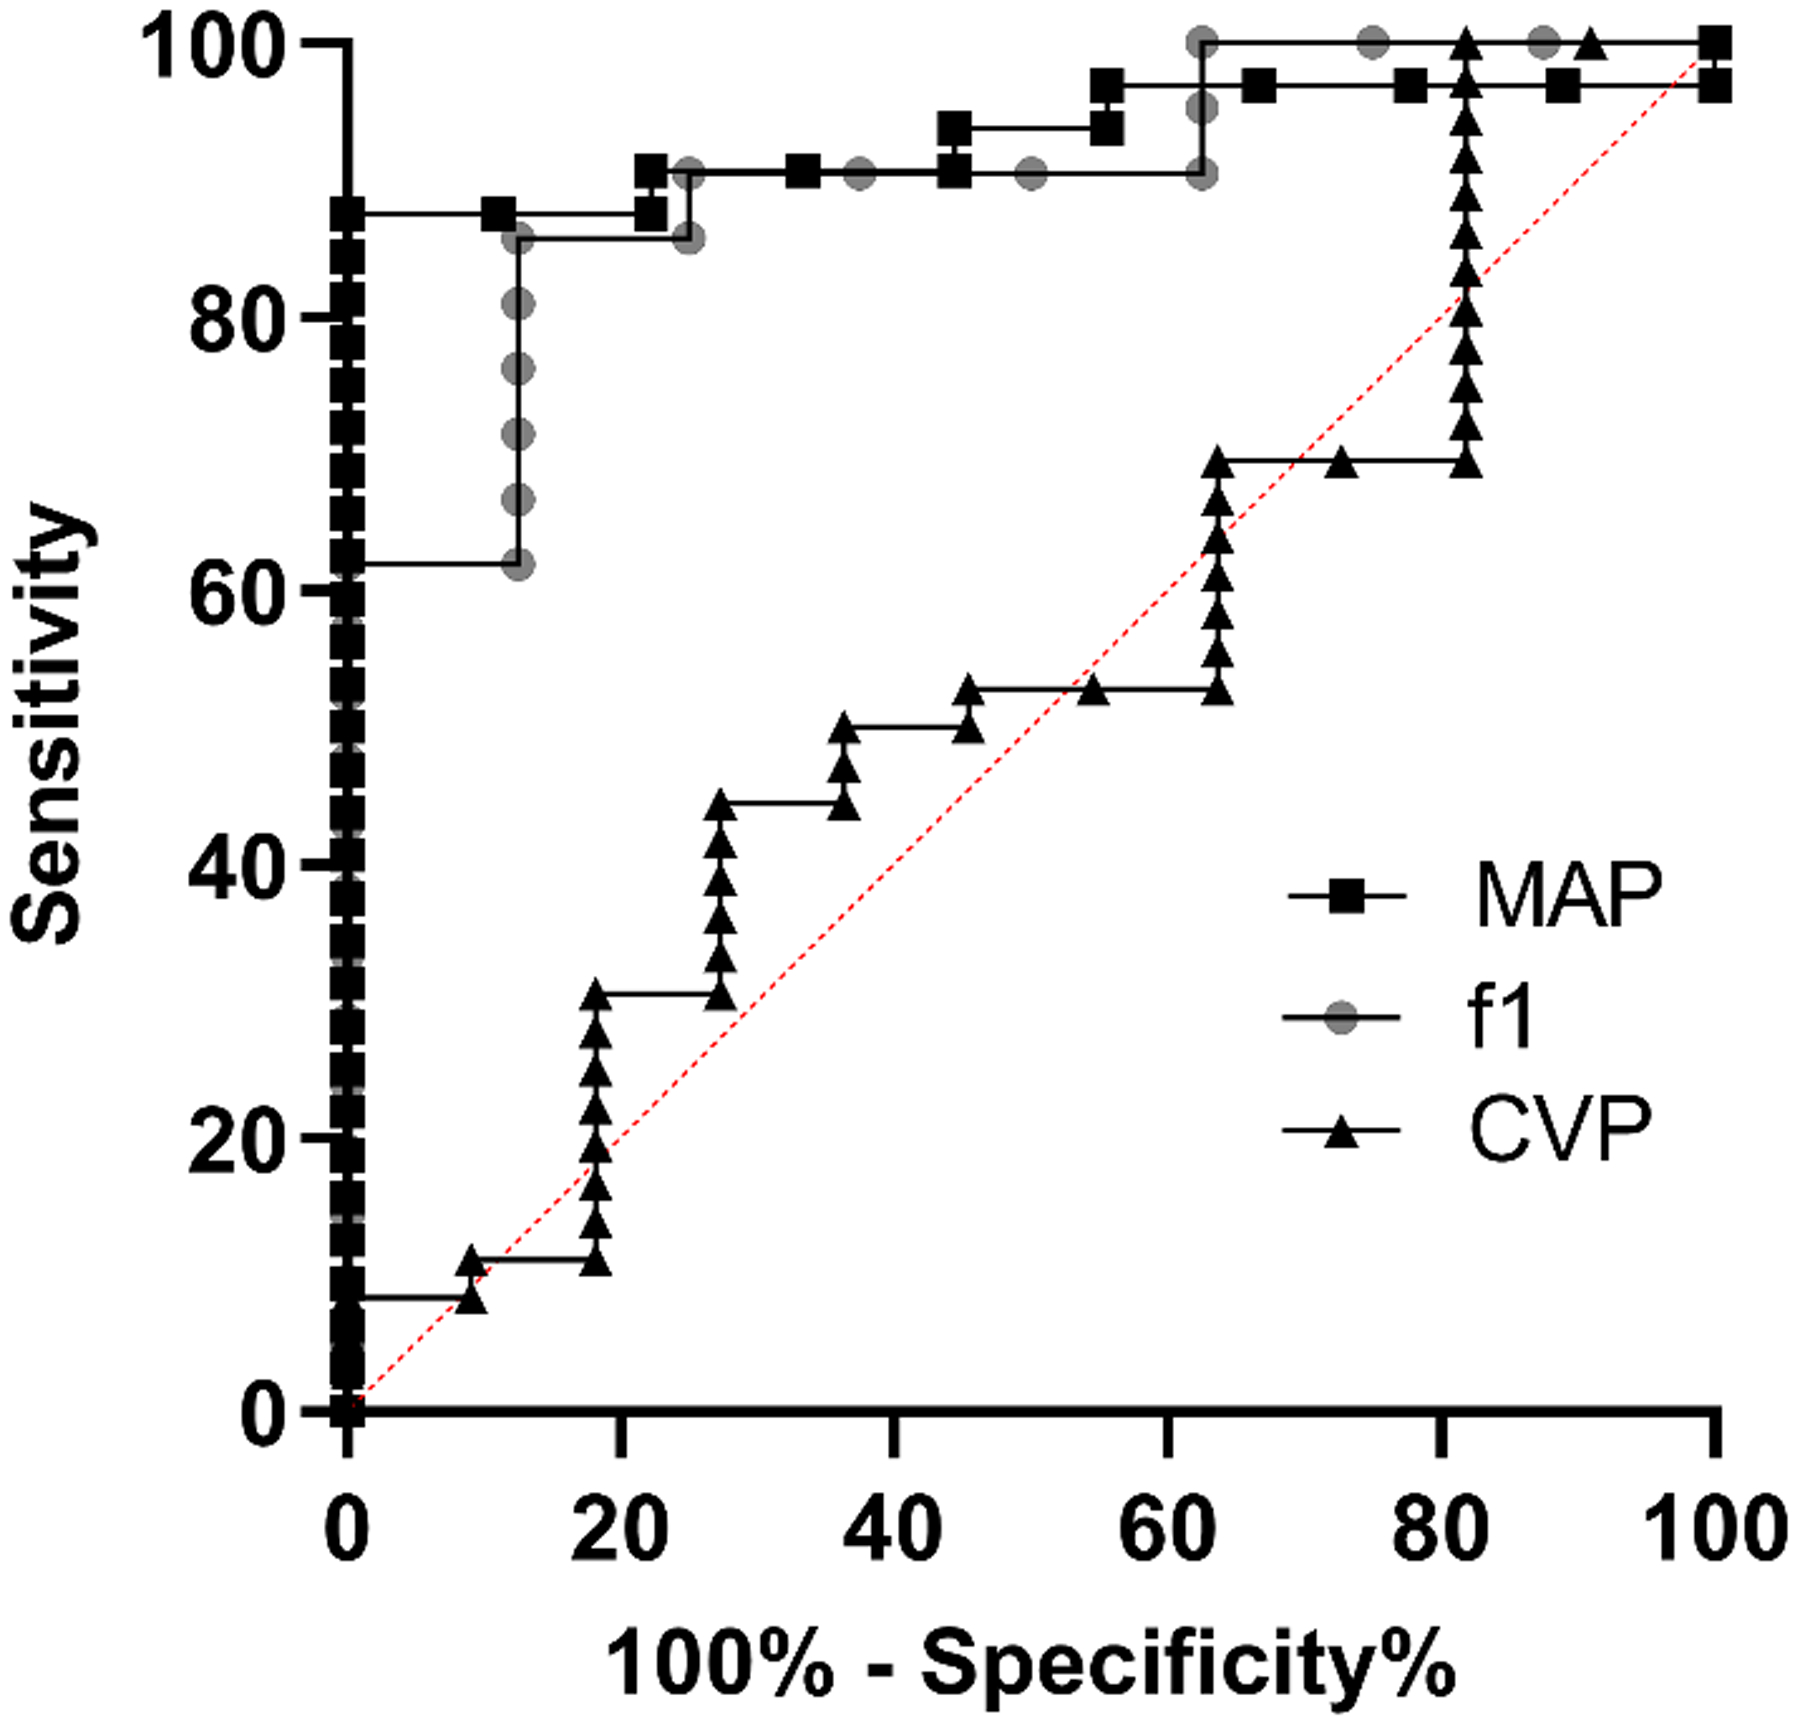
Results: All 7 rats underwent successful hemorrhage. MAP and f1 peak amplitude obtained by IVA showed significant changes with hemorrhage. MAP and f1 peak amplitude also significantly correlated with LVEDA during hemorrhage (R = 0.82 and 0.77, respectively). CVP did not significantly change with hemorrhage, and there was no significant correlation between CVP and LVEDA.
Conclusions: In this study, f1 peak amplitude obtained by IVA was superior to CVP for detecting acute, massive hemorrhage. In addition, f1 peak amplitude correlated well with LVEDA on echocardiography. Translated clinically, IVA might provide a viable alternative to CVP for detecting hemorrhage.
Keywords: Fourier transform; central venous pressure; hemodynamic monitoring; hypotension; vascular.
Figures
Comment in
-
A Change of Tide or the Beginning of the End: COVID-19.Semin Cardiothorac Vasc Anesth. 2021 Mar;25(1):5-10. doi: 10.1177/1089253221989132. Semin Cardiothorac Vasc Anesth. 2021. PMID: 33554769 No abstract available.
References
-
- Carson JL, Noveck H, Berlin JA, Gould SA. Mortality and morbidity in patients with very low postoperative Hb levels who decline blood transfusion. Transfusion. 2002;42(7):812–818. - PubMed
-
- Lier H, Krep H, Schroeder S, Stuber F. Preconditions of hemostasis in trauma: a review. The influence of acidosis, hypocalcemia, anemia, and hypothermia on functional hemostasis in trauma. J Trauma. 2008;65(4):951–960. - PubMed
-
- Wilson M, Davis DP, Coimbra R. Diagnosis and monitoring of hemorrhagic shock during the initial resuscitation of multiple trauma patients: a review. J Emerg Med. 2003;24(4):413–422. - PubMed
-
- Shen T, Baker K. Venous return and clinical hemodynamics: how the body works during acute hemorrhage. Adv Physiol Educ. 2015;39(4):267–271. - PubMed
MeSH terms
Grants and funding
LinkOut - more resources
Full Text Sources
Medical
