Proteomic and metabolic profile analysis of low-temperature storage responses in Ipomoea batata Lam. tuberous roots
- PMID: 32957906
- PMCID: PMC7507648
- DOI: 10.1186/s12870-020-02642-7
Proteomic and metabolic profile analysis of low-temperature storage responses in Ipomoea batata Lam. tuberous roots
Abstract
Background: Sweetpotato (Ipomoea batatas L.) is one of the seven major food crops grown worldwide. Cold stress often can cause protein expression pattern and substance contents variations for tuberous roots of sweetpotato during low-temperature storage. Recently, we developed proteometabolic profiles of the fresh sweetpotatoes (cv. Xinxiang) in an attempt to discern the cold stress-responsive mechanism of tuberous root crops during post-harvest storage.
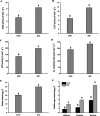
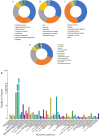
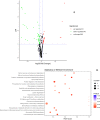
Results: For roots stored under 4 °C condition, the CI index, REC and MDA content in roots were significantly higher than them at control temperature (13 °C). The activities of SOD, CAT, APX, O2.- producing rate, proline and especially soluble sugar contents were also significantly increased. Most of the differentially expressed proteins (DEPs) were implicated in pathways related to metabolic pathway, especially phenylpropanoids and followed by starch and sucrose metabolism. L-ascorbate peroxidase 3 and catalase were down-regulated during low temperature storage. α-amylase, sucrose synthase and fructokinase were significantly up-regulated in starch and sucrose metabolism, while β-glucosidase, glucose-1-phosphate adenylyl-transferase and starch synthase were opposite. Furthermore, metabolome profiling revealed that glucosinolate biosynthesis, tropane, piperidine and pyridine alkaloid biosynthesis as well as protein digestion and absorption played a leading role in metabolic pathways of roots. Leucine, tryptophan, tyrosine, isoleucine and valine were all significantly up-regulated in glucosinolate biosynthesis.
Conclusions: Our proteomic and metabolic profile analysis of sweetpotatoes stored at low temperature reveal that the antioxidant enzymes activities, proline and especially soluble sugar content were significantly increased. Most of the DEPs were implicated in phenylpropanoids and followed by starch and sucrose metabolism. The discrepancy between proteomic (L-ascorbate peroxidase 3 and catalase) and biochemical (CAT/APX activity) data may be explained by higher H2O2 levels and increased ascorbate redox states, which enhanced the CAT/APX activity indirectly. Glucosinolate biosynthesis played a leading role in metabolic pathways. Leucine, tryptophan, tyrosine, isoleucine and valine were all significantly up-regulated in glucosinolate biosynthesis.
Keywords: Chilling tolerance; Low-temperature storage; Proteometabolomic; Starch metabolism; Sweetpotato.
Conflict of interest statement
The authors declare that they have no competing interests.
Figures


Similar articles
-
A comparative study of proteomic differences between pencil and storage roots of sweetpotato (Ipomoea batatas (L.) Lam.).Plant Physiol Biochem. 2015 Feb;87:92-101. doi: 10.1016/j.plaphy.2014.12.010. Epub 2014 Dec 19. Plant Physiol Biochem. 2015. PMID: 25562766
-
Transcriptome profiling of sweetpotato tuberous roots during low temperature storage.Plant Physiol Biochem. 2017 Mar;112:97-108. doi: 10.1016/j.plaphy.2016.12.021. Epub 2016 Dec 24. Plant Physiol Biochem. 2017. PMID: 28056396
-
A proteomic analysis of storage stress responses in Ipomoea batatas (L.) Lam. tuberous root.Mol Biol Rep. 2012 Aug;39(8):8015-25. doi: 10.1007/s11033-012-1648-2. Epub 2012 May 1. Mol Biol Rep. 2012. PMID: 22547271
-
Post harvest spoilage of sweetpotato in tropics and control measures.Crit Rev Food Sci Nutr. 2005;45(7-8):623-44. doi: 10.1080/10408390500455516. Crit Rev Food Sci Nutr. 2005. PMID: 16371331 Review.
-
Review: Defense responses in sweetpotato (Ipomoea batatas L.) against biotic stress.Plant Sci. 2023 Dec;337:111893. doi: 10.1016/j.plantsci.2023.111893. Epub 2023 Oct 7. Plant Sci. 2023. PMID: 37813194 Review.
Cited by
-
Identification of QTLs for stagnant flooding tolerance in rice employing genotyping by sequencing of a RIL population derived from Swarna × Rashpanjor.Physiol Mol Biol Plants. 2021 Dec;27(12):2893-2909. doi: 10.1007/s12298-021-01107-x. Epub 2021 Dec 18. Physiol Mol Biol Plants. 2021. PMID: 35035143 Free PMC article.
-
Storage Behavior and Response to Low-Cost Postharvest Technologies of the Underutilized Purple Yampee (Dioscorea trifida L.f.).Foods. 2025 Jul 10;14(14):2436. doi: 10.3390/foods14142436. Foods. 2025. PMID: 40724257 Free PMC article.
-
Integrated Transcriptomics and Metabolomics Analysis Reveal Key Metabolism Pathways Contributing to Cold Tolerance in Peanut.Front Plant Sci. 2021 Nov 24;12:752474. doi: 10.3389/fpls.2021.752474. eCollection 2021. Front Plant Sci. 2021. PMID: 34899780 Free PMC article.
-
Integrated Transcriptome and Metabolome Analysis Reveals Mechanism of Flavonoid Synthesis During Low-Temperature Storage of Sweet Corn Kernels.Foods. 2024 Dec 12;13(24):4025. doi: 10.3390/foods13244025. Foods. 2024. PMID: 39766968 Free PMC article.
-
Metabolic Insight into Cold Stress Response in Two Contrasting Maize Lines.Life (Basel). 2022 Feb 14;12(2):282. doi: 10.3390/life12020282. Life (Basel). 2022. PMID: 35207570 Free PMC article.
References
-
- Scott GJ, Rosegrant MW, Ringler C. Global projections for root and tuber crops to the year 2020. Food Policy. 2000;25:561–597. doi: 10.1016/S0306-9192(99)00087-1. - DOI
-
- Tumwegamire S, Kapinga R, Rubaihayo PR, Labonte DR, Grüneberg WJ, Burgos G, et al. Evaluation of dry matter, protein, starch, sucrose, β-carotene, iron, zinc, calcium, and magnesium in east African sweetpotato [Ipomoea batatas (L.) lam] germplasm. HortScience. 2011;46:348–357. doi: 10.21273/HORTSCI.46.3.348. - DOI
-
- Masuda D, Fukuoka N, Goto H, Kano Y. Effect of cold treatment after harvest on sugar contents and storability in sweet potato (Ipomoea batatas L.) Horticult Res. 2007;6:597–601.
MeSH terms
Substances
LinkOut - more resources
Full Text Sources
Molecular Biology Databases
Miscellaneous

