

Responses of leaf gas exchange attributes, photosynthetic pigments and antioxidant enzymes in NaCl-stressed cotton (Gossypium hirsutum L.) seedlings to exogenous glycine betaine and salicylic acid
- PMID: 32957907
- PMCID: PMC7507723
- DOI: 10.1186/s12870-020-02624-9
Responses of leaf gas exchange attributes, photosynthetic pigments and antioxidant enzymes in NaCl-stressed cotton (Gossypium hirsutum L.) seedlings to exogenous glycine betaine and salicylic acid
Abstract
Background: Application of exogenous glycine betaine (GB) and exogenous salicylic acid (SA) mitigates the adverse effects of salinity. Foliar spraying with exogenous GB or SA alleviates salt stress in plants by increasing leaf gas exchange and stimulating antioxidant enzyme activity. The effects of foliar application of exogenous GB and SA on the physiology and biochemistry of cotton seedlings subjected to salt stress remain unclear.
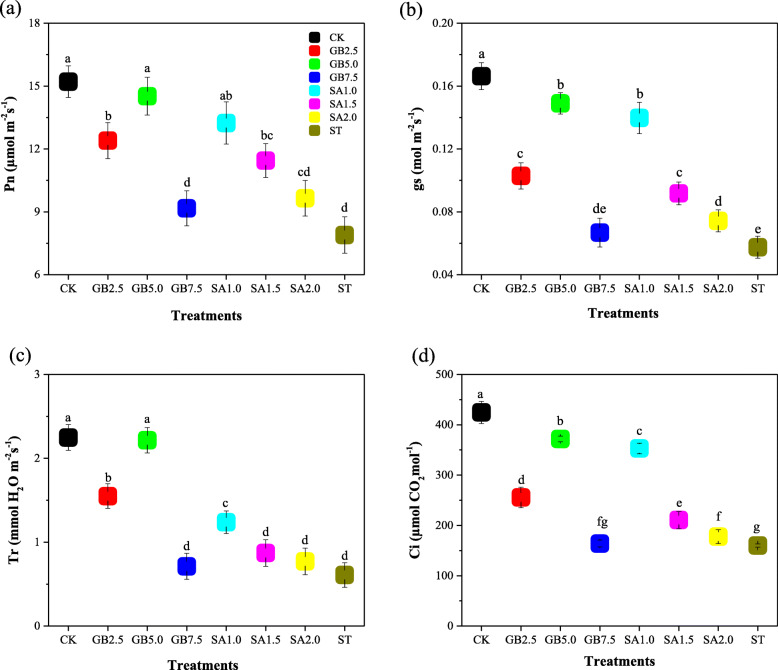
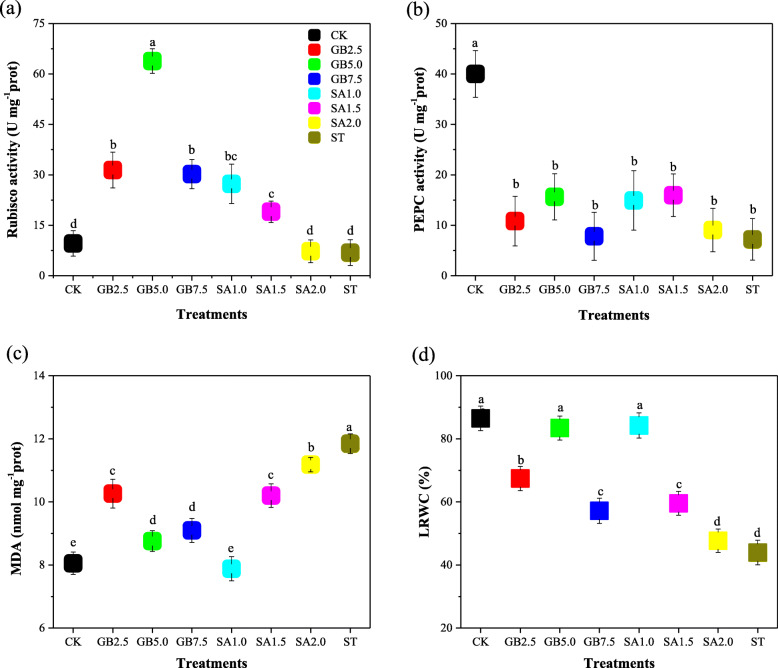
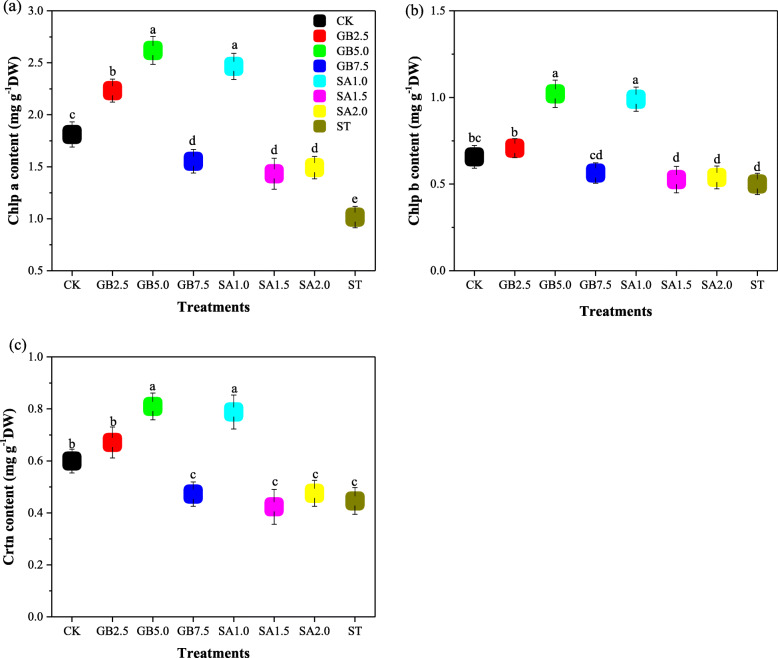
Results: Results showed that salt stress of 150 mM NaCl significantly reduced leaf gas exchange and chlorophyll fluorescence and decreased photosynthetic pigment quantities and leaf relative water content. Foliar spray concentrations of 5.0 mM exogenous GB and 1.0 mM exogenous SA promoted gas exchange and fluorescence in cotton seedlings, increased quantities of chlorophyll pigments, and stimulated the antioxidant enzyme activity. The foliar spray also increased leaf relative water content and endogenous GB and SA content in comparison with the salt-stressed only control. Despite the salt-induced increase in antioxidant enzyme content, exogenous GB and SA in experimental concentrations significantly increased the activity of glutathione reductase, ascorbate peroxidase, superoxide dismutase, catalase and peroxidase, and decreased malondialdehyde content under salt stress. Across all experimental foliar spray GB and SA concentrations, the photochemical efficiency of photosystem II (FV/FM) reached a peak at a concentration of 5.0 mM GB. The net photosynthetic rate (Pn) and FV/FM were positively correlated with chlorophyll a and chlorophyll b content in response to foliar spraying of exogenous GB and SA under salt stress.
Conclusions: We concluded, from our results, that concentrations of 5.0 mM GB or 1.0 mM SA are optimal choices for mitigating NaCl-induced damage in cotton seedlings because they promote leaf photosynthesis, increase quantities of photosynthetic pigments, and stimulate antioxidant enzyme activity. Among, 5.0 mM GB and 1.0 mM SA, the best performance in enhancing endogenous GB and SA concentrations was obtained with the foliar application of 1.0 mM SA under salt stress.
Keywords: Antioxidant; Cotton; Gas exchange; Glycine betaine; Salicylic acid; Salt stress.
Conflict of interest statement
The authors declare that they have no competing interests.
Figures


Similar articles
-
Linking exogenous foliar application of glycine betaine and stomatal characteristics with salinity stress tolerance in cotton (Gossypium hirsutum L.) seedlings.BMC Plant Biol. 2021 Mar 20;21(1):146. doi: 10.1186/s12870-021-02892-z. BMC Plant Biol. 2021. PMID: 33743608 Free PMC article.
-
Influence of Exogenous Salicylic Acid and Nitric Oxide on Growth, Photosynthesis, and Ascorbate-Glutathione Cycle in Salt Stressed Vigna angularis.Biomolecules. 2019 Dec 26;10(1):42. doi: 10.3390/biom10010042. Biomolecules. 2019. PMID: 31888108 Free PMC article.
-
Role of exogenous-applied salicylic acid, zinc and glycine betaine to improve drought-tolerance in wheat during reproductive growth stages.BMC Plant Biol. 2021 Dec 6;21(1):574. doi: 10.1186/s12870-021-03367-x. BMC Plant Biol. 2021. PMID: 34872519 Free PMC article.
-
Glycine betaine and plant abiotic stresses: Unravelling physiological and molecular responses.Plant Sci. 2025 Jun;355:112479. doi: 10.1016/j.plantsci.2025.112479. Epub 2025 Mar 23. Plant Sci. 2025. PMID: 40132665 Review.
-
Glycine Betaine Accumulation, Significance and Interests for Heavy Metal Tolerance in Plants.Plants (Basel). 2020 Jul 15;9(7):896. doi: 10.3390/plants9070896. Plants (Basel). 2020. PMID: 32679909 Free PMC article. Review.
Cited by
-
Responses to Salt Stress of the Interspecific Hybrid Solanum insanum × Solanum melongena and Its Parental Species.Plants (Basel). 2023 Jan 8;12(2):295. doi: 10.3390/plants12020295. Plants (Basel). 2023. PMID: 36679008 Free PMC article.
-
5-ALA, DTA-6, and Nitrogen Mitigate NaCl Stress by Promoting Photosynthesis and Carbon Metabolism in Rice Seedlings.Metabolites. 2024 Feb 27;14(3):142. doi: 10.3390/metabo14030142. Metabolites. 2024. PMID: 38535302 Free PMC article.
-
Impact of salt stress on physiology, leaf mass, and nutrient accumulation in romaine lettuce.Photosynthetica. 2023 Jul 11;61(3):342-353. doi: 10.32615/ps.2023.027. eCollection 2023. Photosynthetica. 2023. PMID: 39651368 Free PMC article.
-
Identification and Analysis of the Plasma Membrane H+-ATPase Gene Family in Cotton and Its Roles in Response to Salt Stress.Plants (Basel). 2024 Dec 16;13(24):3510. doi: 10.3390/plants13243510. Plants (Basel). 2024. PMID: 39771208 Free PMC article.
-
Linking exogenous foliar application of glycine betaine and stomatal characteristics with salinity stress tolerance in cotton (Gossypium hirsutum L.) seedlings.BMC Plant Biol. 2021 Mar 20;21(1):146. doi: 10.1186/s12870-021-02892-z. BMC Plant Biol. 2021. PMID: 33743608 Free PMC article.
References
-
- Nachshon U. Cropland soil salinization and associated hydrology: trends, processes and examples. Water. 2018;10(8):1030. doi: 10.3390/w10081030. - DOI
-
- Syeed S, Anjum NA, Nazar R, Iqbal N, Masood A, Khan NA. Salicylic acid-mediated changes in photosynthesis, nutrients content and antioxidant metabolism in two mustard (Brassica juncea L.) cultivars differing in salt tolerance. Acta Physiol Plant. 2011;33(3):877–886. doi: 10.1007/s11738-010-0614-7. - DOI
MeSH terms
Substances
LinkOut - more resources
Full Text Sources
Medical
