

Expression correlation attenuates within and between key signaling pathways in chronic kidney disease
- PMID: 32957963
- PMCID: PMC7504859
- DOI: 10.1186/s12920-020-00772-3
Expression correlation attenuates within and between key signaling pathways in chronic kidney disease
Abstract
Background: Compared to the conventional differential expression approach, differential coexpression analysis represents a different yet complementary perspective into diseased transcriptomes. In particular, global loss of transcriptome correlation was previously observed in aging mice, and a most recent study found genetic and environmental perturbations on human subjects tended to cause universal attenuation of transcriptome coherence. While methodological progresses surrounding differential coexpression have helped with research on several human diseases, there has not been an investigation of coexpression disruptions in chronic kidney disease (CKD) yet.
Methods: RNA-seq was performed on total RNAs of kidney tissue samples from 140 CKD patients. A combination of differential coexpression methods were employed to analyze the transcriptome transition in CKD from the early, mild phase to the late, severe kidney damage phase.
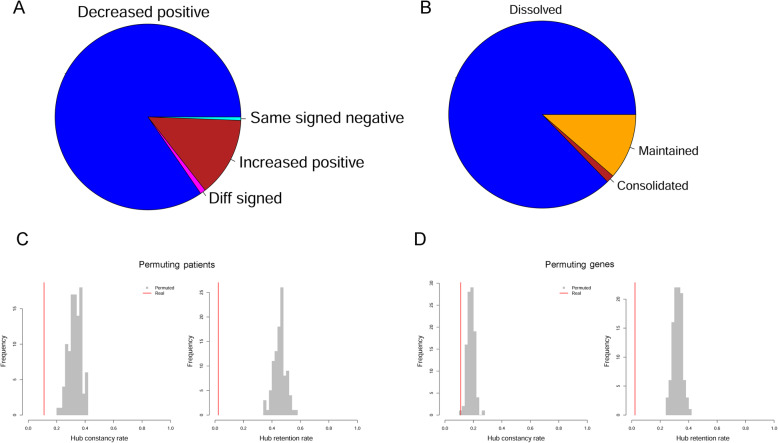
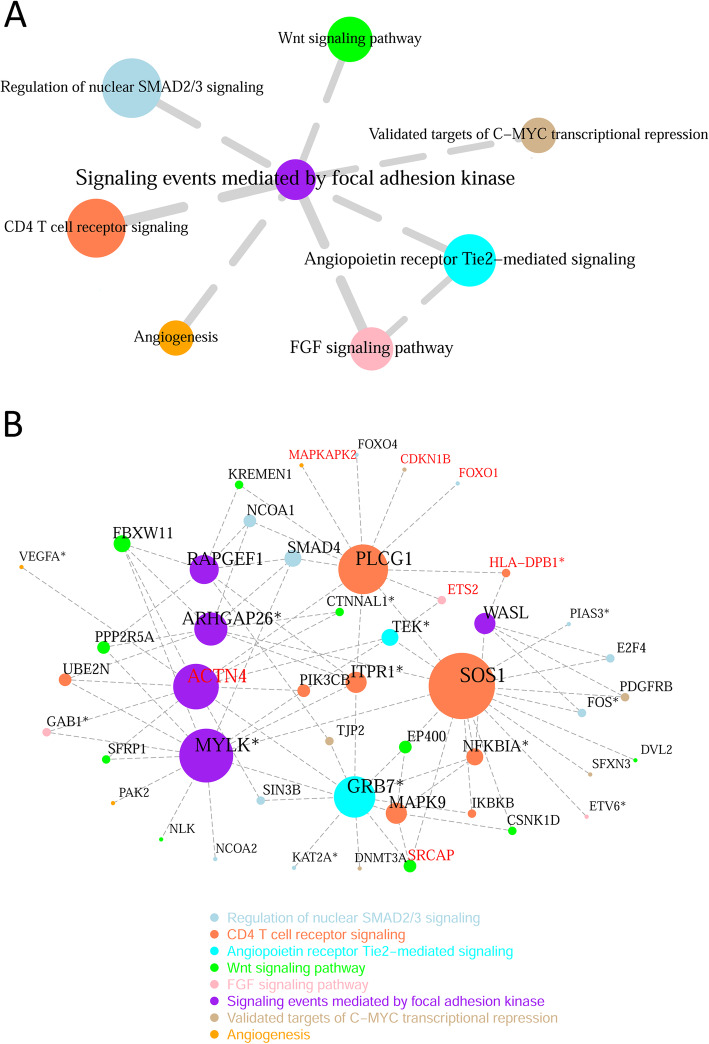
Results: We discovered a global expression correlation attenuation in CKD progression, with pathway Regulation of nuclear SMAD2/3 signaling demonstrating the most remarkable intra-pathway correlation rewiring. Moreover, the pathway Signaling events mediated by focal adhesion kinase displayed significantly weakened crosstalk with seven pathways, including Regulation of nuclear SMAD2/3 signaling. Well-known relevant genes, such as ACTN4, were characterized with widespread correlation disassociation with partners from a wide array of signaling pathways.
Conclusions: Altogether, our analysis reported a global expression correlation attenuation within and between key signaling pathways in chronic kidney disease, and presented a list of vanishing hub genes and disrupted correlations within and between key signaling pathways, illuminating on the pathophysiological mechanisms of CKD progression.
Keywords: Chronic kidney disease; Correlation attenuation; Differential co-expression; Pathway crosstalk.
Conflict of interest statement
The authors declare that they have no competing interests.
Figures


Similar articles
-
Identification of Genes Associated with Smad3-dependent Renal Injury by RNA-seq-based Transcriptome Analysis.Sci Rep. 2015 Dec 9;5:17901. doi: 10.1038/srep17901. Sci Rep. 2015. PMID: 26648110 Free PMC article.
-
The key candidate genes in tubulointerstitial injury of chronic kidney diseases patients as determined by bioinformatic analysis.Cell Biochem Funct. 2020 Aug;38(6):761-772. doi: 10.1002/cbf.3545. Epub 2020 Apr 27. Cell Biochem Funct. 2020. PMID: 32340064
-
A comparative transcriptome analysis identifying FGF23 regulated genes in the kidney of a mouse CKD model.PLoS One. 2012;7(9):e44161. doi: 10.1371/journal.pone.0044161. Epub 2012 Sep 6. PLoS One. 2012. PMID: 22970174 Free PMC article.
-
Central role of dysregulation of TGF-β/Smad in CKD progression and potential targets of its treatment.Biomed Pharmacother. 2018 May;101:670-681. doi: 10.1016/j.biopha.2018.02.090. Epub 2018 Mar 22. Biomed Pharmacother. 2018. PMID: 29518614 Review.
-
Hypoxia, HIF, and Associated Signaling Networks in Chronic Kidney Disease.Int J Mol Sci. 2017 Apr 30;18(5):950. doi: 10.3390/ijms18050950. Int J Mol Sci. 2017. PMID: 28468297 Free PMC article. Review.
Cited by
-
The International Conference on Intelligent Biology and Medicine 2019 (ICIBM 2019): computational methods and applications in medical genomics.BMC Med Genomics. 2020 Apr 3;13(Suppl 5):47. doi: 10.1186/s12920-020-0678-1. BMC Med Genomics. 2020. PMID: 32241271 Free PMC article.
-
Conditional transcriptional relationships may serve as cancer prognostic markers.BMC Med Genomics. 2021 Dec 2;14(Suppl 2):101. doi: 10.1186/s12920-021-00958-3. BMC Med Genomics. 2021. PMID: 34856998 Free PMC article.
-
RNA editing affects cis-regulatory elements and predicts adverse cancer survival.Cancer Med. 2021 Sep;10(17):6114-6127. doi: 10.1002/cam4.4146. Epub 2021 Jul 28. Cancer Med. 2021. PMID: 34319007 Free PMC article.
-
Rewired Pathways and Disrupted Pathway Crosstalk in Schizophrenia Transcriptomes by Multiple Differential Coexpression Methods.Genes (Basel). 2021 Apr 29;12(5):665. doi: 10.3390/genes12050665. Genes (Basel). 2021. PMID: 33946654 Free PMC article.
-
Novel targets in renal fibrosis based on bioinformatic analysis.Front Genet. 2022 Nov 29;13:1046854. doi: 10.3389/fgene.2022.1046854. eCollection 2022. Front Genet. 2022. PMID: 36523757 Free PMC article.
References
Publication types
MeSH terms
Grants and funding
LinkOut - more resources
Full Text Sources
Medical
Miscellaneous
