

COVID19-world: a shiny application to perform comprehensive country-specific data visualization for SARS-CoV-2 epidemic
- PMID: 32958001
- PMCID: PMC7503432
- DOI: 10.1186/s12874-020-01121-9
COVID19-world: a shiny application to perform comprehensive country-specific data visualization for SARS-CoV-2 epidemic
Abstract
Background: Data analysis and visualization is an essential tool for exploring and communicating findings in medical research, especially in epidemiological surveillance.
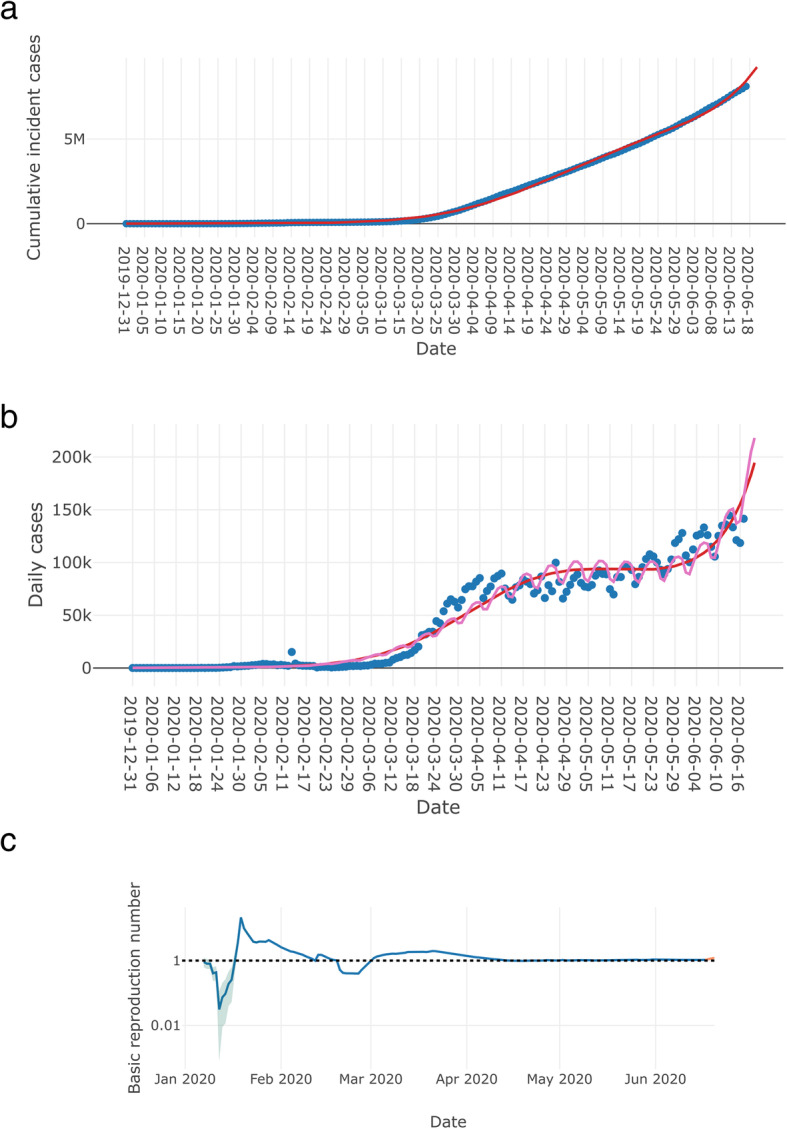
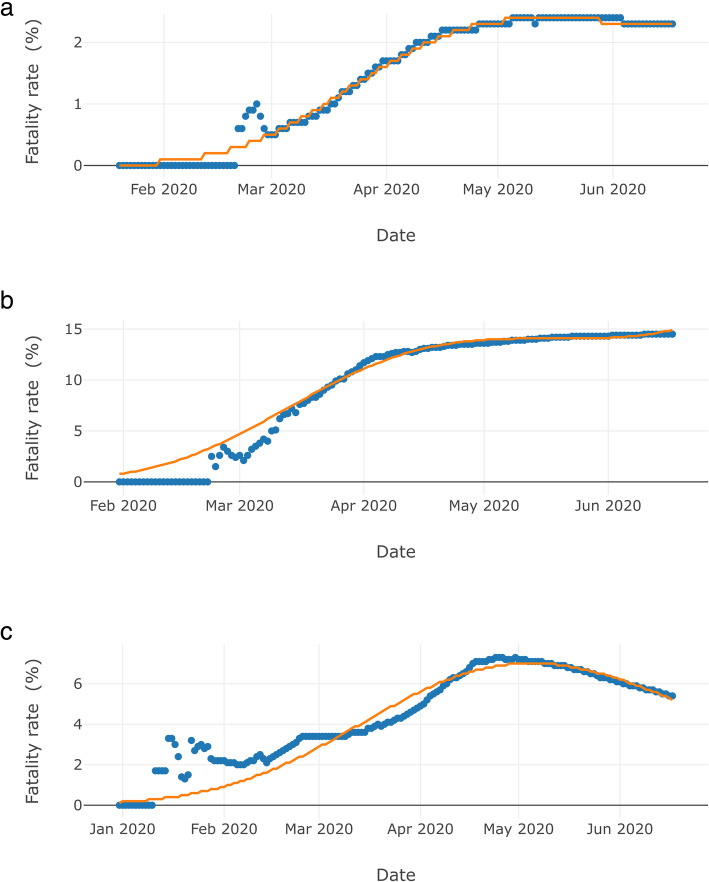
Results: Data on COVID-19 diagnosed cases and mortality, from January 1st, 2020, onwards is collected automatically from the European Centre for Disease Prevention and Control (ECDC). We have developed a Shiny application for data visualization and analysis of several indicators to follow the SARS-CoV-2 epidemic using ECDC data. A country-specific tool for basic epidemiological surveillance, in an interactive and user-friendly manner. The available analyses cover time trends and projections, attack rate, population fatality rate, case fatality rate, and basic reproduction number.
Conclusions: The COVID19-World online web application systematically produces daily updated country-specific data visualization and analysis of the SARS-CoV-2 epidemic worldwide. The application may help for a better understanding of the SARS-CoV-2 epidemic worldwide.
Keywords: Basic reproduction number; COVID-19; Case fatality rate; Data visualization; Epidemic; Mortality; Mortality rate; Poisson regression; SARS-CoV-2.
Conflict of interest statement
The authors declare that they have no competing interests.
Figures


References
-
- Organization WH. Rolling updates on coronavirus disease (COVID-19). Updated 13 May 2020 Geneva (updated May 13th, 2020). [https://www.who.int/emergencies/diseases/novel-coronavirus-2019/events-a...]. Accessed May 2020.
-
- Roser M, Ritchie H, Ortiz-Ospina E. Hasell J. Coronavirus Pandemic (COVID-19); 2020. Published online at OurWorldInData.org. Retrieved from: https://ourworldindata.org/coronavirus. [Online Resource].
Publication types
MeSH terms
LinkOut - more resources
Full Text Sources
Miscellaneous
