

Atherosclerotic Plaque Burden on Abdominal CT: Automated Assessment With Deep Learning on Noncontrast and Contrast-enhanced Scans
- PMID: 32958429
- PMCID: PMC7969468
- DOI: 10.1016/j.acra.2020.08.022
Atherosclerotic Plaque Burden on Abdominal CT: Automated Assessment With Deep Learning on Noncontrast and Contrast-enhanced Scans
Abstract
Background: Abdominal aortic atherosclerotic plaque burden may have clinical significance but manual measurement is time-consuming and impractical.
Purpose: To perform external validation on an automated atherosclerotic plaque detector for noncontrast and postcontrast abdominal CT.
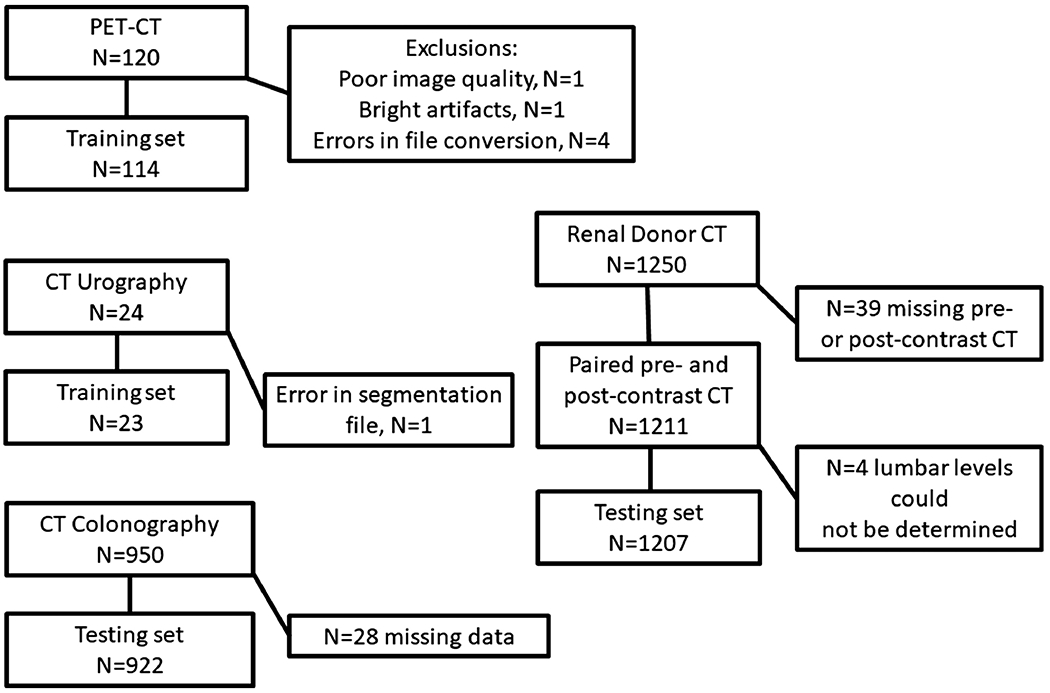
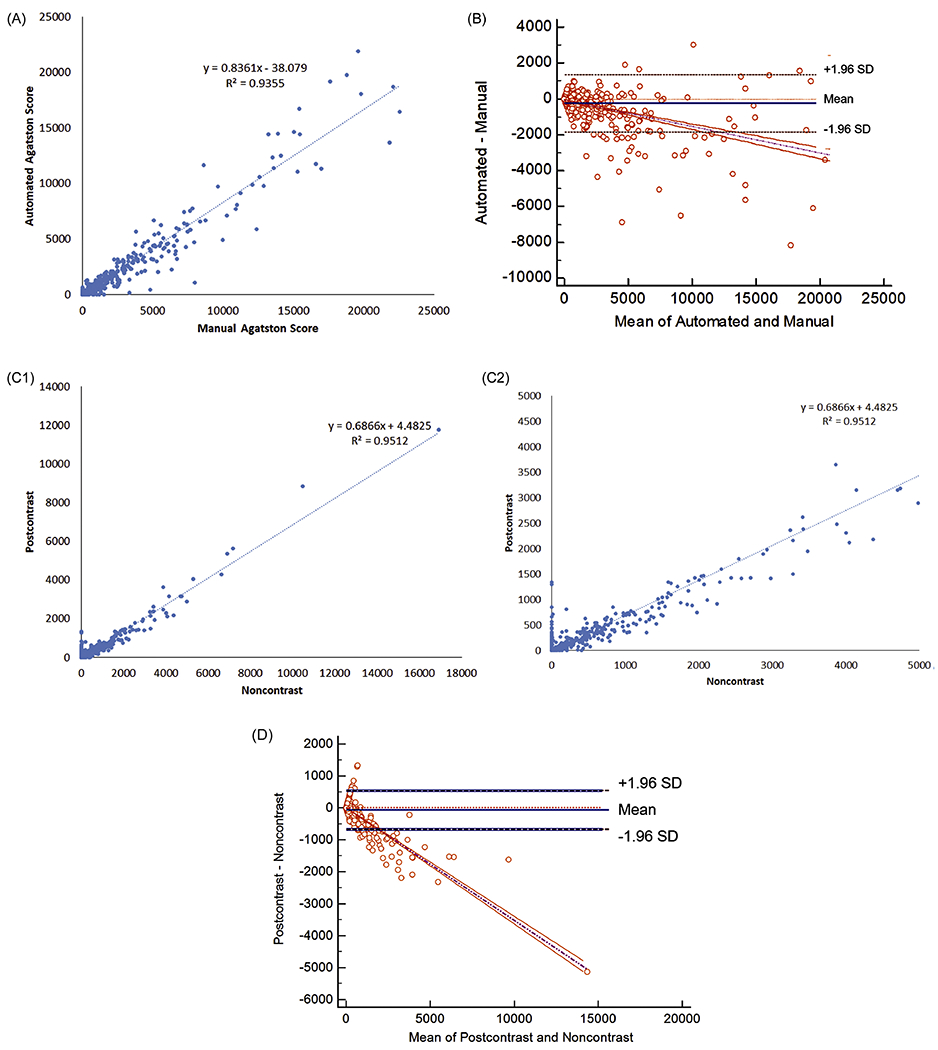
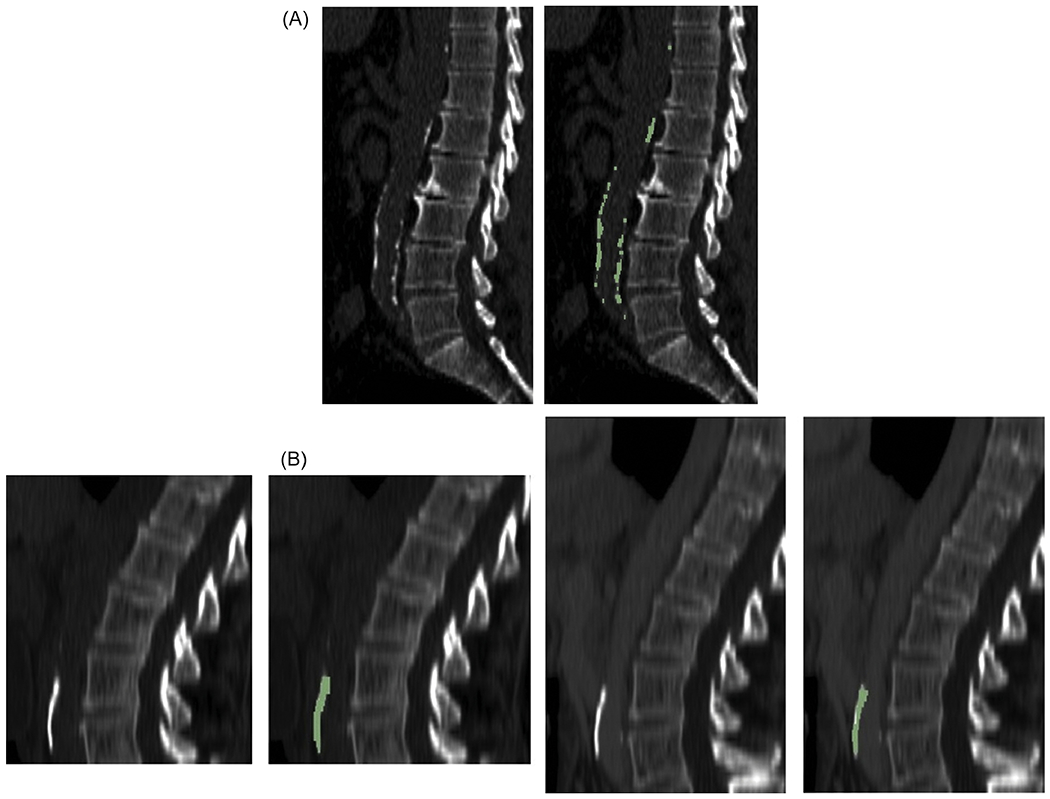
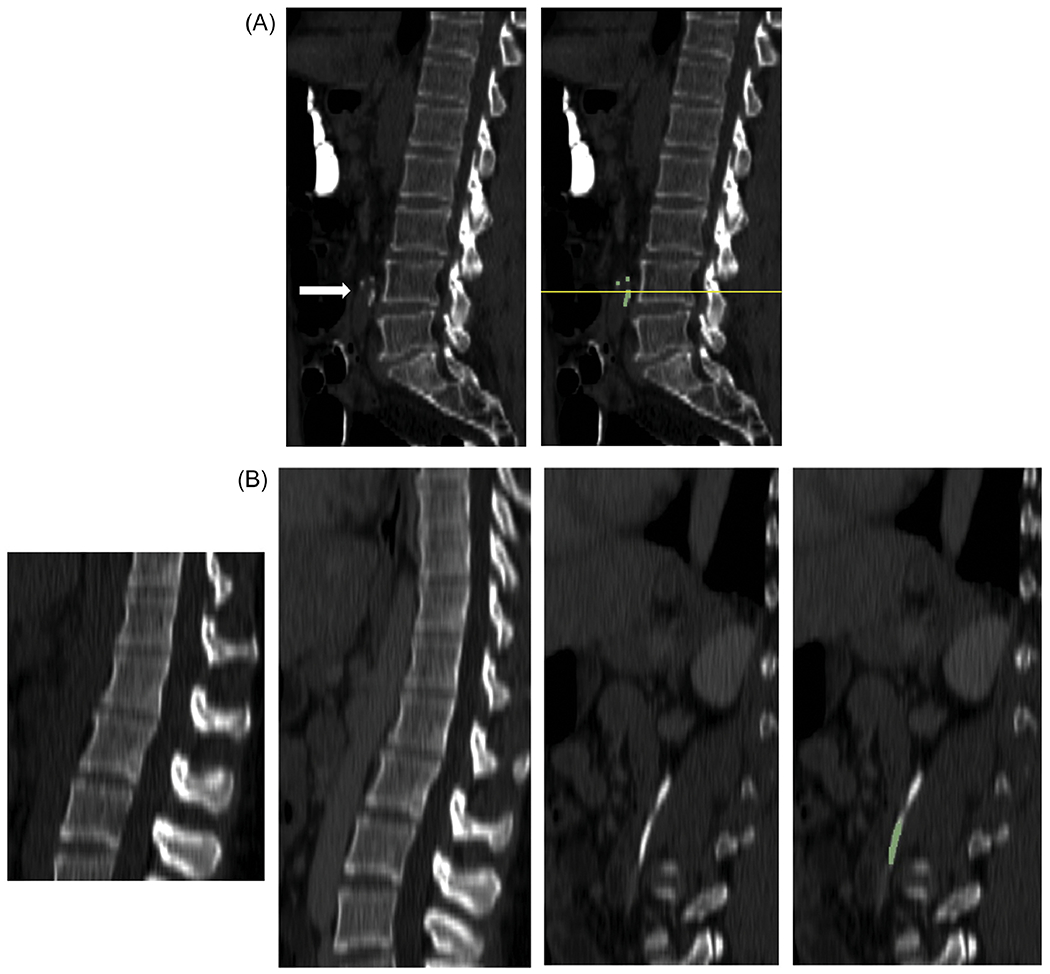
Materials and methods: The training data consisted of 114 noncontrast CT scans and 23 postcontrast CT urography scans. The testing data set consisted of 922 CT colonography (CTC) scans, and 1207 paired noncontrast and postcontrast CT scans from renal donors from a second institution. Reference standard data included manual plaque segmentations in the 137 training scans and manual plaque burden measurements in the 922 CTC scans. The total Agatston score and group (0-3) was determined using fully-automated deep learning software. Performance was assessed by measures of agreement, linear regression, and paired evaluations.
Results: On CTC scans, automated Agatston scoring correlated highly with manual assessment (R2 = 0.94). On paired renal donor CT scans, automated Agatston scoring on postcontrast CT correlated highly with noncontrast CT (R2 = 0.95). When plaque burden was expressed as a group score, there was excellent agreement for both the CTC (weighted kappa 0.80 ± 0.01 [95% confidence interval: 0.78-0.83]) and renal donor (0.83 ± 0.02 [0.79-0.86]) assessments.
Conclusion: Fully automated detection, segmentation, and scoring of abdominal aortic atherosclerotic plaques on both pre- and post-contrast CT was validated and may have application for population-based studies.
Keywords: 3D-UNet; Agatston score; Image processing; machine learning.
Published by Elsevier Inc.
Figures
Similar articles
-
Automated detection of incidental abdominal aortic aneurysms on computed tomography.Abdom Radiol (NY). 2024 Feb;49(2):642-650. doi: 10.1007/s00261-023-04119-1. Epub 2023 Dec 13. Abdom Radiol (NY). 2024. PMID: 38091064
-
A deep learning system for automated kidney stone detection and volumetric segmentation on noncontrast CT scans.Med Phys. 2022 Apr;49(4):2545-2554. doi: 10.1002/mp.15518. Epub 2022 Feb 22. Med Phys. 2022. PMID: 35156216 Free PMC article.
-
Automated segmentation and quantification of aortic calcification at abdominal CT: application of a deep learning-based algorithm to a longitudinal screening cohort.Abdom Radiol (NY). 2019 Aug;44(8):2921-2928. doi: 10.1007/s00261-019-02014-2. Abdom Radiol (NY). 2019. PMID: 30976827
-
Improved Detection of Small and Low-Density Plaques in Virtual Noncontrast Imaging-based Calcium Scoring at Photon-Counting Detector CT.Radiol Cardiothorac Imaging. 2024 Aug;6(4):e230328. doi: 10.1148/ryct.230328. Radiol Cardiothorac Imaging. 2024. PMID: 39023373 Free PMC article.
-
Segmentation-based quantitative measurements in renal CT imaging using deep learning.Eur Radiol Exp. 2024 Oct 9;8(1):110. doi: 10.1186/s41747-024-00507-4. Eur Radiol Exp. 2024. PMID: 39382755 Free PMC article.
Cited by
-
Automated detection of incidental abdominal aortic aneurysms on computed tomography.Abdom Radiol (NY). 2024 Feb;49(2):642-650. doi: 10.1007/s00261-023-04119-1. Epub 2023 Dec 13. Abdom Radiol (NY). 2024. PMID: 38091064
-
Metabolic Regulation of Inflammation and Its Resolution: Current Status, Clinical Needs, Challenges, and Opportunities.J Immunol. 2021 Dec 1;207(11):2625-2630. doi: 10.4049/jimmunol.2100829. J Immunol. 2021. PMID: 34810268 Free PMC article. Review.
-
Opportunistic assessment of abdominal aortic calcification using artificial intelligence (AI) predicts coronary artery disease and cardiovascular events.Am Heart J. 2025 Oct;288:122-130. doi: 10.1016/j.ahj.2025.04.019. Epub 2025 Apr 24. Am Heart J. 2025. PMID: 40287120
-
Reference distributions of aortic calcification and association with Framingham risk score.Sci Rep. 2023 Jun 9;13(1):9421. doi: 10.1038/s41598-023-36565-8. Sci Rep. 2023. PMID: 37296154 Free PMC article.
-
Validation of a Length-Adjusted Abdominal Arterial Calcium Score Method for Contrast-Enhanced CT Scans.Diagnostics (Basel). 2023 Jun 1;13(11):1934. doi: 10.3390/diagnostics13111934. Diagnostics (Basel). 2023. PMID: 37296786 Free PMC article.
References
-
- Fernandez-Friera L, Penalvo JL, Fernandez-Ortiz A, et al. Prevalence, Vascular Distribution, and Multiterritorial Extent of Subclinical Atherosclerosis in a Middle-Aged Cohort: The PESA (Progression of Early Subclinical Atherosclerosis) Study. Circulation. 2015;131(24):2104–13. - PubMed
-
- O’Connor SD, Graffy PM, Zea R, Pickhardt PJ. Does Nonenhanced CT-based Quantification of Abdominal Aortic Calcification Outperform the Framingham Risk Score in Predicting Cardiovascular Events in Asymptomatic Adults? Radiology. 2019;290(1):108–15. - PubMed
Publication types
MeSH terms
Grants and funding
LinkOut - more resources
Full Text Sources
