

PRAM: a novel pooling approach for discovering intergenic transcripts from large-scale RNA sequencing experiments
- PMID: 32958497
- PMCID: PMC7605252
- DOI: 10.1101/gr.252445.119
PRAM: a novel pooling approach for discovering intergenic transcripts from large-scale RNA sequencing experiments
Abstract
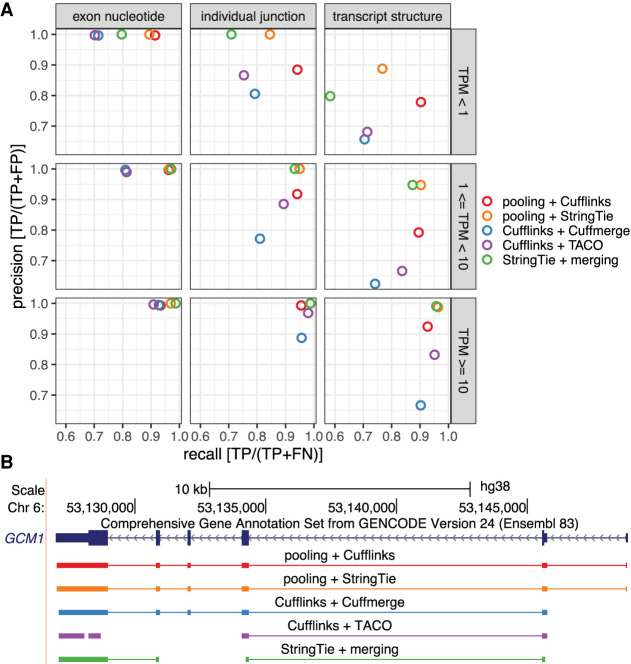
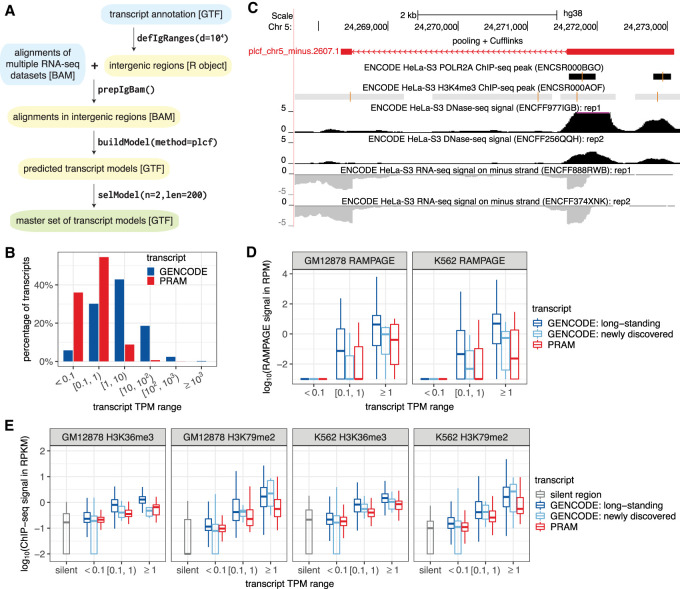
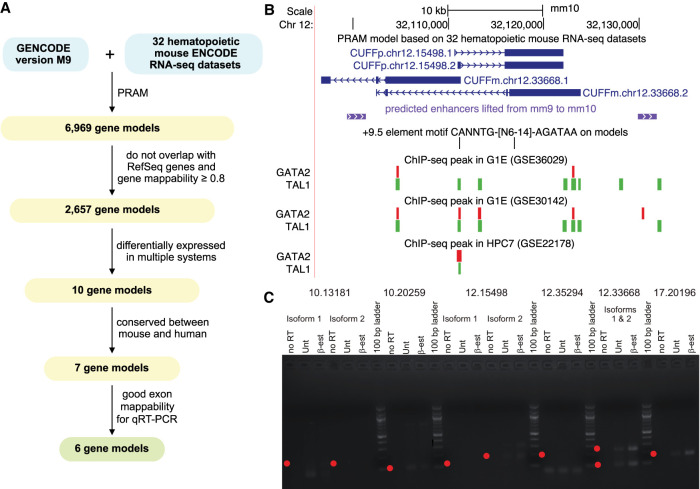
Publicly available RNA-seq data is routinely used for retrospective analysis to elucidate new biology. Novel transcript discovery enabled by joint analysis of large collections of RNA-seq data sets has emerged as one such analysis. Current methods for transcript discovery rely on a '2-Step' approach where the first step encompasses building transcripts from individual data sets, followed by the second step that merges predicted transcripts across data sets. To increase the power of transcript discovery from large collections of RNA-seq data sets, we developed a novel '1-Step' approach named Pooling RNA-seq and Assembling Models (PRAM) that builds transcript models from pooled RNA-seq data sets. We demonstrate in a computational benchmark that 1-Step outperforms 2-Step approaches in predicting overall transcript structures and individual splice junctions, while performing competitively in detecting exonic nucleotides. Applying PRAM to 30 human ENCODE RNA-seq data sets identified unannotated transcripts with epigenetic and RAMPAGE signatures similar to those of recently annotated transcripts. In a case study, we discovered and experimentally validated new transcripts through the application of PRAM to mouse hematopoietic RNA-seq data sets. We uncovered new transcripts that share a differential expression pattern with a neighboring gene Pik3cg implicated in human hematopoietic phenotypes, and we provided evidence for the conservation of this relationship in human. PRAM is implemented as an R/Bioconductor package.
© 2020 Liu et al.; Published by Cold Spring Harbor Laboratory Press.
Figures

Similar articles
-
Read-Split-Run: an improved bioinformatics pipeline for identification of genome-wide non-canonical spliced regions using RNA-Seq data.BMC Genomics. 2016 Aug 22;17 Suppl 7(Suppl 7):503. doi: 10.1186/s12864-016-2896-7. BMC Genomics. 2016. PMID: 27556805 Free PMC article.
-
Terminus enables the discovery of data-driven, robust transcript groups from RNA-seq data.Bioinformatics. 2020 Jul 1;36(Suppl_1):i102-i110. doi: 10.1093/bioinformatics/btaa448. Bioinformatics. 2020. PMID: 32657377 Free PMC article.
-
ChimPipe: accurate detection of fusion genes and transcription-induced chimeras from RNA-seq data.BMC Genomics. 2017 Jan 3;18(1):7. doi: 10.1186/s12864-016-3404-9. BMC Genomics. 2017. PMID: 28049418 Free PMC article.
-
Multiplexed primer extension sequencing: A targeted RNA-seq method that enables high-precision quantitation of mRNA splicing isoforms and rare pre-mRNA splicing intermediates.Methods. 2020 Apr 1;176:34-45. doi: 10.1016/j.ymeth.2019.05.013. Epub 2019 May 21. Methods. 2020. PMID: 31121301 Free PMC article. Review.
-
Mapping RNA-seq Reads with STAR.Curr Protoc Bioinformatics. 2015 Sep 3;51:11.14.1-11.14.19. doi: 10.1002/0471250953.bi1114s51. Curr Protoc Bioinformatics. 2015. PMID: 26334920 Free PMC article. Review.
Cited by
-
Transcriptomic and metabolomic analyses to study the key role by which Ralstonia insidiosa induces Listeria monocytogenes to form suspended aggregates.Front Microbiol. 2023 Oct 12;14:1260909. doi: 10.3389/fmicb.2023.1260909. eCollection 2023. Front Microbiol. 2023. PMID: 37901811 Free PMC article.
-
Graph pangenome captures missing heritability and empowers tomato breeding.Nature. 2022 Jun;606(7914):527-534. doi: 10.1038/s41586-022-04808-9. Epub 2022 Jun 8. Nature. 2022. PMID: 35676474 Free PMC article.
References
Publication types
MeSH terms
Substances
Grants and funding
LinkOut - more resources
Full Text Sources