. 2020 Oct 29;223(Pt 20):jeb232702.
doi: 10.1242/jeb.232702.

Differential tissue stiffness of body column facilitates locomotion of Hydra on solid substrates

Affiliations

Differential tissue stiffness of body column facilitates locomotion of Hydra on solid substrates

Suyash Naik et al. J Exp Biol. .

Abstract

The bell-shaped members of the Cnidaria typically move around by swimming, whereas the Hydra polyp can perform locomotion on solid substrates in an aquatic environment. To address the biomechanics of locomotion on rigid substrates, we studied the 'somersaulting' locomotion in Hydra We applied atomic force microscopy to measure the local mechanical properties of Hydra's body column and identified the existence of differential Young's modulus between the shoulder region versus rest of the body column at 3:1 ratio. We show that somersaulting primarily depends on differential tissue stiffness of the body column and is explained by computational models that accurately recapitulate the mechanics involved in this process. We demonstrate that perturbation of the observed stiffness variation in the body column by modulating the extracellular matrix polymerization impairs the 'somersault' movement. These results provide a mechanistic basis for the evolutionary significance of differential extracellular matrix properties and tissue stiffness.

Keywords: Atomic force microscopy; Biomechanics; Extracellular matrix; Tissue rheology.


Conflict of interest statement

Competing interestsThe authors declare no competing or financial interests.

Figures

Fig. 1
Fig. 1. The Hydra somersault.
The stages of the Hydra somersault movement. In stage 1, the body column is stretched, and the tentacles hold on to the substrate. In stage 2, the basal end is released. In stage 3, the body column contracts. In stages 4 and 5, the body column is lifted.
Fig. 2
Fig. 2. Spatially resolved measurement of Young’s modulus by force spectroscopy.
(A) Schematic diagram of Young’s modulus measurements along the Hydra body column. The Hydra was attached to a glass coverslip using BSA and glutaraldehyde, and measurements were recorded along the body column over grids separated by 100 μm. Each grid was 25 μm×25 μm with 25 force curves. The inset shows the image of a bead attached to a cantilever. (B) A typical force-distance curve used to fit the Hertz model to determine Young’s modulus of a microcontact. The experimental data are shown as red dots, whereas the fit is depicted as a continuous black line. (C) The plot of variation in Young’s modulus along the body column using atomic force microscopy (AFM). The distance from the tentacle end is plotted in units of percentage of total length, with 0% near the tentacles and 100% at the base. Force curves were taken at locations separated by 100 μm along the body column for three different polyps. The ribbon indicates the standard deviation of the mean over 25 measurements at each location. The inset is a schematic representation of variations in Young’s modulus (Y) in different regions of Hydra. The top quarter of the body column is 3 times stiffer than the rest. See also Table S1.
Fig. 3
Fig. 3. Role of differential tissue stiffness in biomechanics of the Hydra somersault.
(A) The stiffer shoulder region is depicted as a hypothetical spring. The Hydra and the deformations in this spring are shown as somersaults to reach the upside-down position. (B) The forces acting on the Hydra body column during the somersault. FB represents the force of buoyancy in water acting against the gravitational force on the organism Fg. F D is the drag force acting against the direction of motion. F bend is the representation of the force acting on the head region due to energy stored in the bend. The changes in force as the Hydra goes from stage 1/2 (dotted outline) to stage 4 (dotted outline)/5 can be seen. (C) A schematic illustration of the calculation of energy stored in the bent shoulder (U; U=YIL/2R2, where I is the second moment of inertia). The shoulder region of the Hydra was fitted to a circle to measure the radius of curvature (R) of the bend. The length (L) is 25% of the total length (the stiff region), and Y is the measured Young’s modulus. (D) The progression of energy in the bend (E bend) with time after release (t=0). E bend first increases to a peak and then exponentially decays as the bend straightens to bring the body to an upside-down position. The continuous line represents the fit to a single exponent (τ≈0.4 s, n=1). See also Table S2.
Fig. 4
Fig. 4. Computer simulations can reproduce the somersault.
(A) Modeling of the Hydra body column to represent various steps involved in the somersault movement. (i) An elastic cylinder comprising beads–springs was used to model the Hydra body column. The cylinder is a stack of 50 rings, each consisting of 10 beads of mass m. (ii–vi) Beads within the same ring and from adjacent rings are connected to each other with springs to maintain the circular cross-section (ii)and resist bending (iii), stretching (iv), torsion (v) and shear (vi). The effective spring constant k eff of a quarter of the body length (shoulder) is kept at α times the rest. (B) Comparison of various experimentally recorded stages of the Hydra somersault with simulations. The simulations were performed by incorporating the experimentally observed variation in tissue stiffness. There are striking similarities between both the actual Hydra movement and its simulations.
Fig. 5
Fig. 5. Computer simulations unravel the significance of the differential in tissue stiffness for the somersault.
(A) Plot of the energy in the shoulder region E shoulder versus time after the end of a contraction for strain ε=0.8. E threshold is the calculated minimum energy required to overcome gravity and viscous drag. At the end of a contraction, E shoulder is higher than E threshold for α=3 (stiffness differential seen in AFM experiments) and less than E threshold for α=1 (uniform stiffness). The simulation snapshots of the cylinder show its initial and final positions for α=1 and α=3. (B) The plot of time-averaged longitudinal force on the 14th ring, which is at the junction of the stiff shoulder and rest of the body column, with respect to α after the release. The force on this ring peaks at an intermediate value of α and does not increase monotonically. This indicates that arbitrarily large values of α do not facilitate the optimal energy transfer. The inset shows force versus time for α=3 and α=1 before the contraction is complete at ~50-100 ms. Initially, the force is nearly the same in the two cases, but it becomes roughly double for α=3 at later times. (C) Phase diagram to describe the importance of tissue stiffness variation along the body column to overcome downward force on it due to a higher density of Hydra tissue compared with water. The region represented by crosses is the range of parameters for which model Hydra is unable to stand inverted after the release, and open circles represent the range for which it is able to stand inverted. The experimentally measured parameters of Hydra lie in the green rectangle in the phase space. The width and height of the rectangle represent experimental errors involved in estimating α and the mass density of Hydra, respectively. The initial strain ε is 0.8. (D) Phase diagram of the change in density (Δρ) and α with a Young’s modulus that is half of experimentally observed value. The uniform stiffness (α=1) enables Hydra to lift the body column having a density difference of only 1% compared with water. The blue square denotes the lower bound of density of real Hydra tissue and α=3. The plot underscores the importance of variation in stiffness even if it is overestimated in AFM measurements as a result of glutaraldehyde treatment. See also Table S3.
Fig. 6
Fig. 6. The stiffness differential in the body column is essential for locomotion through the somersault.
(A) The extracellular matrix was perturbed locally in Hydra polyps using a partial cut (nick), to abolish the stiffness differential. The graph shows the average number of somersault events per Hydra with nicks at the shoulder or the body column. The measurements were recorded 6 h after the manipulation. (B) The extracellular matrix was perturbed globally using the chemical disruption of collagens by treatment with 10 mmol l−1 dipyridyl. The average number of somersault events per Hydra was reduced upon treatment with dipyridyl for 36 h, and no events were observed after treatment with dipyridyl for 72 h. (C) The stiffness differential was perturbed by disrupting the extracellular matrix with a combination of dipyridyl treatment and a partial nick. As shown in the graph, this led to a reduction in the average number of somersault events observed compared with that for animals not treated with dipyridyl. In both cases, measurements were performed 36 h after treatment. For all the graphs, the error bars represent s.e.m., and the significance values are calculated using two-tailed Student’s t-test (*P<0.05, **P<0.005; n=20 polyps per experiment, n=3 experiments). See also Table S4.
Fig. 7
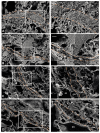
Fig. 7. Scanning electron micrographs (SEM) of Hydra mesoglea showing changes in the extracellular matrix between the shoulder region and body column following dipyridyl treatment.
(A,B) Control, (C,D) dipyridyl-treated polyps. (A) SEM of mesoglea (dash–dot orange line) from the shoulder region of the control polyp in transverse section (TS) showing dense collagen fibers. (B) SEM image of mesoglea (dash–dot orange line) from the body column region of the control polyp in TS showing less dense collagen fibers. (C) SEM image of mesoglea (dash–dot orange line) from the shoulder region of the polyp after dipyridyl treatment for 72 h in TS, showing loosely packed collagen fibers as a result of inhibition of collagen crosslinking. (D) SEM image of mesoglea (dash-dot orange line) from the body column region of the polyp after dipyridyl treatment for 72 h in TS, showing loosely packed collagen fibers as a result of inhibition of collagen crosslinking. For A–D, a higher magnification image of the boxed region is shown on the right. Scale bars: 1 μm. ec, ectoderm; en, endoderm; me, mesoglea.

Similar articles

Cited by

References

    1. Akhtar R, Sherratt MJ, Cruickshank JK, Derby B. Characterizing the elastic properties of tissues. Mater Today. 2011;14:96–105. doi: 10.1016/S1369-7021(11)70059-1. - DOI - PMC - PubMed
    1. Alexander RM. Principles of Animal Locomotion. Princeton University Press; 2003.
    1. Anderson EJ, Demont ME. The mechanics of locomotion in the squid Loligo pealei: locomotory function and unsteady hydrodynamics of the jet and intramantle pressure. J Exp Biol. 2000;203:2851–2863. - PubMed
    1. Aufschnaiter R, Zamir EA, Little CD, Özbek S, Münder S, David CN, Li L, Sarras MP, Zhang X. In vivo imaging of basement membrane movement: ECM patterning shapes Hydra polyps. J Cell Sci. 2011;124:4027–4038. doi: 10.1242/jcs.087239. - DOI - PMC - PubMed
    1. Aufschnaiter R, Wedlich-Söldner R, Zhang X, Hobmayer B. Apical and basal epitheliomuscular F-actin dynamics during Hydra bud evagination. Biol Open. 2017;6:1137–1148. doi: 10.1242/bio.022723. - DOI - PMC - PubMed

Publication types