. 2020 Oct 7;40(41):7837-7854.
doi: 10.1523/JNEUROSCI.2487-19.2020. Epub 2020 Sep 21.

A Neural Circuit from Thalamic Paraventricular Nucleus to Central Amygdala for the Facilitation of Neuropathic Pain

Affiliations

A Neural Circuit from Thalamic Paraventricular Nucleus to Central Amygdala for the Facilitation of Neuropathic Pain

Shao-Hua Liang et al. J Neurosci. .

Abstract

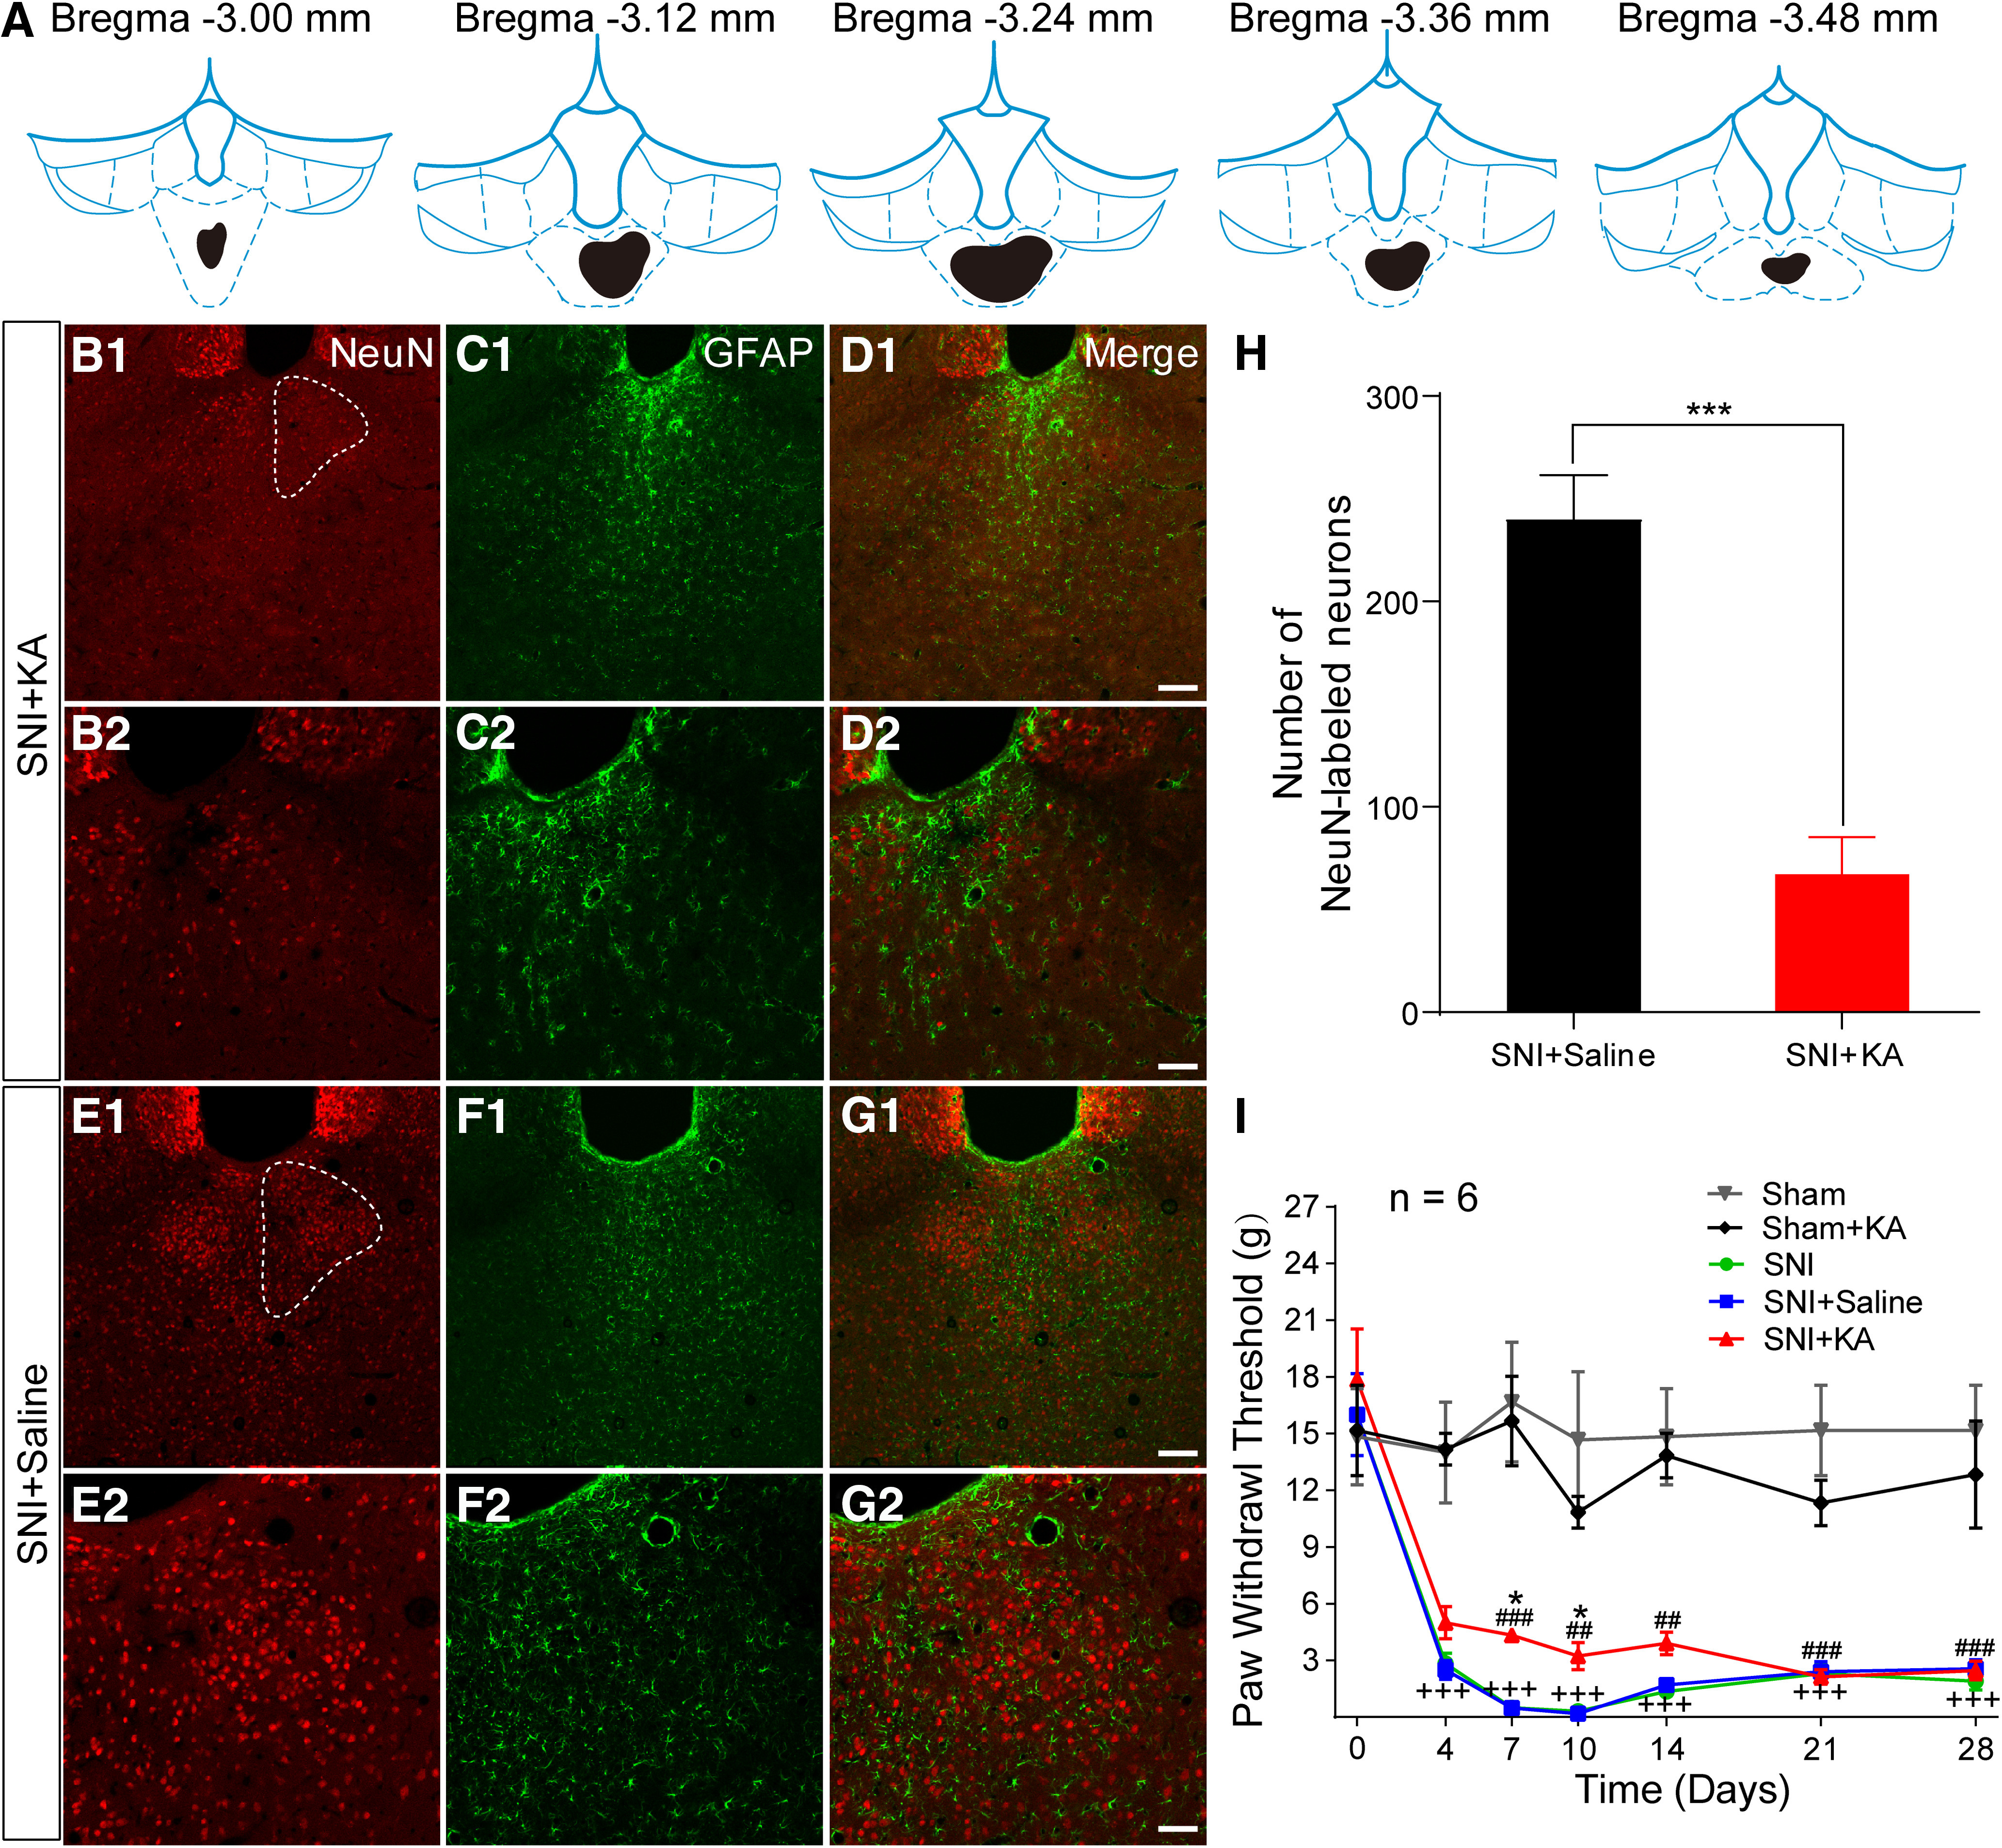
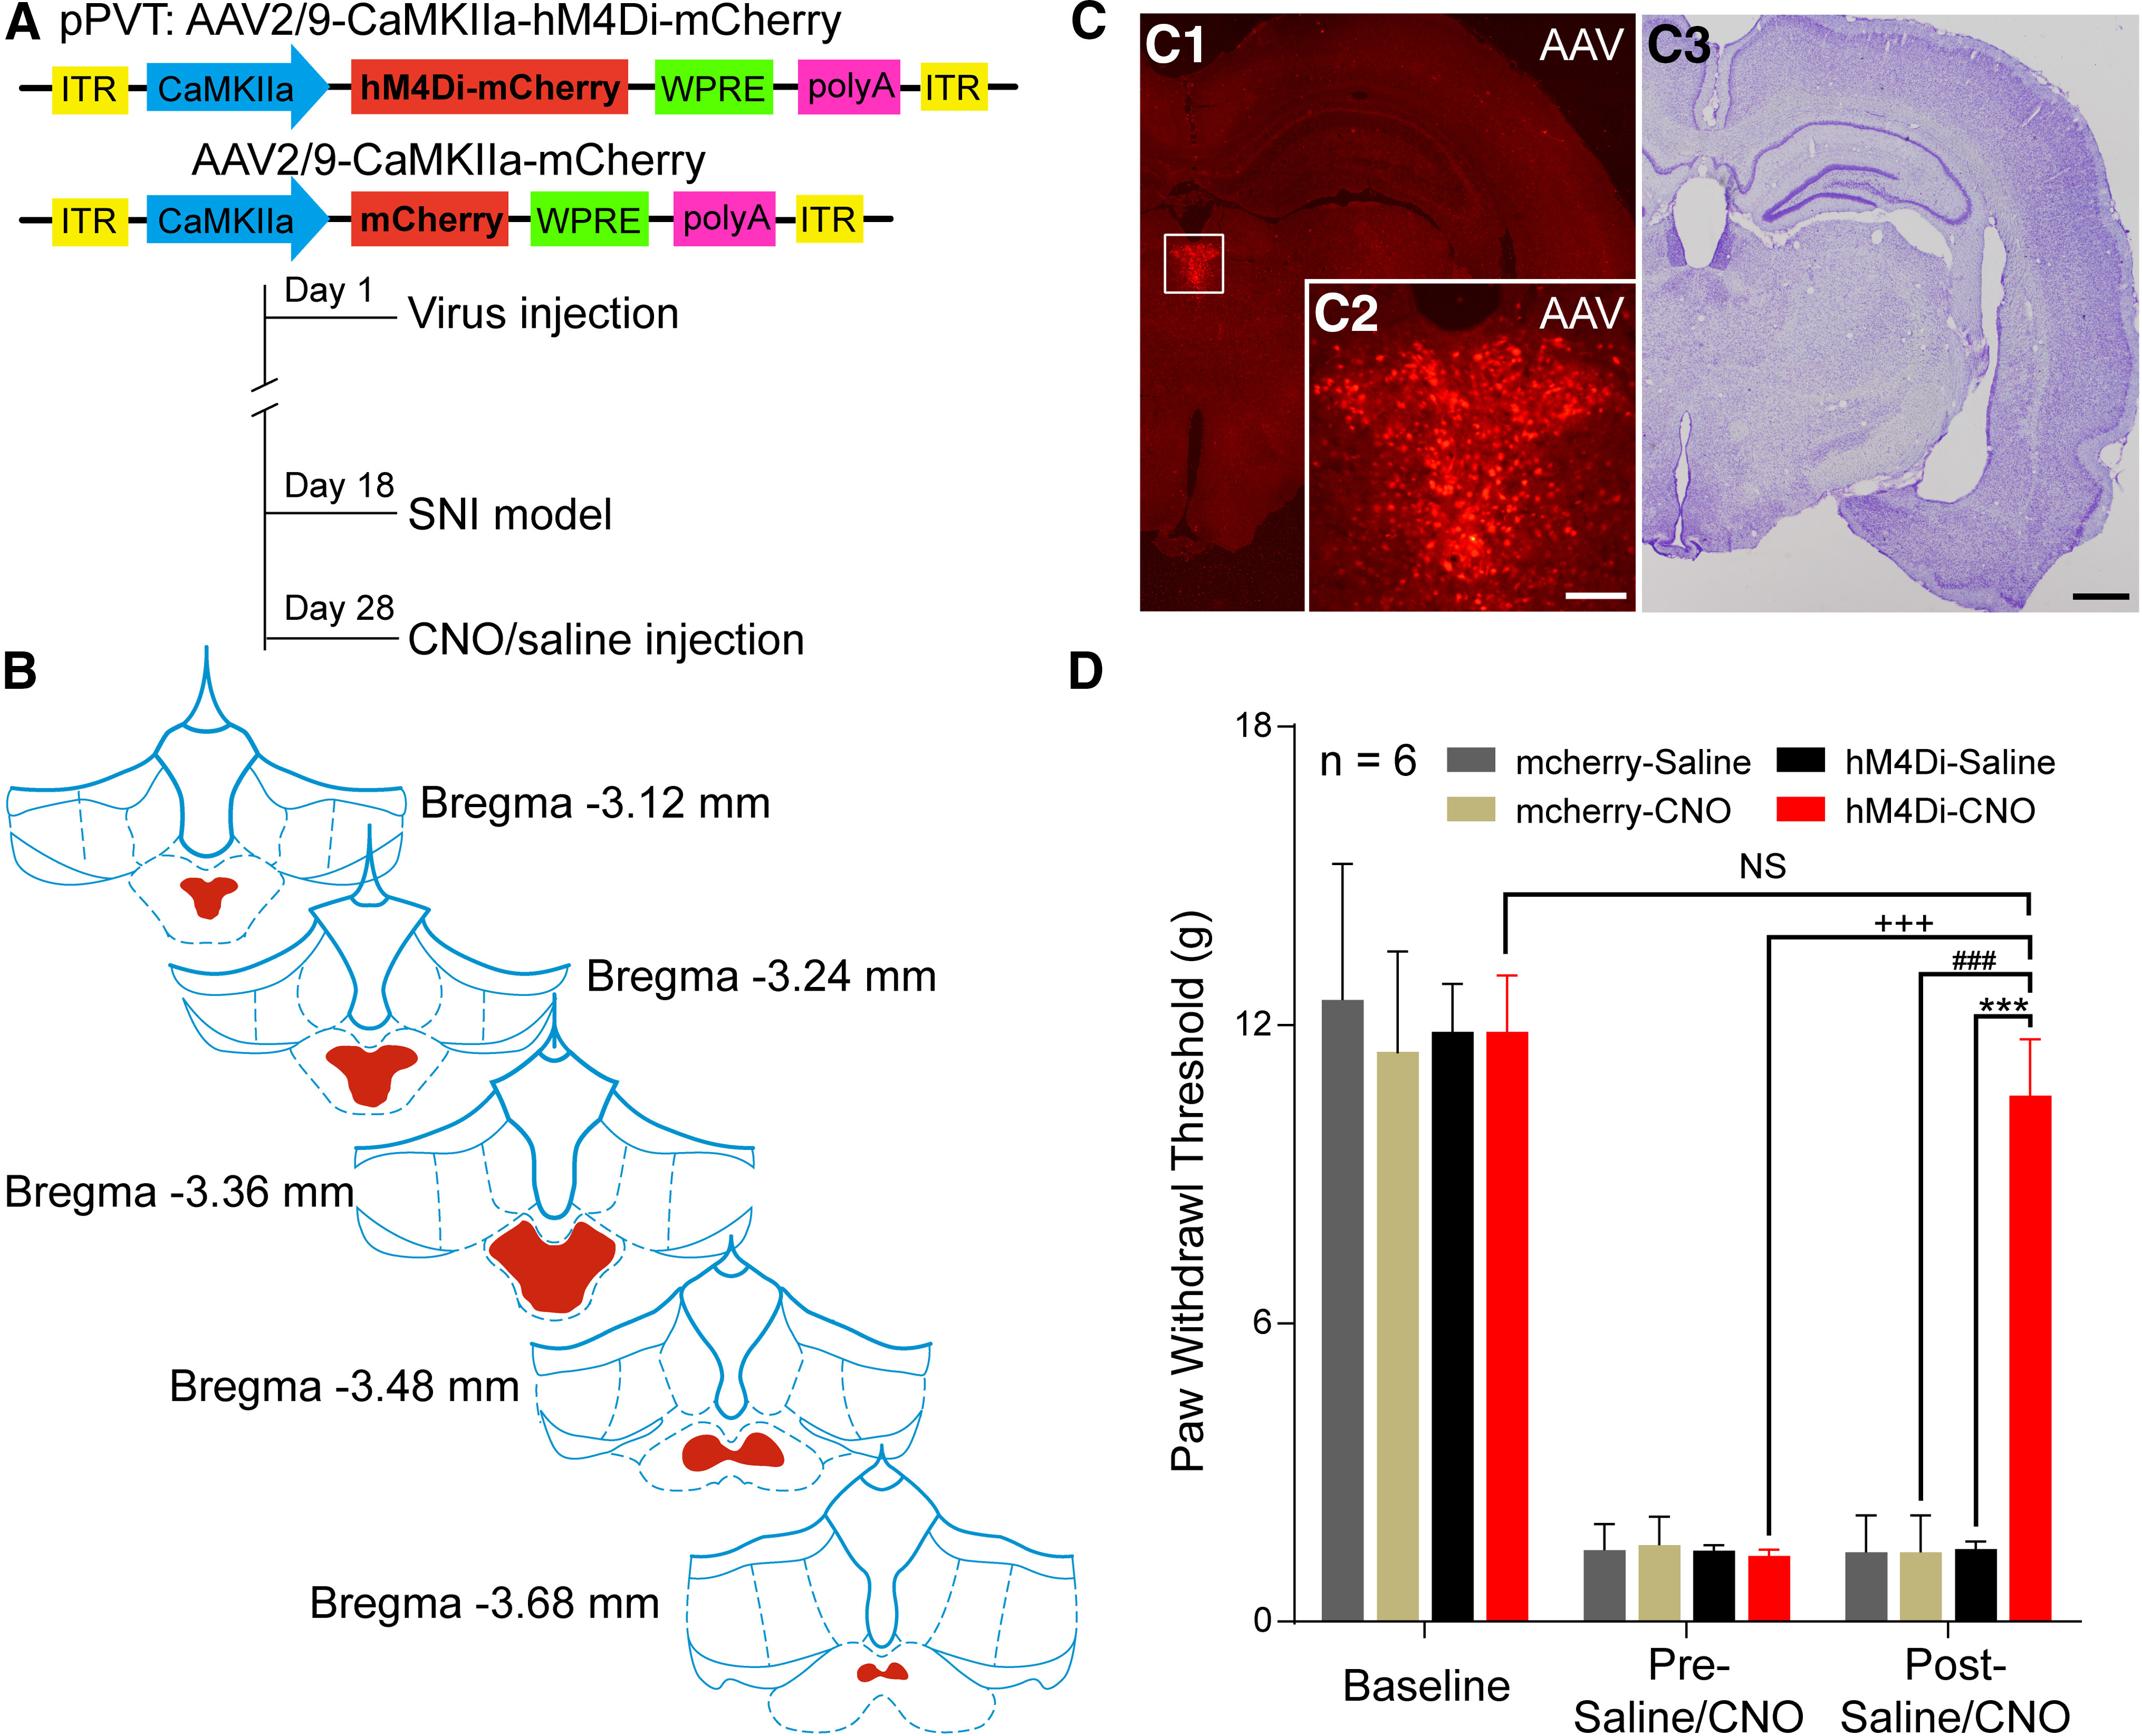
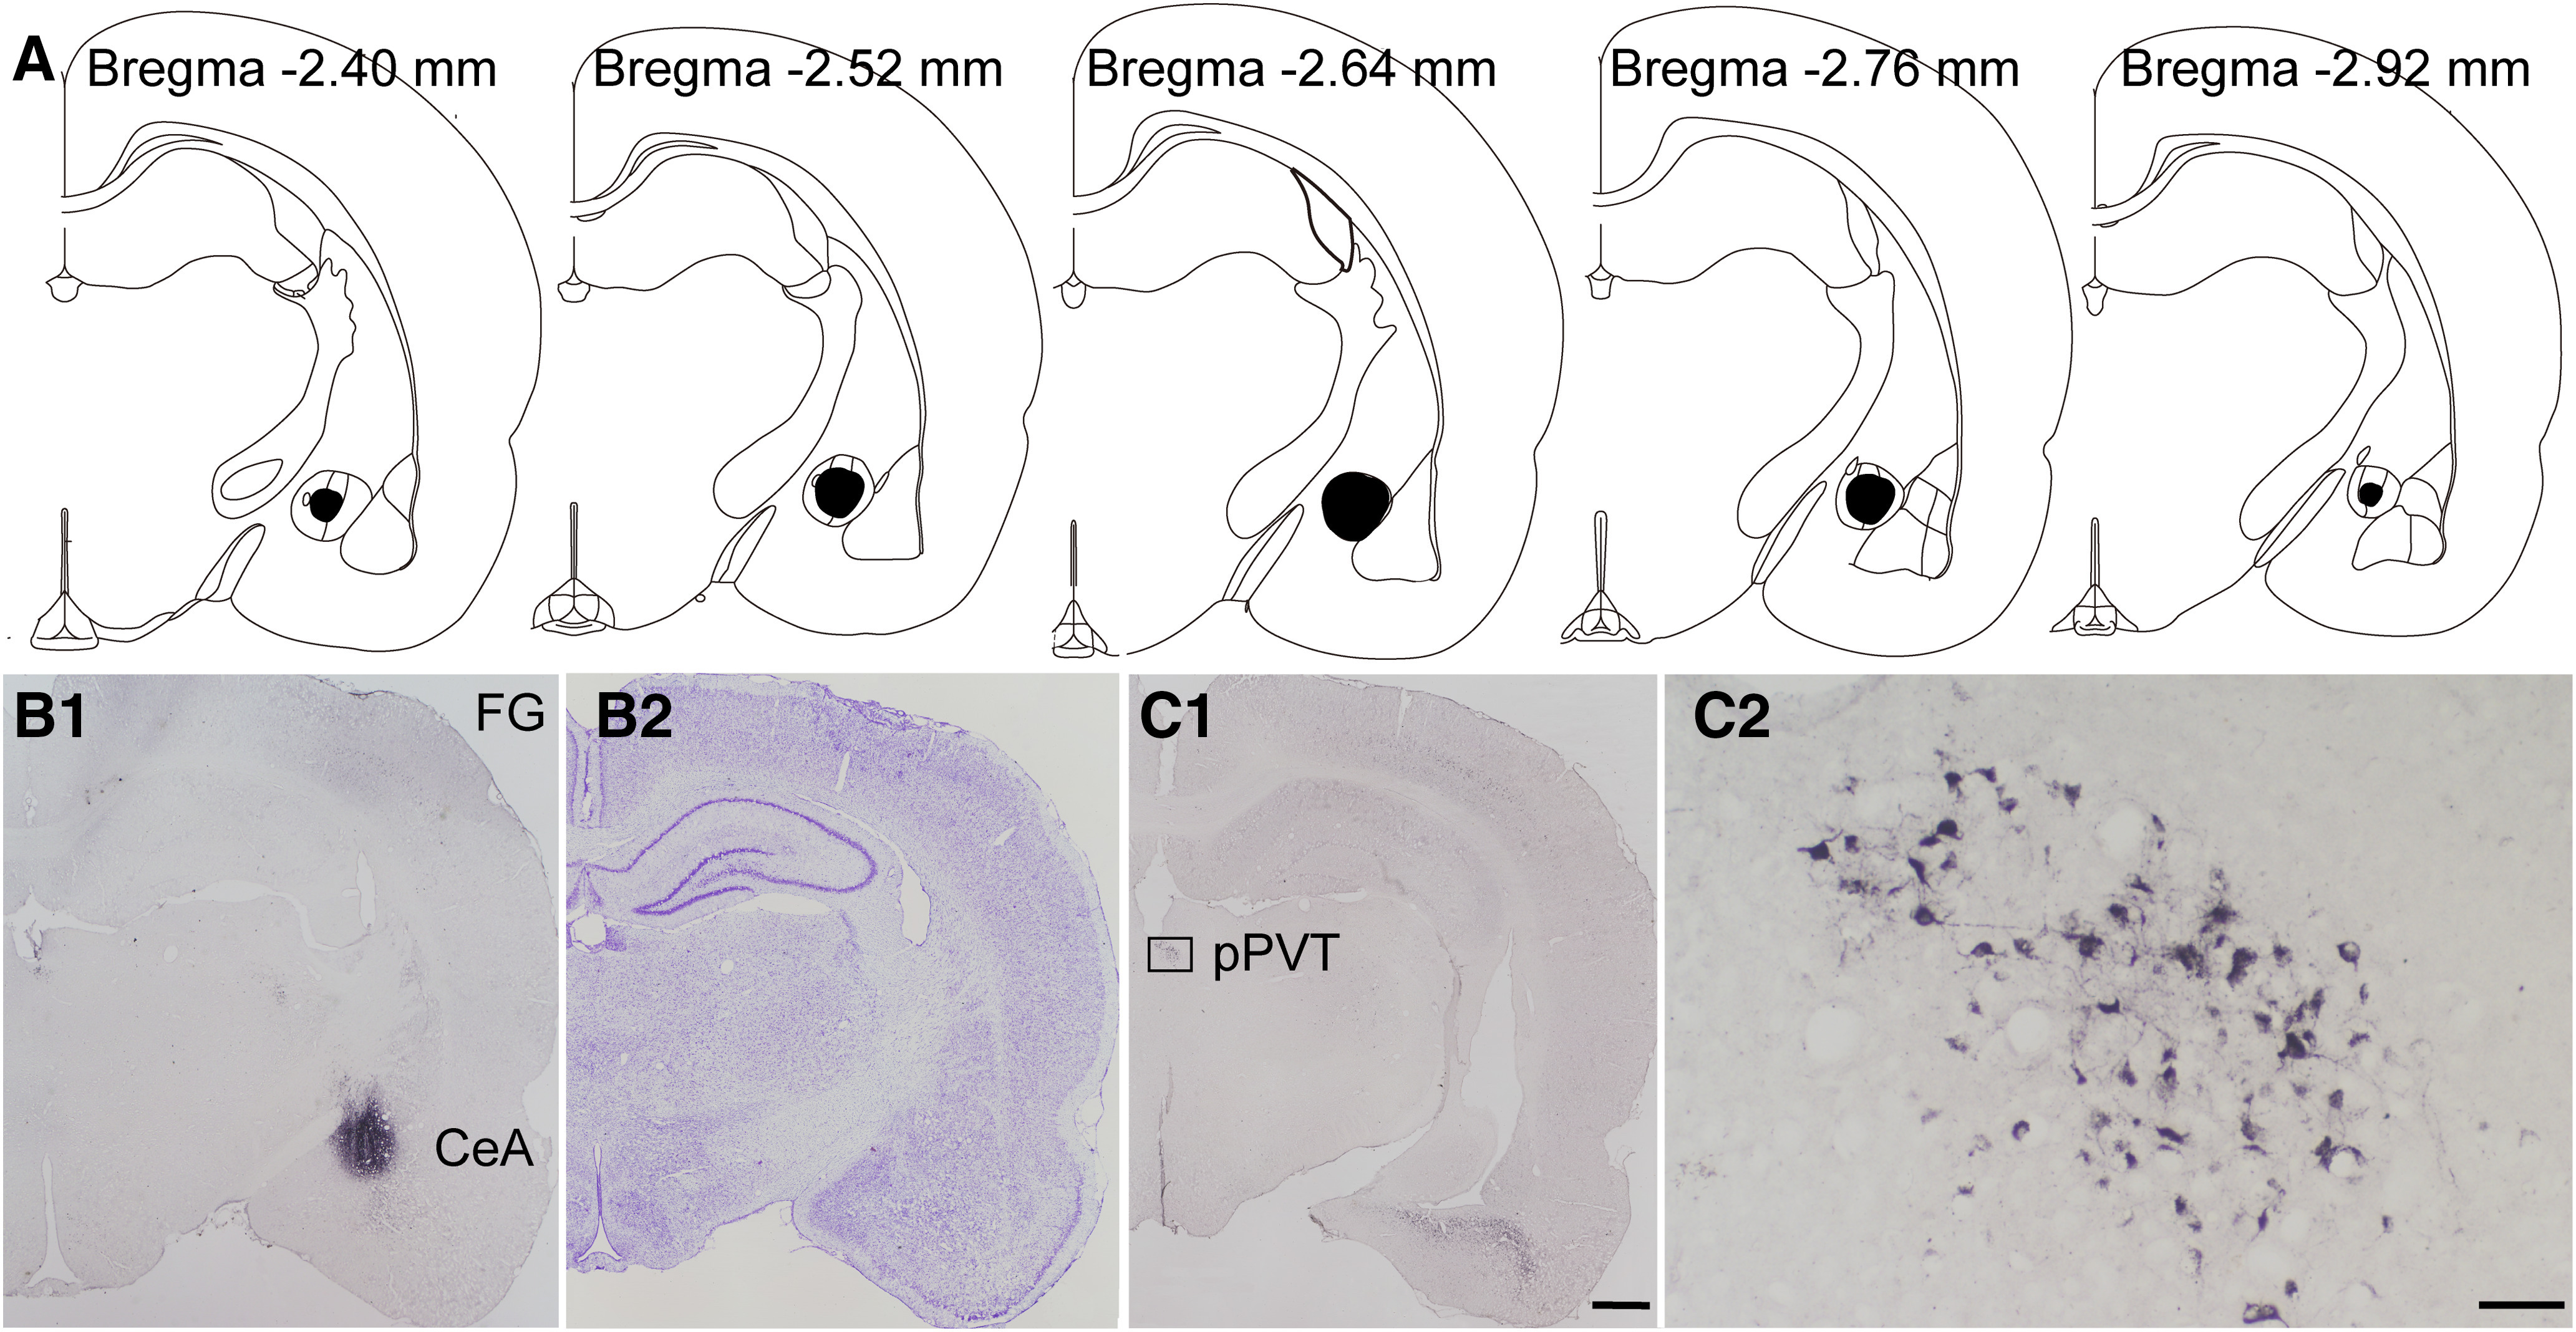
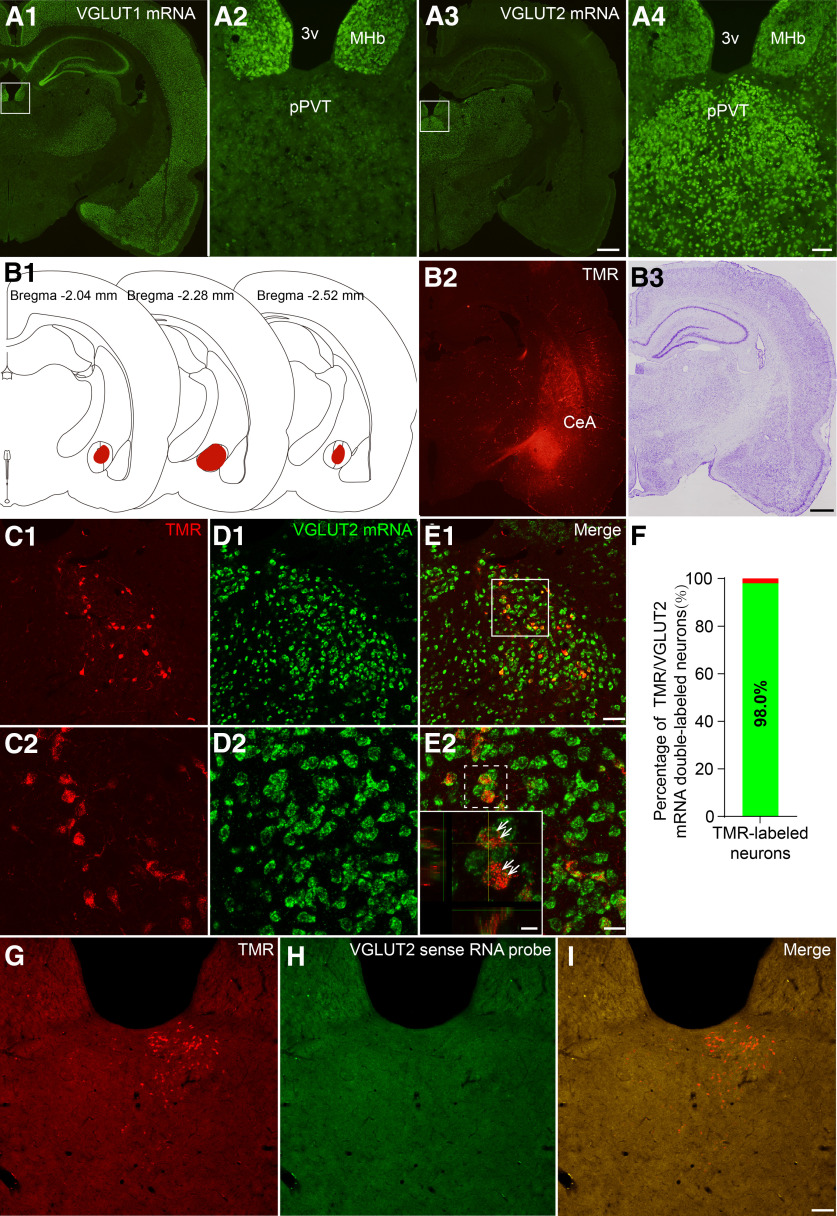
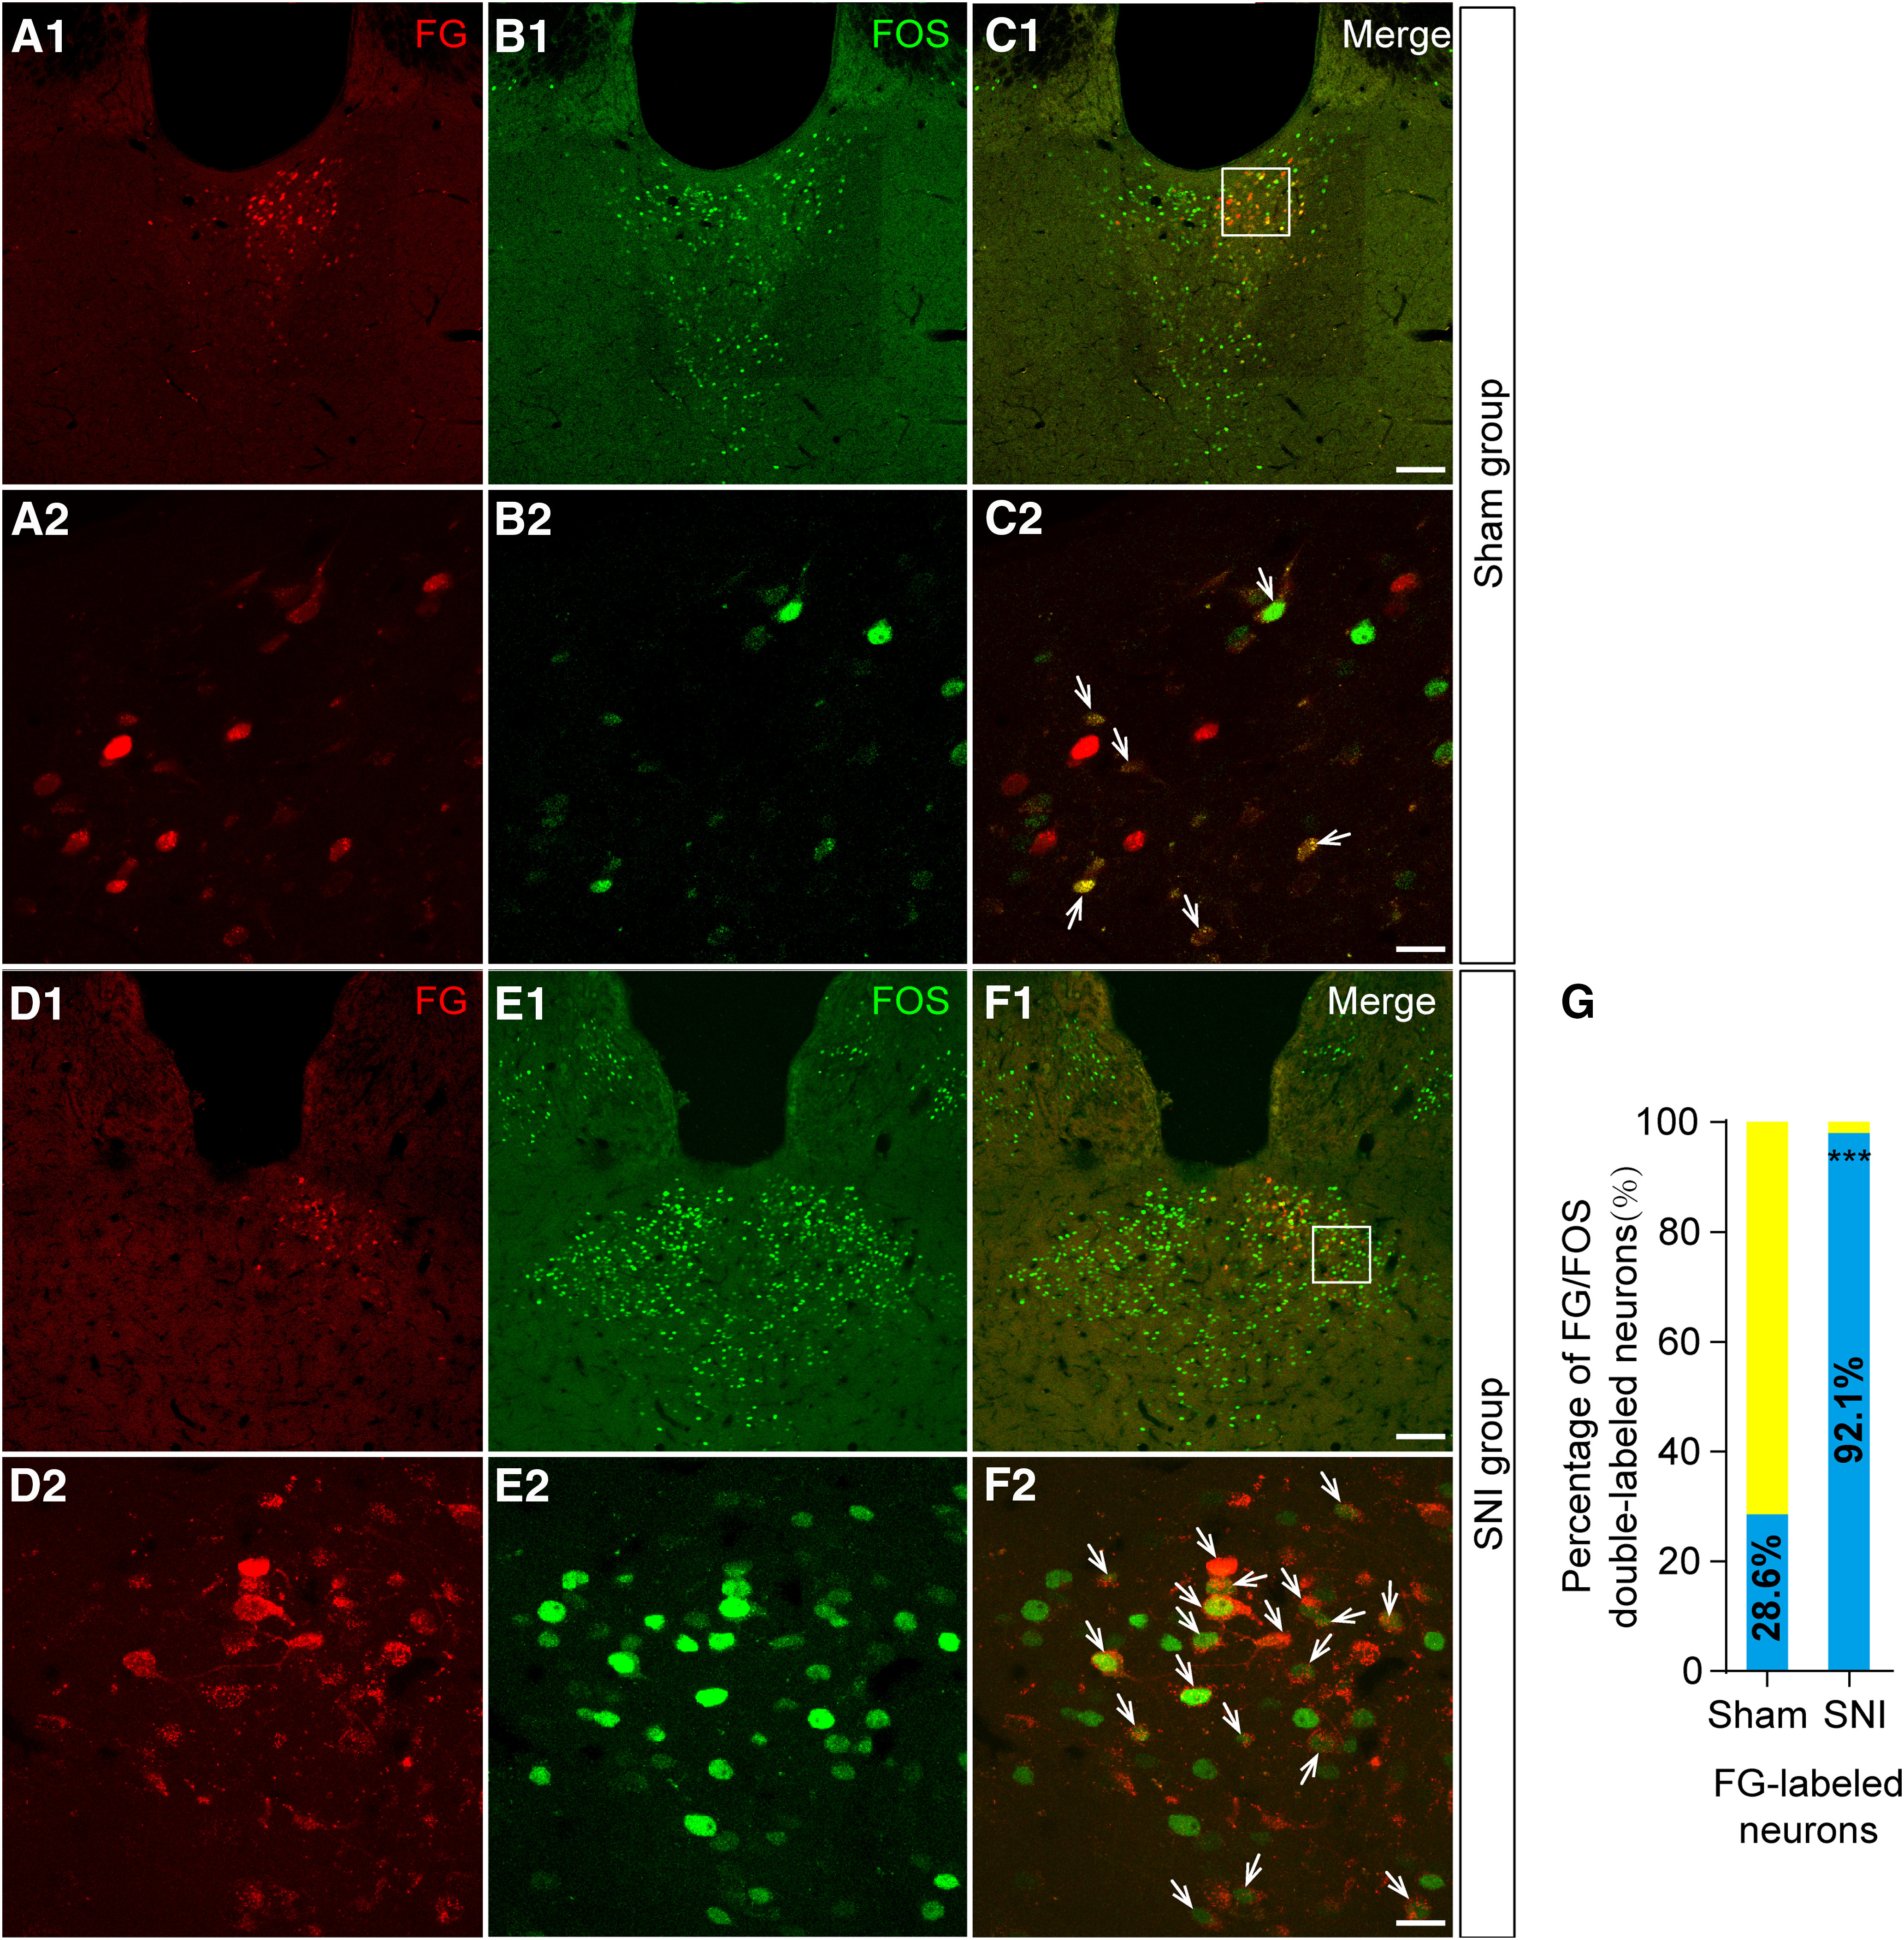
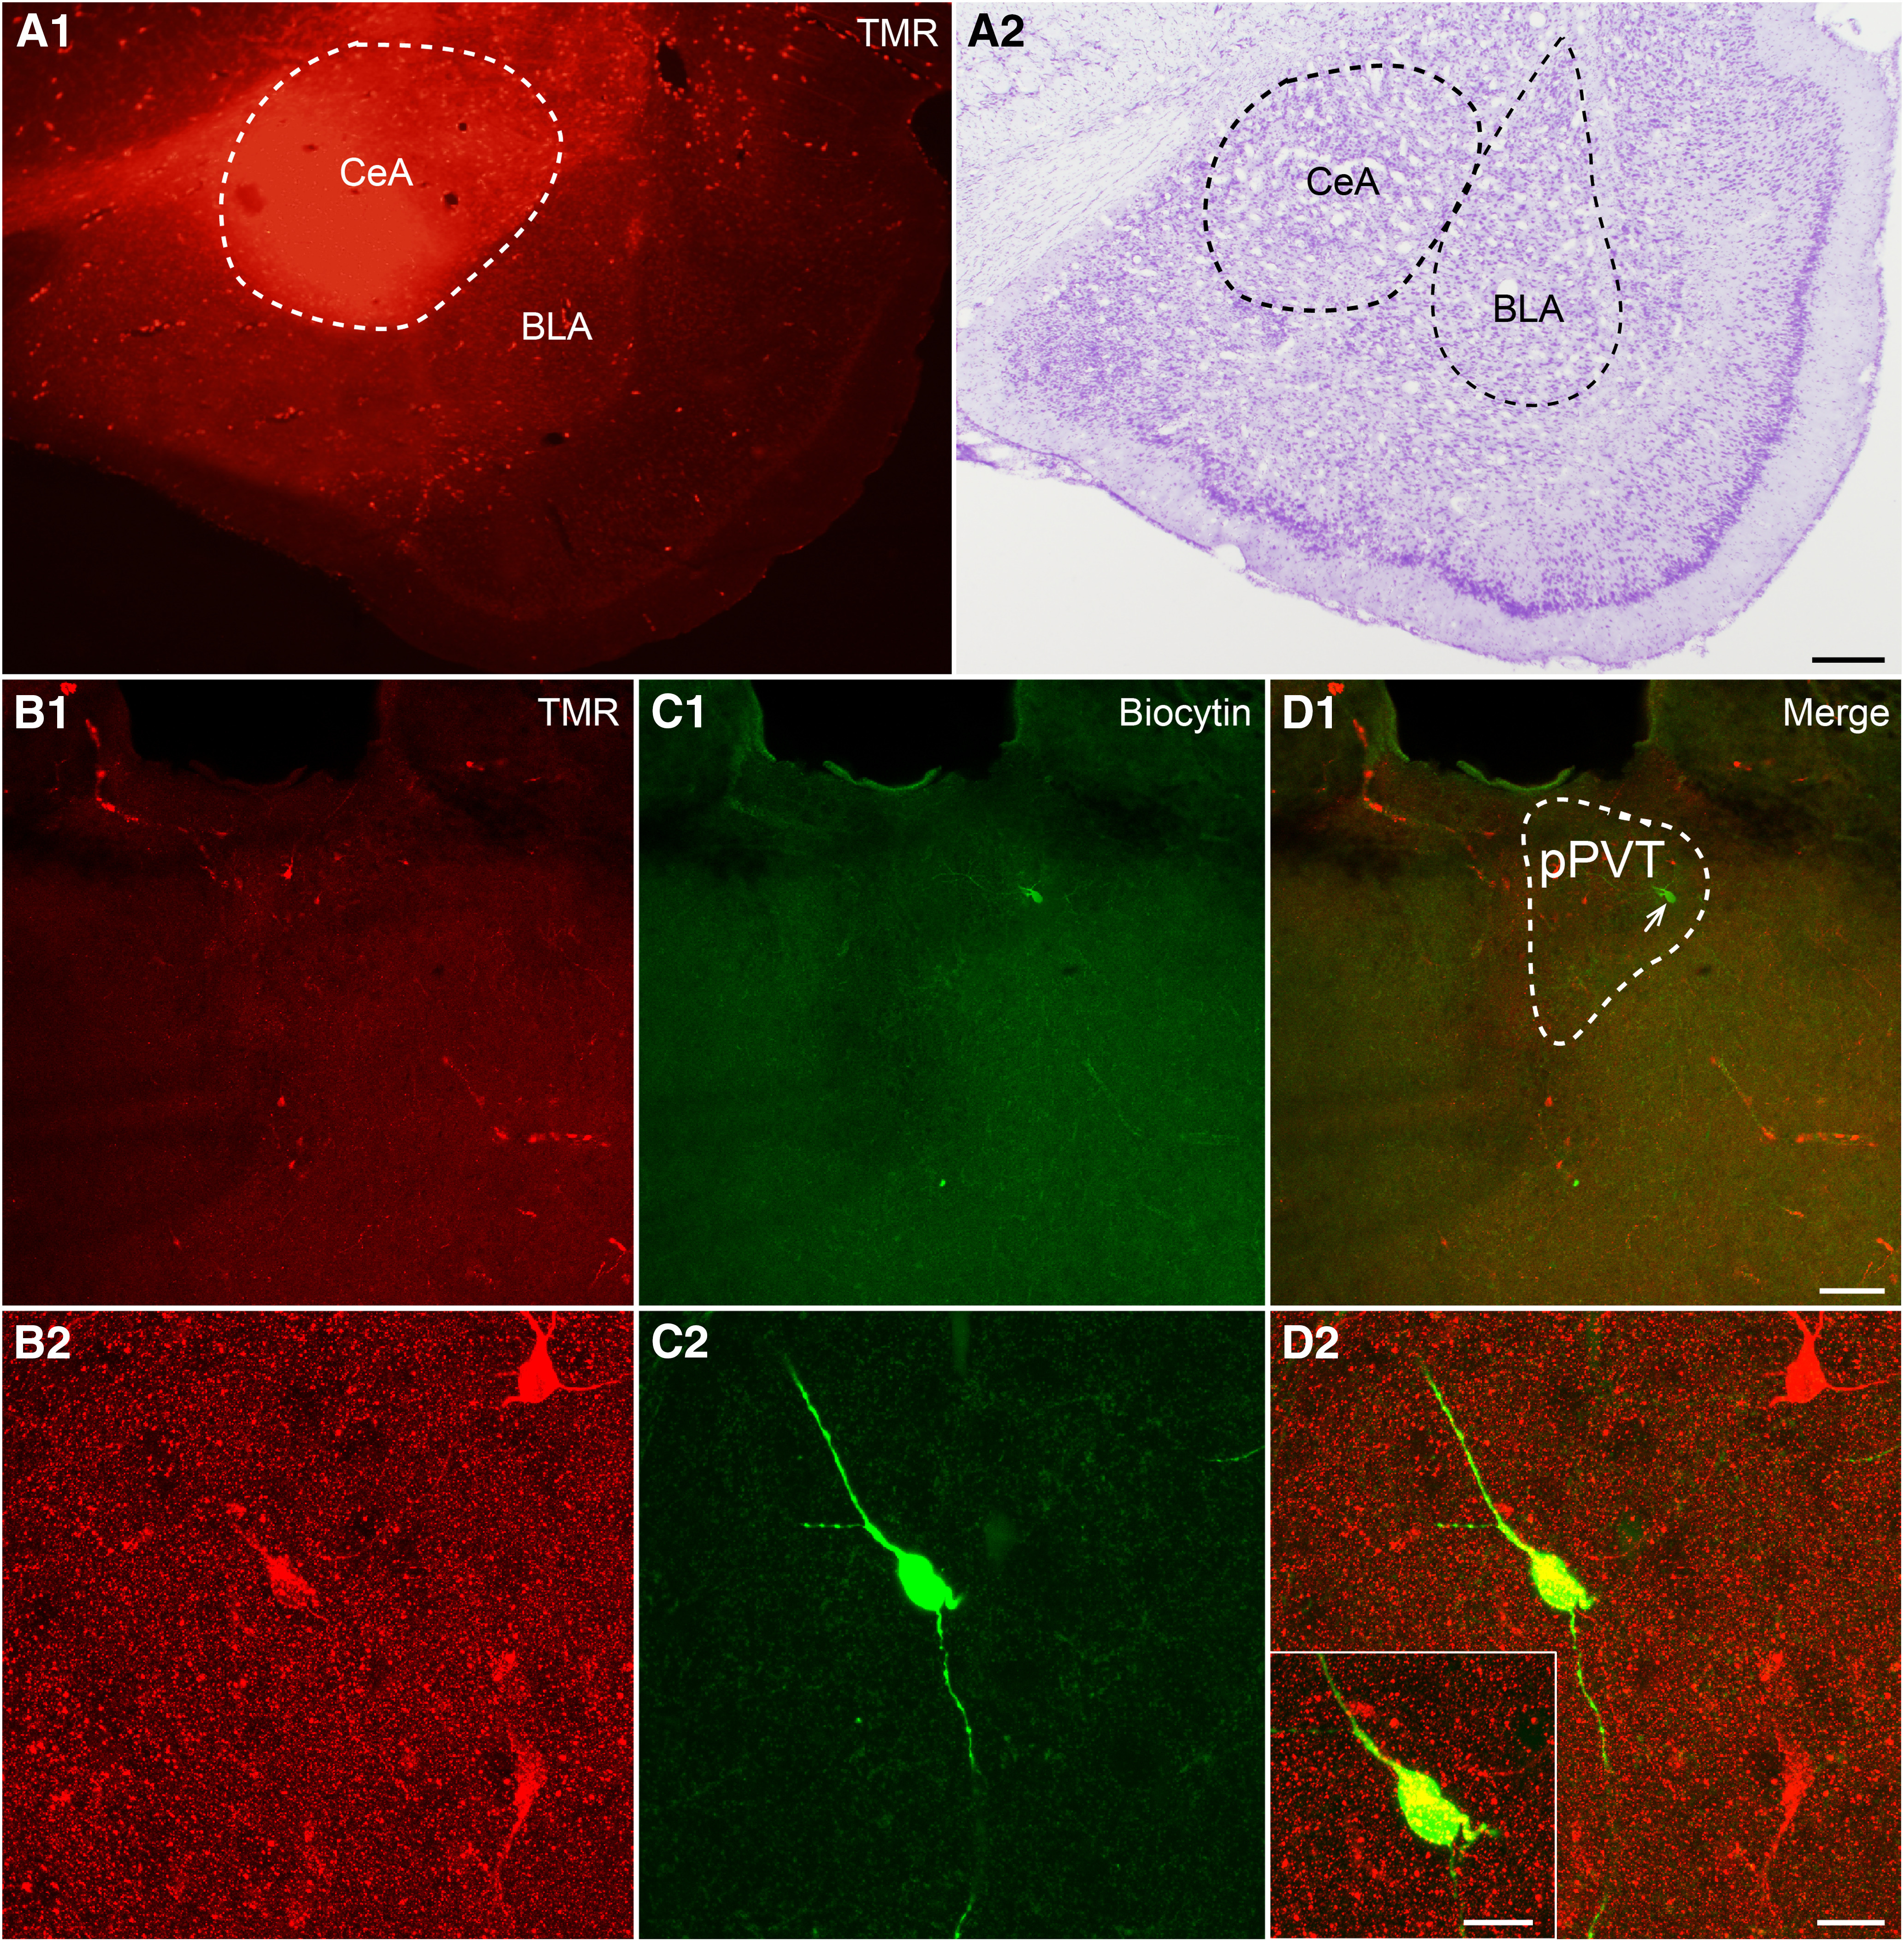
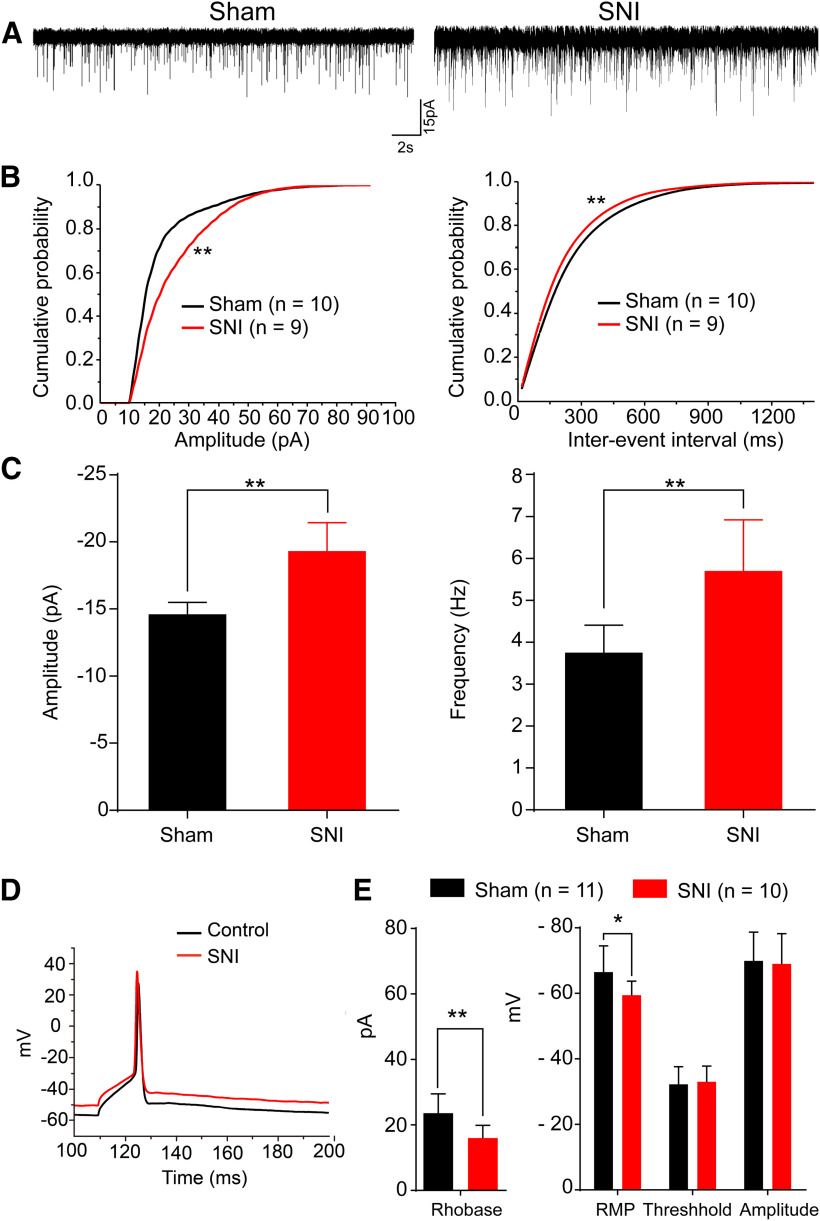
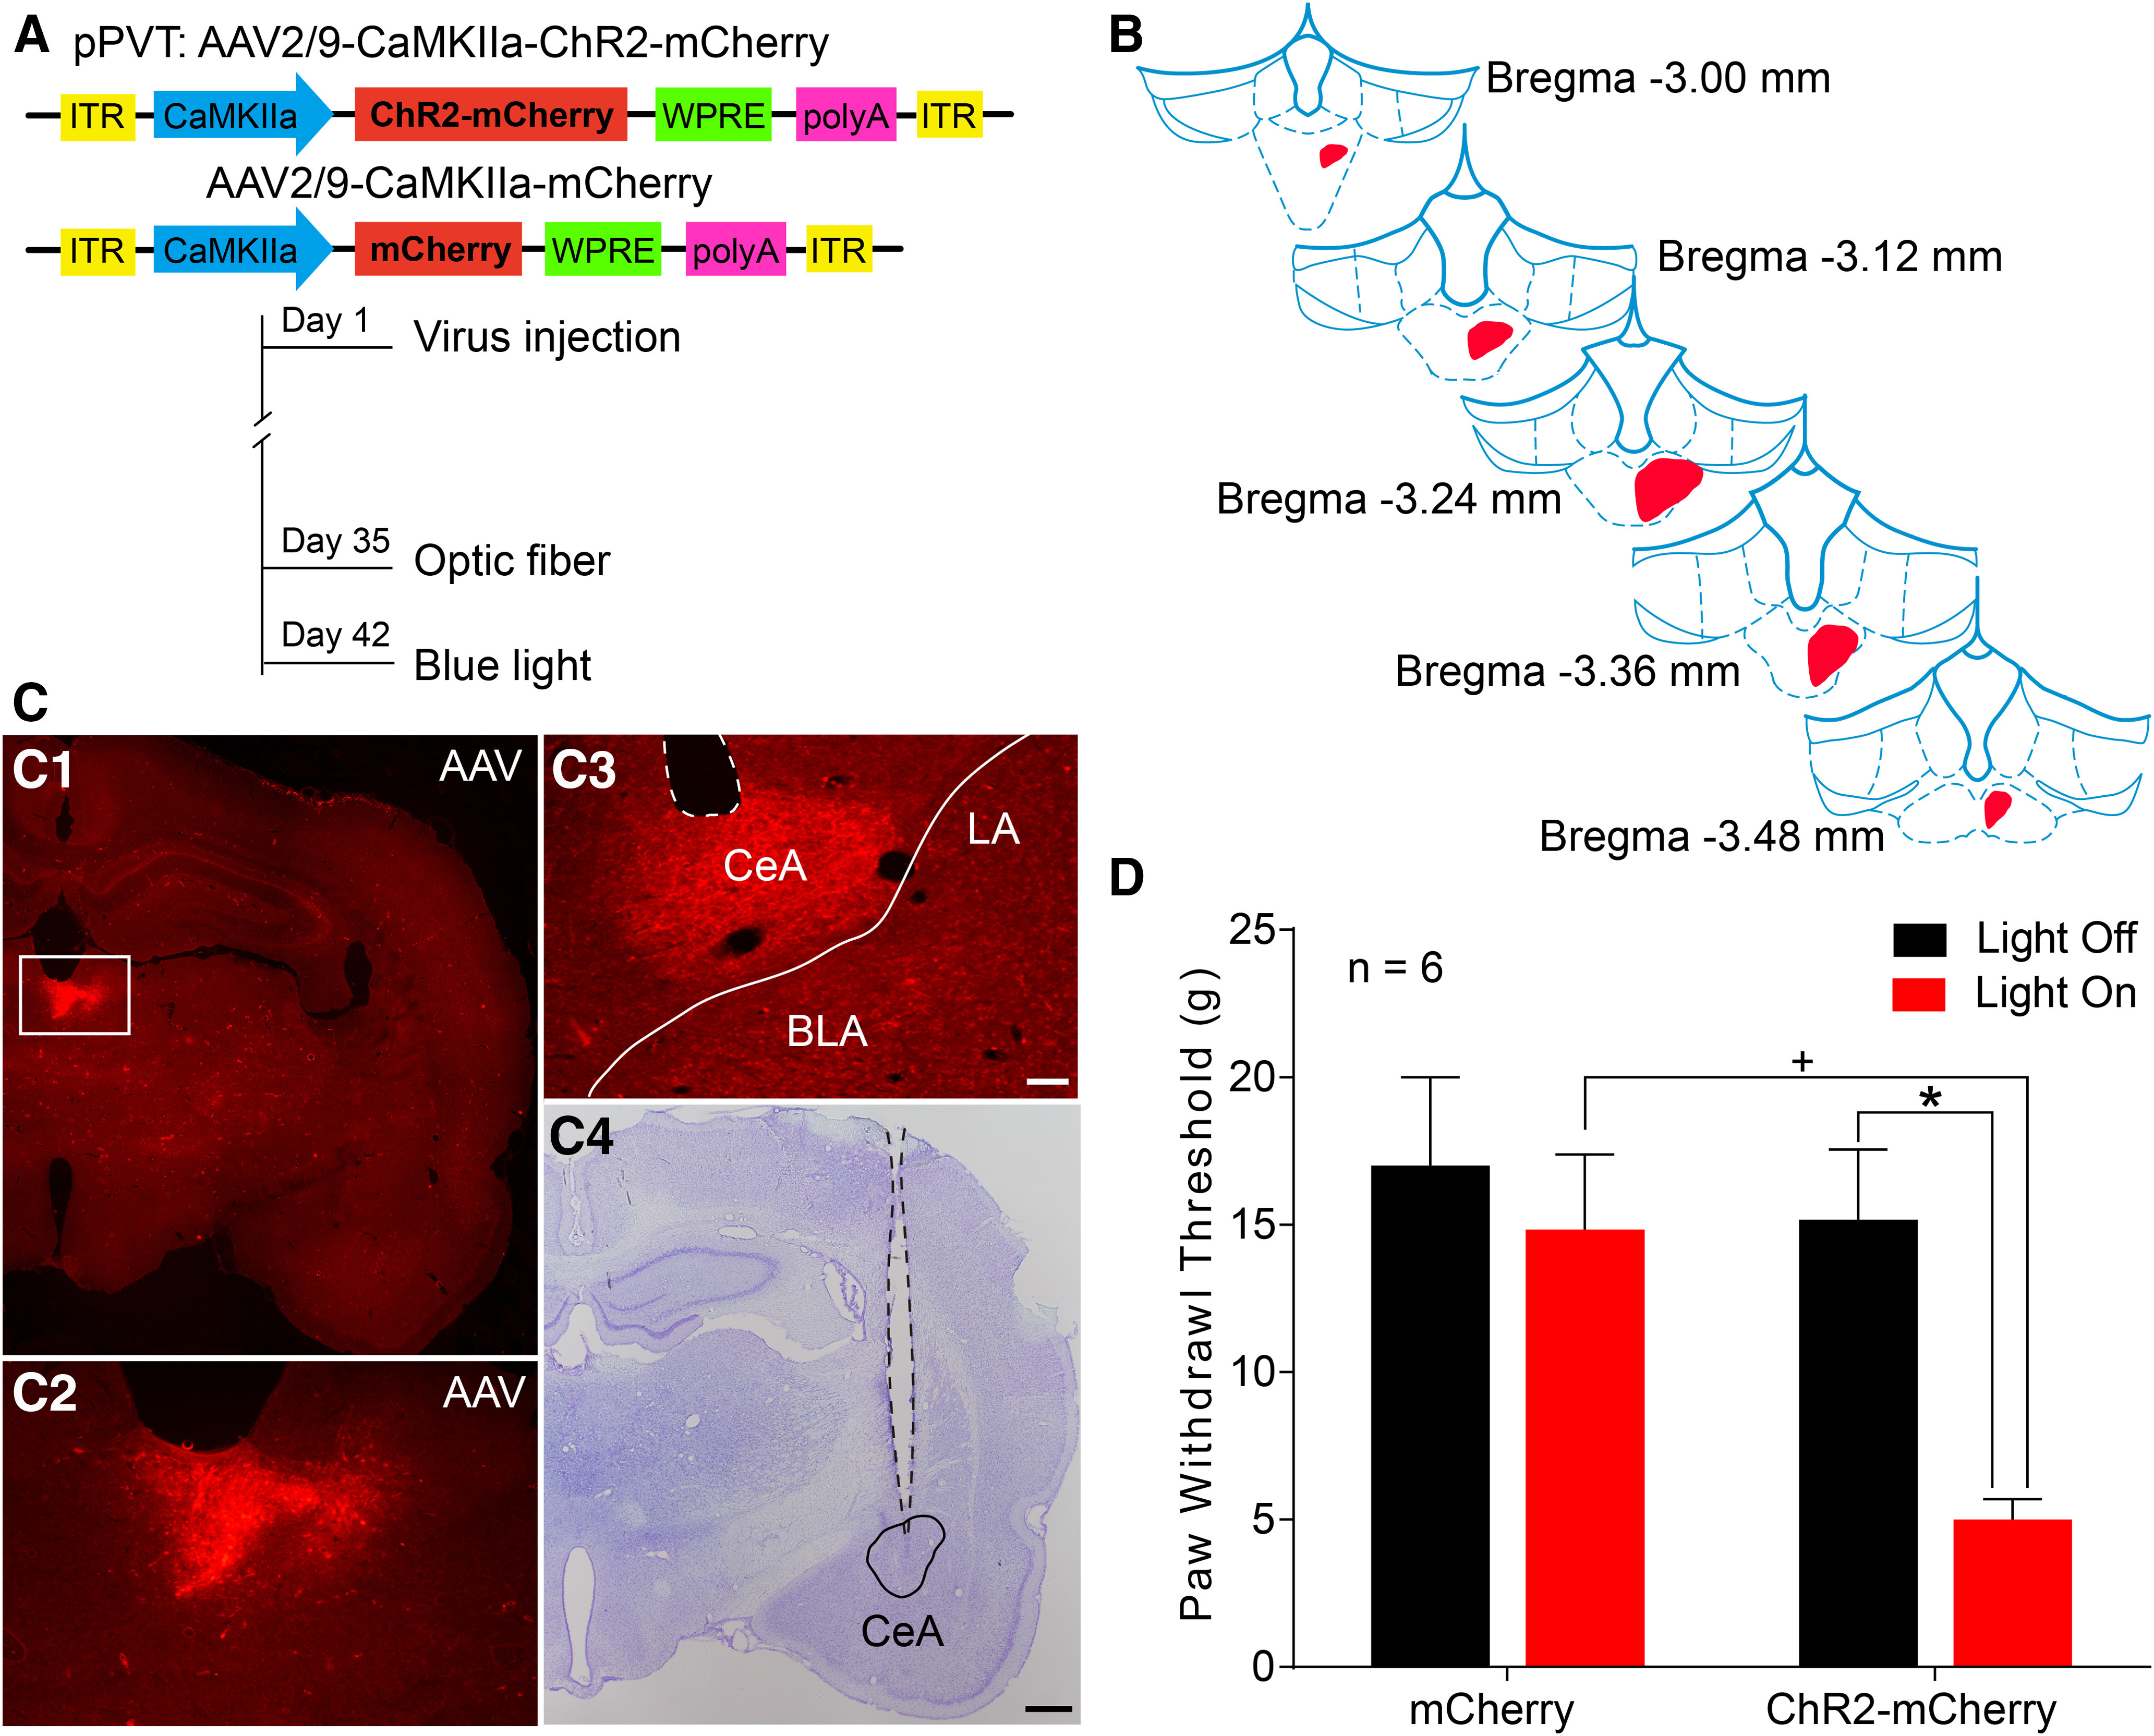
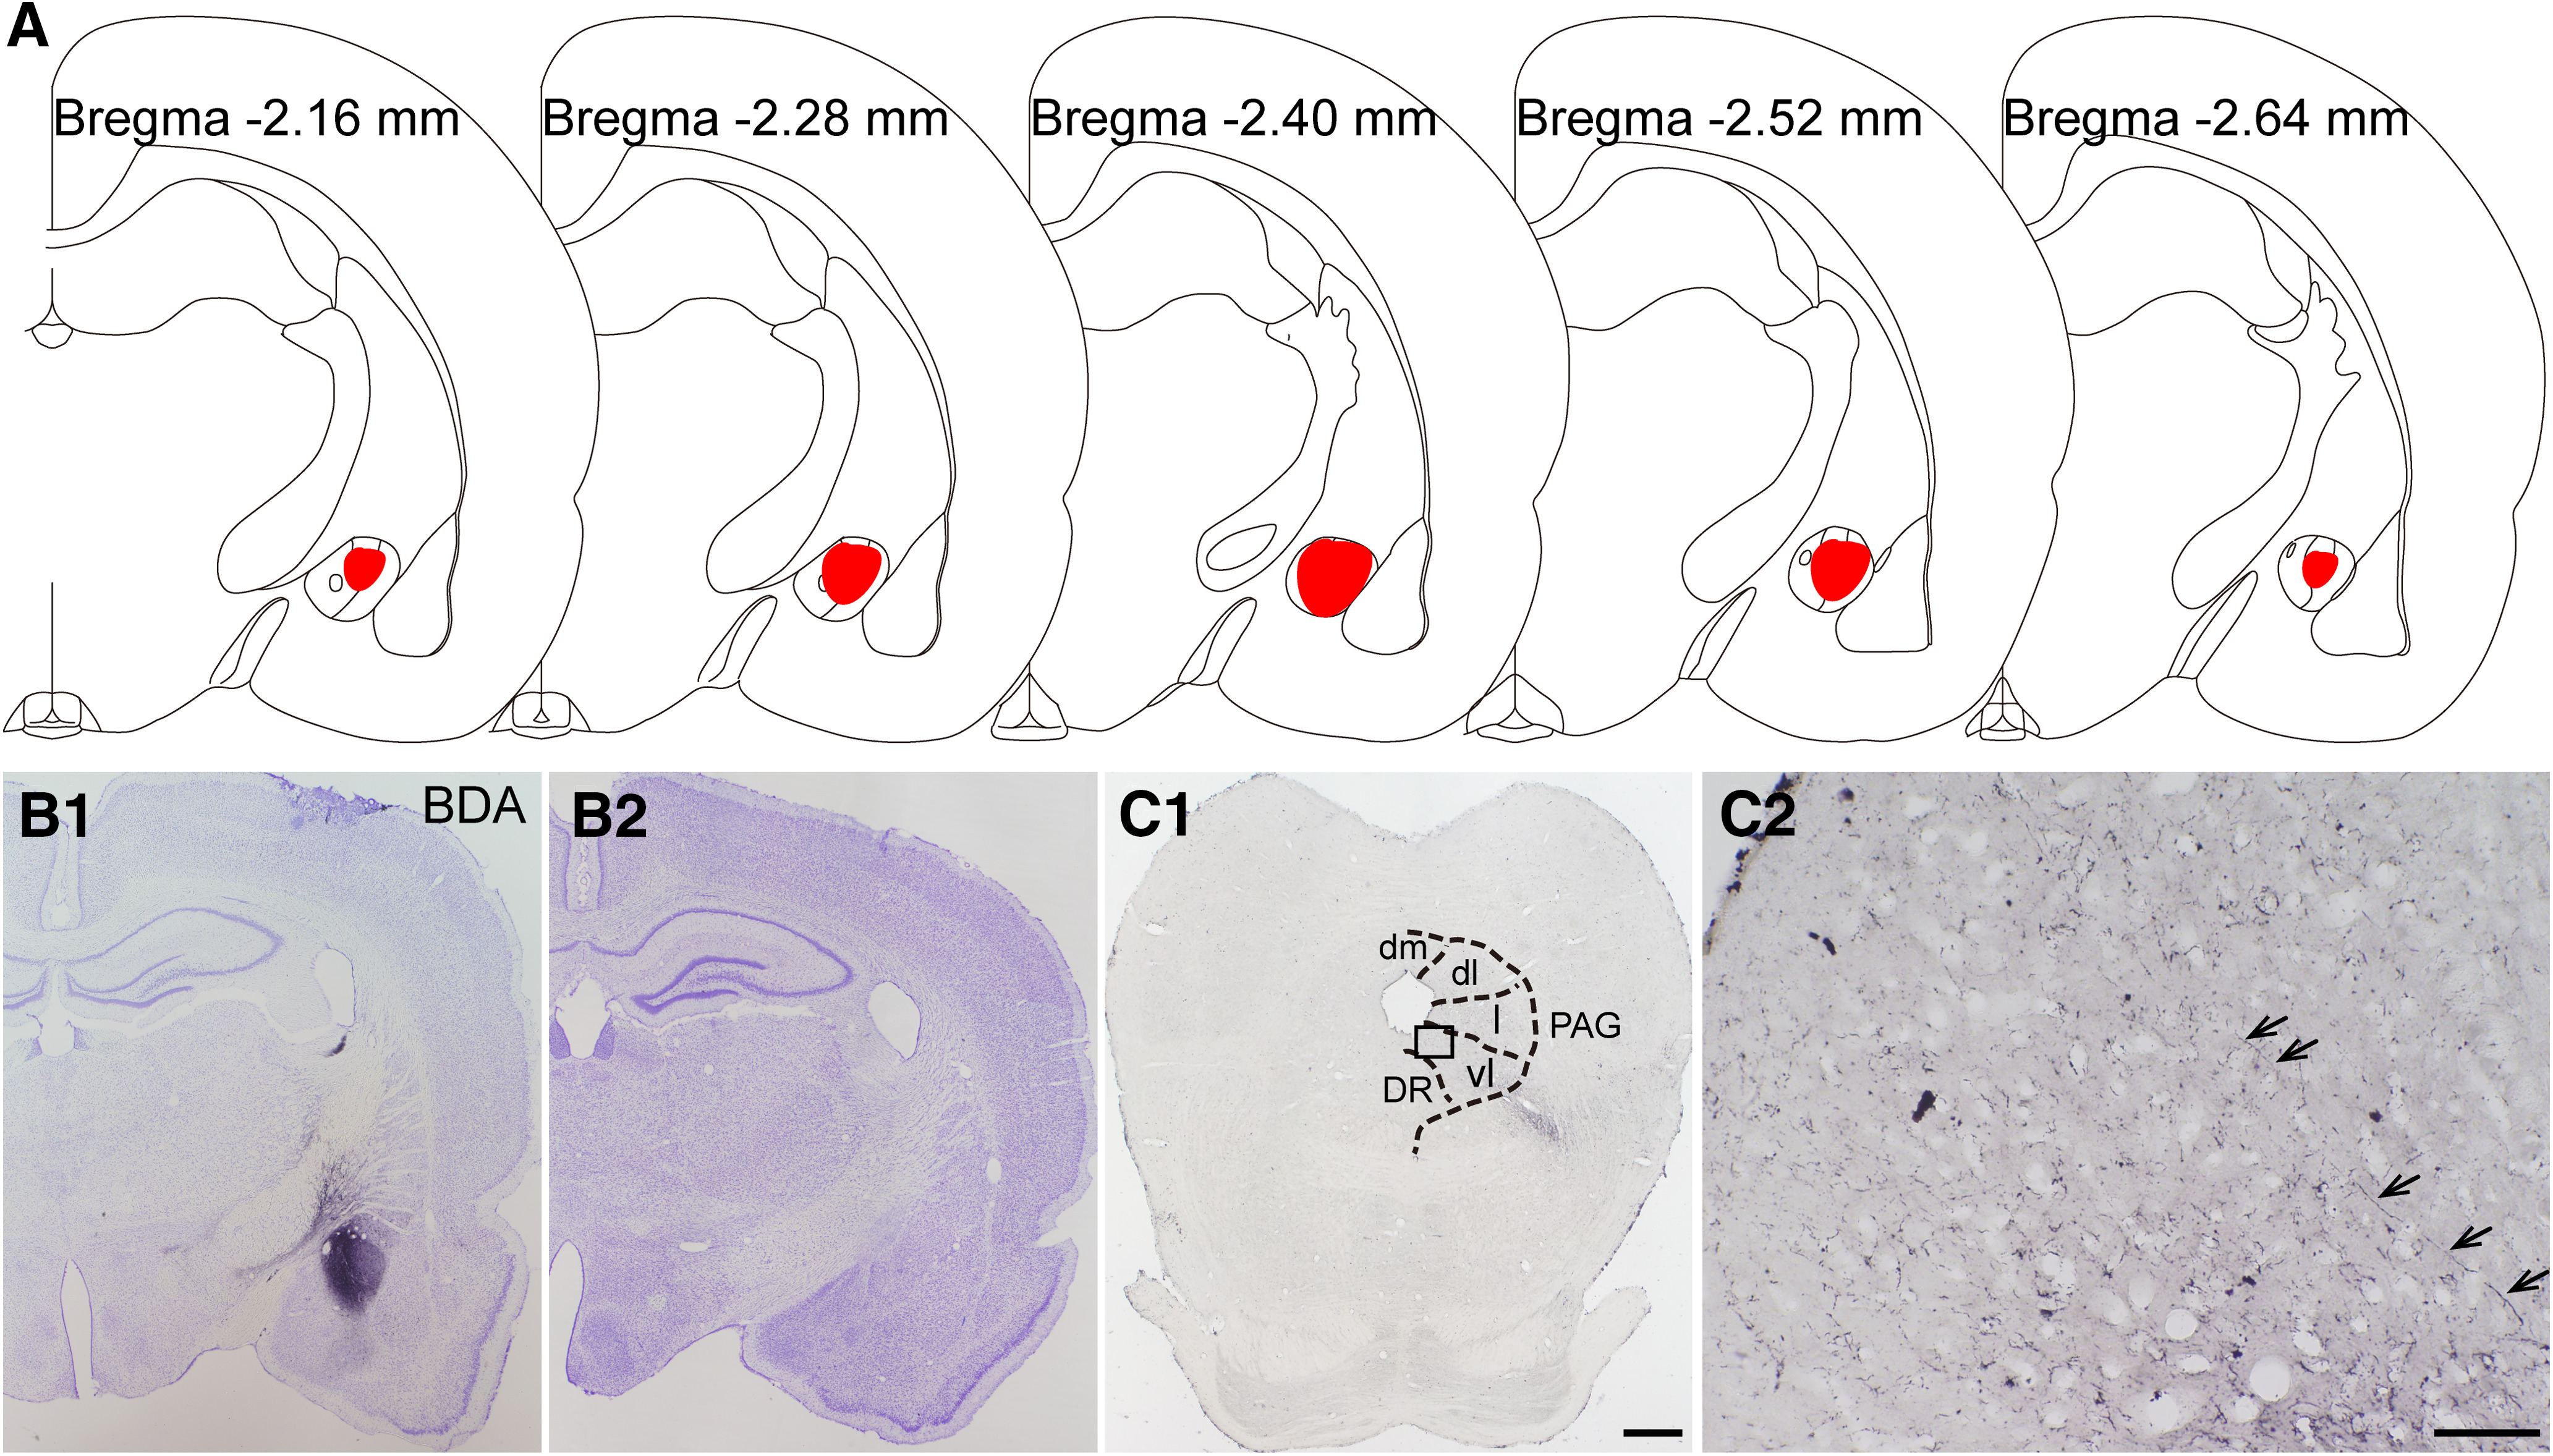
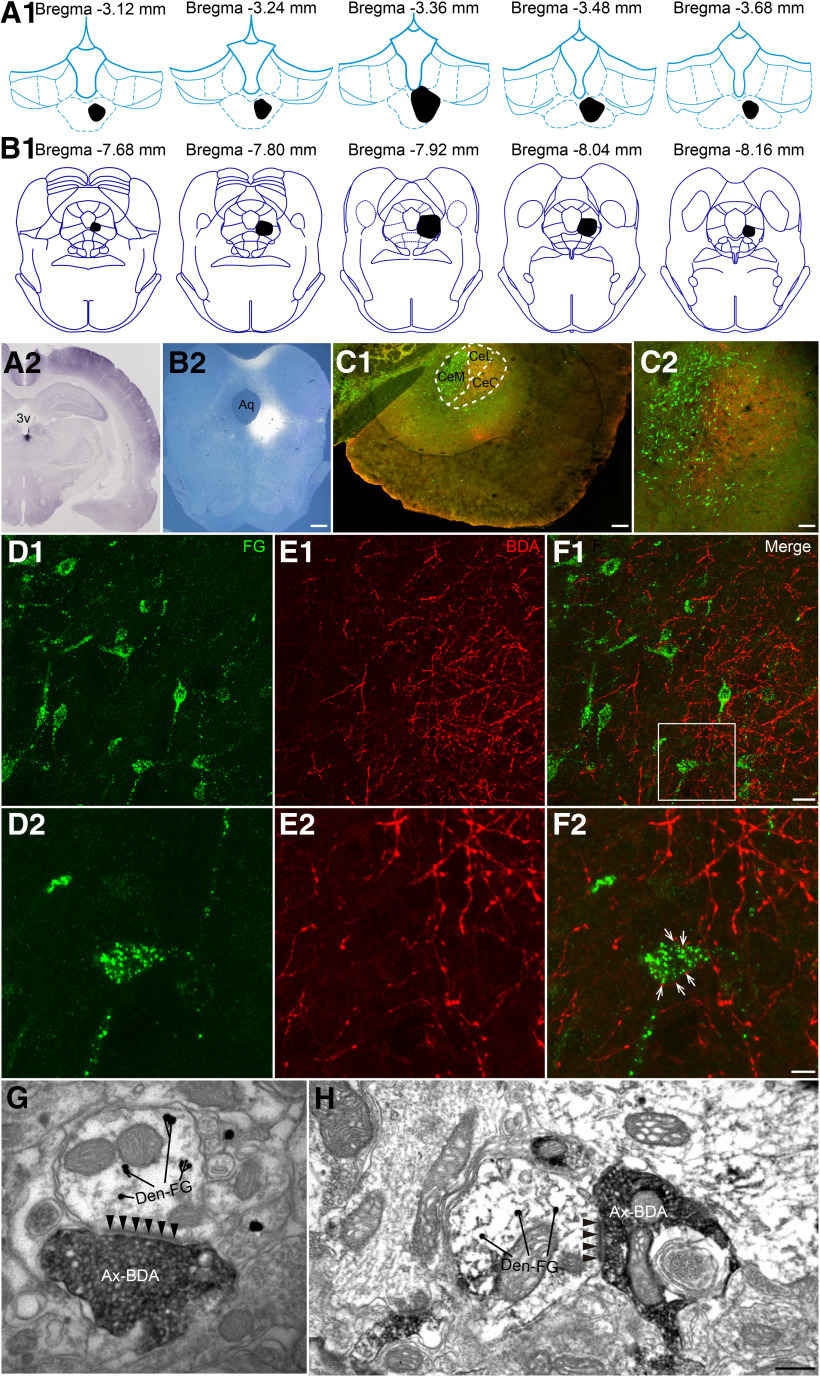
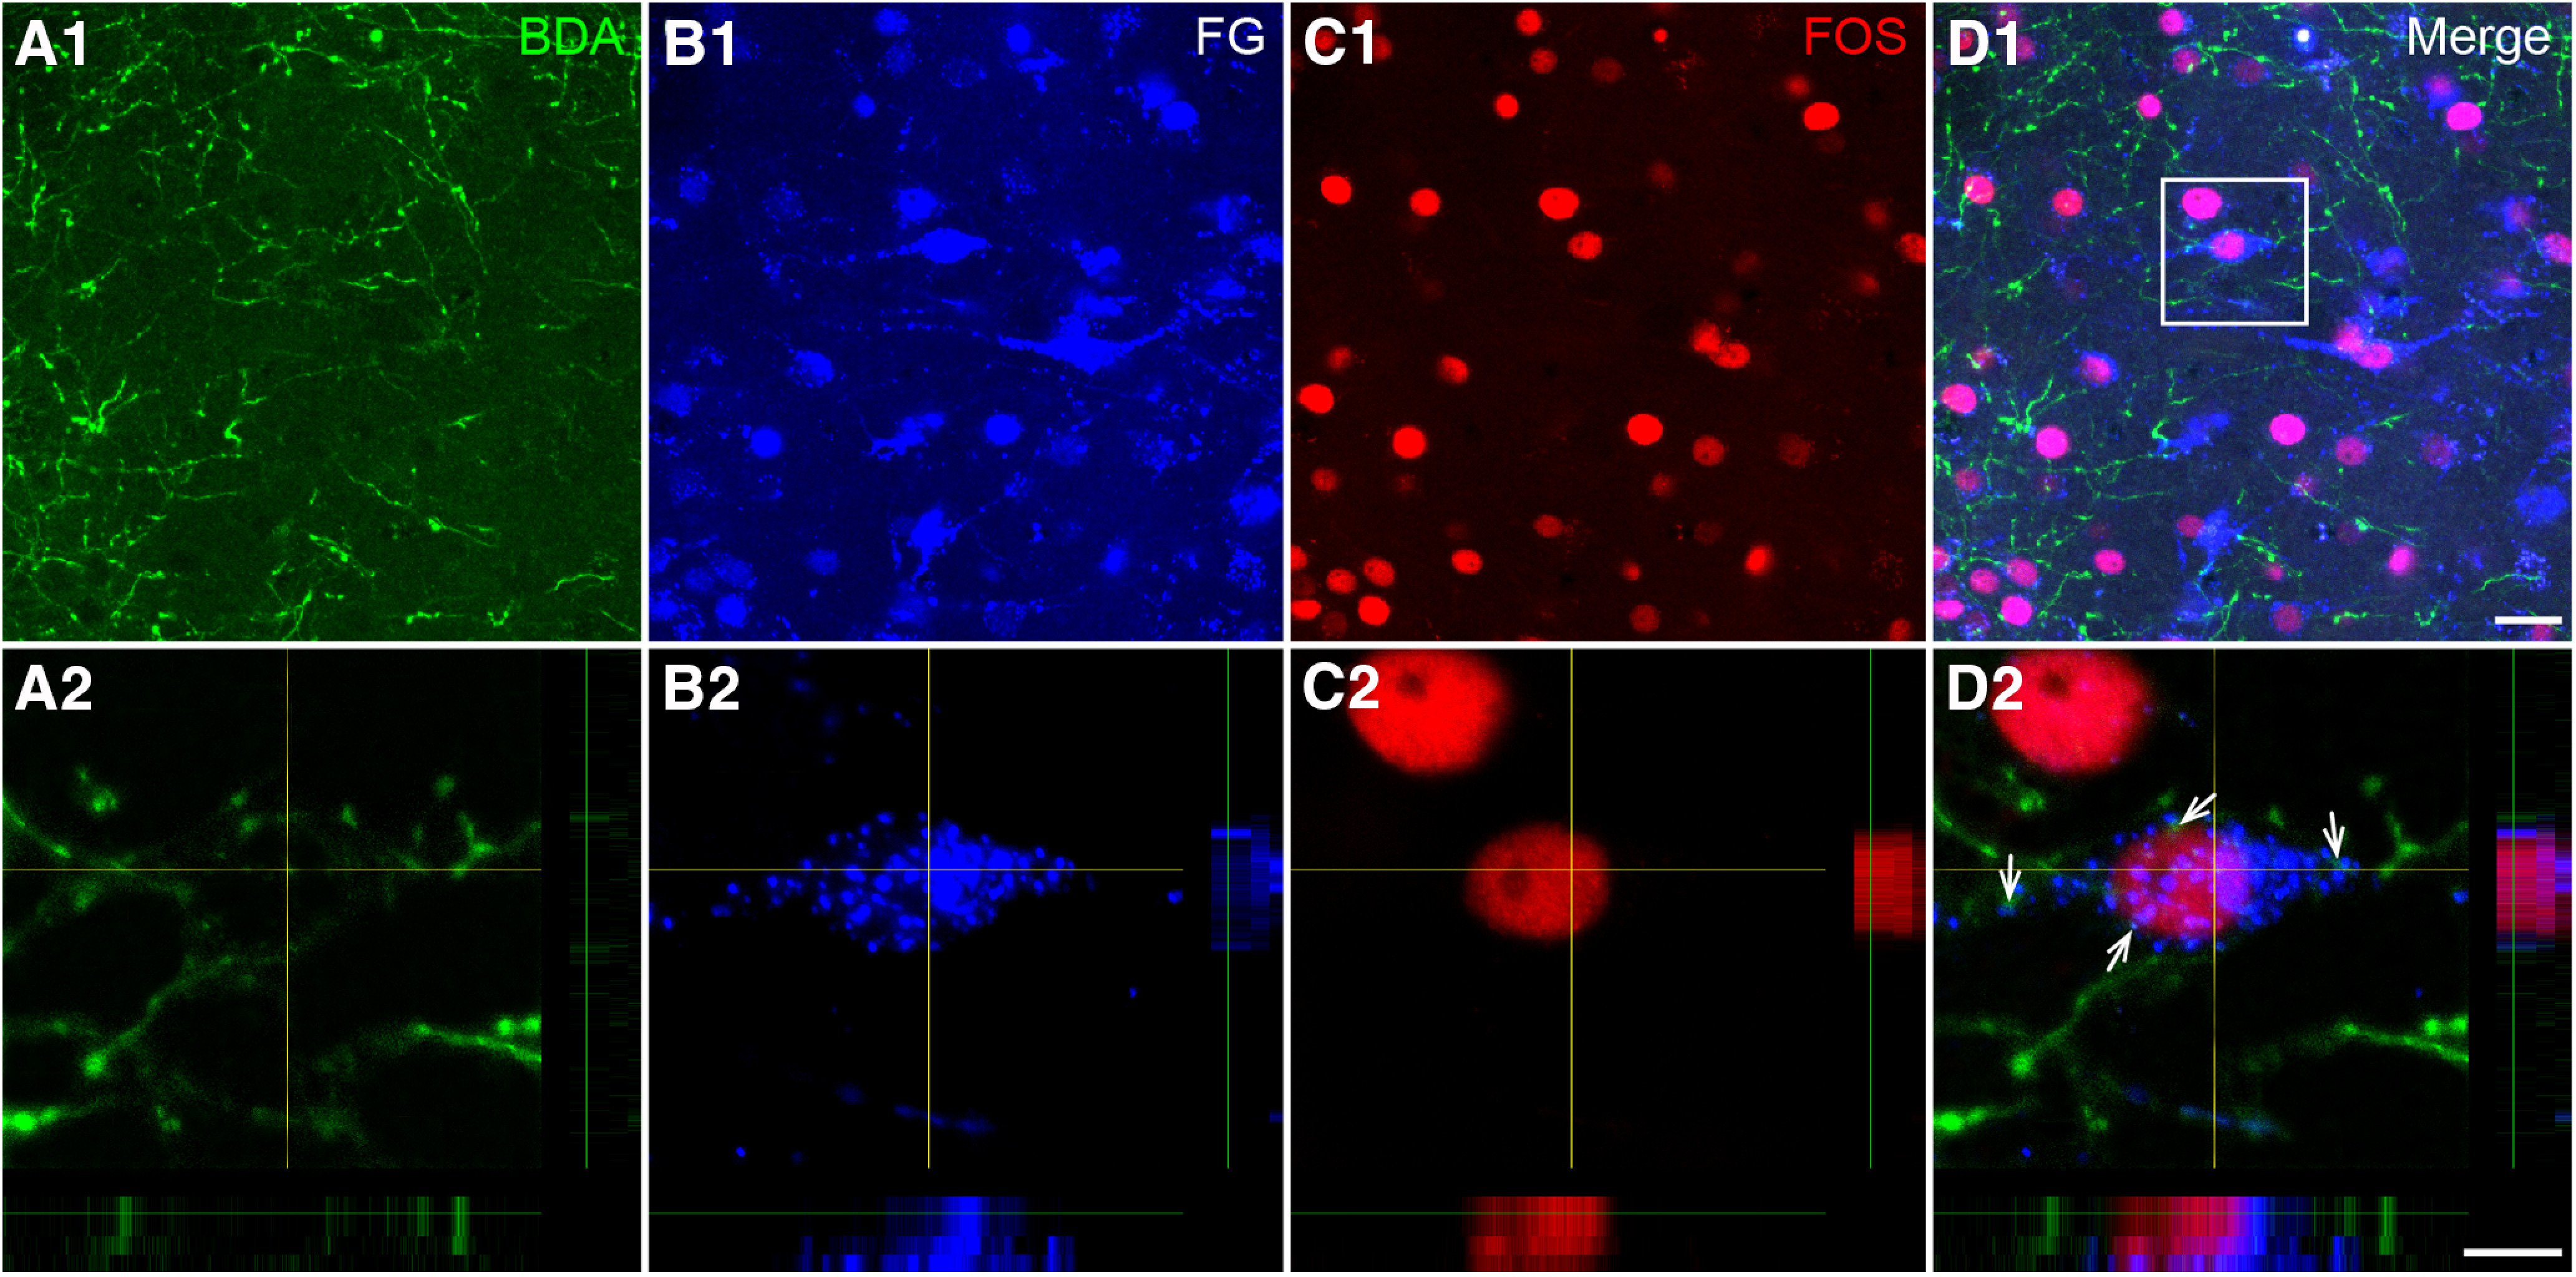
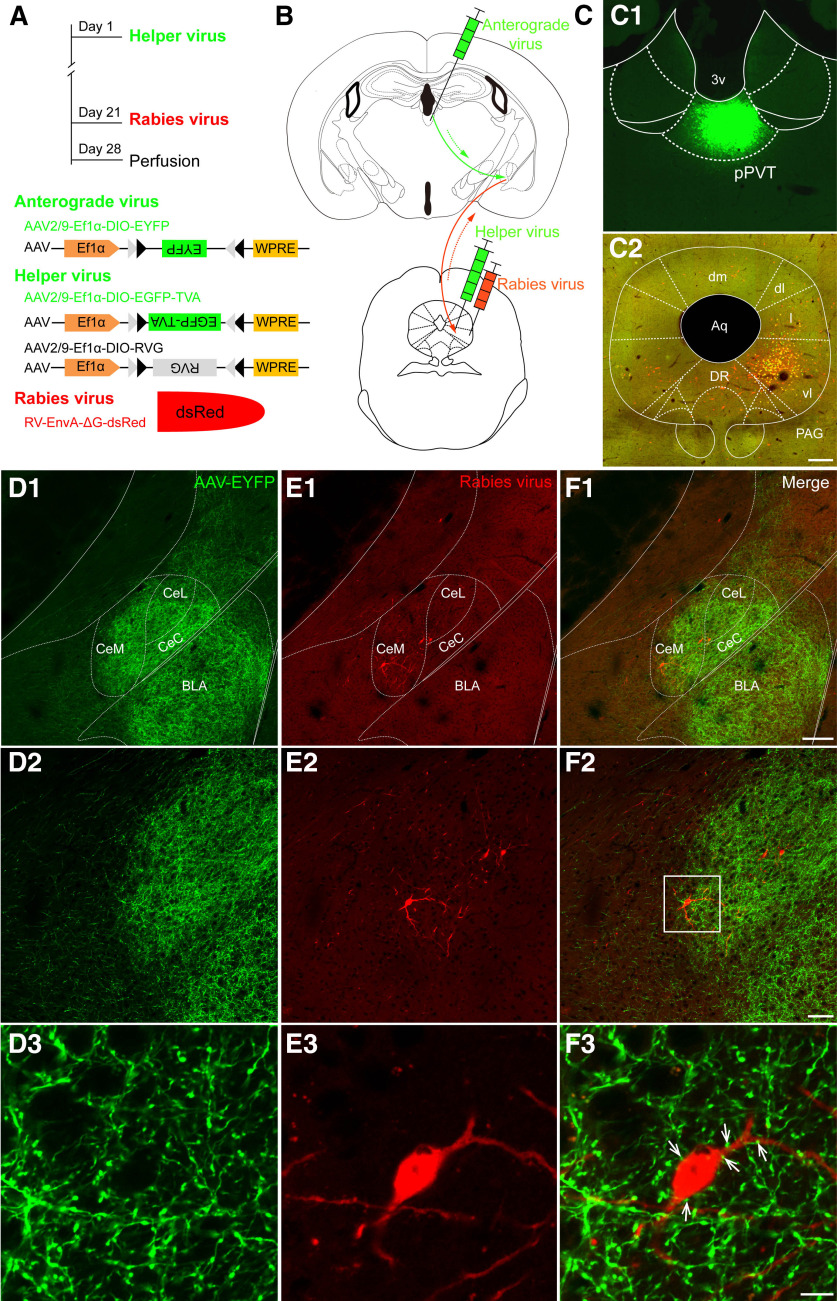
As one of the thalamic midline nuclei, the thalamic paraventricular nucleus (PVT) is considered to be an important signal integration site for many descending and ascending pathways that modulate a variety of behaviors, including feeding, emotions, and drug-seeking. A recent study has demonstrated that the PVT is implicated in the acute visceral pain response, but it is unclear whether the PVT plays a critical role in the central processing of chronic pain. Here, we report that the neurons in the posterior portion of the PVT (pPVT) and their downstream pathway are involved in descending nociceptive facilitation regarding the development of neuropathic pain conditions in male rats. Lesions or inhibition of pPVT neurons alleviated mechanical allodynia induced by spared nerve injury (SNI). The excitability of pPVT-central amygdala (CeA) projection neurons was significantly increased in SNI rats. Importantly, selective optogenetic activation of the pPVT-CeA pathway induced obvious mechanical hypersensitivity in naive rats. In addition, we used rabies virus (RV)-based and cell-type-specific retrograde transsynaptic tracing techniques to define a novel neuronal circuit in which glutamatergic neurons in the vlPAG were the target of the pPVT-CeA descending facilitation pathway. Our data suggest that this pPVTGlu+-CeA-vlPAGGlu+ circuit mediates central mechanisms of descending pain facilitation underlying persistent pain conditions.SIGNIFICANCE STATEMENT Studies have shown that the interactions between the posterior portion of the thalamic paraventricular nucleus (pPVT) and central amygdala (CeA) play a critical role in pain-related emotional regulation. However, most reports have associated this circuit with fear and anxiety behaviors. Here, an integrative approach of behavioral tests, electrophysiology, and immunohistochemistry was used to advance the novel concept that the pPVT-CeA pathway activation facilitates neuropathic pain processing. Using rabies virus (RV)-based and cell-type-specific retrograde transsynaptic tracing techniques, we found that glutamatergic neurons in the vlPAG were the target of the pPVT-CeA pathway. Thus, this study indicates the involvement of a pPVTGlu+-CeA-vlPAGGlu+ pathway in a descending facilitatory mechanism underlying neuropathic pain.

Keywords: central amygdala; descending facilitation; pain; thalamic paraventricular nucleus; ventrolateral periaqueductal gray.


Figures

Figure 1.
Figure 1.
Lesion of the pPVT by KA injection modulates neuropathic pain. A, The drawing showing the rostro-caudal extent of KA injection (black). B1, B2, The NeuN-labeled neurons in SNI + KA in the pPVT (white dotted outline in B1). B–D, Representative images from the same rat as A. C1, C2, The GFAP-labeled astrocytes in SNI + KA in the pPVT. D1, D2, The merged pictures of B, C. E1, E2, The NeuN-labeled neurons in SNI + saline in the pPVT (white dotted outline in E1). F1, F1, The GFAP-labeled astrocytes in SNI + saline in the pPVT. G1, G1, The merged pictures of E, F. Scale bars = 100 µm (D1, G1; applied in B1, C1, E1, F1) and 50 µm (D2, G2; applied in B2, C2, E2, F2). H, Quantitative analysis of the number of NeuN-labeled neurons in the pPVT; *p < 0.001, SNI + KA versus SNI + saline. I, The PWTs in rats by von Frey tests from the post-SNI operation days 4–28 (n = 6 in each group); +++p < 0.001, SNI versus sham; *p < 0.05, SNI + KA versus SNI + saline; ##p < 0.01, ###p < 0.001, SNI + KA versus sham.
Figure 2.
Figure 2.
Inhibition of the pPVT by chemocogenetics modulates neuropathic pain. A, The constructs as well as the sequences of the adeno-associated viruses (AAV2/9-CaMKIIa-hM4Di-mCherry and AAV2/9-CaMKIIa-mCherry) and the experimental procedures. B, Expression of hM4Di-mCherry (red) throughout the pPVT in consecutive coronal brain section. C, Representative injection sites at the largest extent in C1 (high magnification in C2, from the same rat as B) and Nissl's staining in C3. Scale bars = 200 µm (C3; applied in C1) and 100 µm (C2). D, CNO administration results in a significant increase in PWTs in SNI rats following microinjection of AAV2/9-CaMKIIa-hM4Di-mCherry (n = 6 in each group); ***p < 0.001, hM4Di-CNO versus hM4Di-saline; +++p < 0.001, post-CNO versus pre-CNO in hM4Di-CNO group; ###p < 0.001, hM4Di-CNO versus mcherry-CNO; NS, non-significant; p > 0.05, post-CNO of SNI versus baseline in hM4Di-CNO group.
Figure 3.
Figure 3.
The FG retrogradely labeled neurons from CeA to pPVT in the rats. A, The rostro-caudal extent of FG injection sites in the CeA (black) in consecutive coronal brain section. B1, B2, Representative injection at the largest extent in the CeA and Nissl's staining of the adjacent section. C1, C2, The FG-labeled neurons in the pPVT in C1 and enlarged in C2. Scale bars = 200 µm (C1; applied in B1, B2) and 50 µm (C2). A–C are coming from the same rat.
Figure 4.
Figure 4.
Fluorescent photomicrographs demonstrate the distributions of the VGLUT1 and VGLUT2 mRNA-containing neurons and TMR/VGLUT2 mRNA double labeled neurons in the pPVT after TMR was injected into the CeA. A1, A2, The distribution of VGLUT1 mRNA in the pPVT. A3, A4, The distribution of VGLUT2 mRNA in the pPVT. The white rectangular areas in A1, A3 are enlarged and displayed in A2, A4, respectively. Scale bars = 200 µm (A3; applied in A1) and 100 µm (A4; applied in A2). 3v: the third ventricle; MHb: medial habenular nucleus. B1, The rostro-caudal extent of TMR injection sites in the CeA (red) in consecutive coronal brain section. B2, B3, Representative TMR injection site in the CeA and Nissl's staining of the adjacent section. Scale bar = 200 µm (F2; applied in F1). C1, C2, The TMR-labeled neurons (red) in the pPVT. D1, D2, The VGLUT2 mRNA positive neurons (green) in the pPVT. E1, E2, The TMR/VGLUT2 mRNA double-labeled neurons (inset, white arrows, enlarged by the white dotted square area in E2). C2–E2, Enlarged by the area in the white frame in E1. Scale bars = 50 µm (E1; applied in C1, D1), 20 µm (E2; applied in C2, D2), and 10 µm (E2, inset). B–E are coming from the same rat F, the percentage of TMR-labeled neurons that expressed VGLUT2 mRNA. G–I, The negative control of TMR/VGLUT2 mRNA double-labeled neurons in the pPVT. No TMR/VGLUT2 mRNA double-labeled neurons are observed when the labeled sense probes instead of antisense probes was used. Scale bar = 100 µm (I; applied in G, H).
Figure 5.
Figure 5.
Fluorescent photomicrographs demonstrate the distributions of the FG/FOS-labeled neurons in the pPVT after FG was injected into the CeA. A1, A2, The FG-labeled neurons (red) in the pPVT in sham group. B1, B2, The FOS-labeled neurons (green) in the pPVT in sham group. C1, C2, The FG/FOS double-labeled neurons (white arrows in C2) in the pPVT. The white square area in C1 is enlarged and displayed in A2–C2. D1, D2, The FG-labeled neurons (red) in the pPVT in SNI group. E1, E2, The FOS-labeled neurons (green) in the pPVT in SNI group. F1, F2, The FG/FOS double-labeled neurons (white arrows in F2) in the pPVT. The white square area in F1 is enlarged and displayed in D2–F2. Scale bars = 100 µm (C1, F1; applied in A1, B1, D1, E1) and 20 µm (C2, F2; applied in A2, B2, D2, E2). G, The percentage of FG/FOS double-labeled neurons in the pPVT in sham and SNI groups. There is a significant difference (between sham and SNI animals) in the percentage of FG retrogradely labeled neurons that express FOS; ***p < 0.001.
Figure 6.
Figure 6.
The injection site of TMR in the CeA and recorded pPVT-CeA projecting neuron for electrophysiology. A1, A2, The injection site of TMR in the CeA and Nissl's staining of the adjacent slice. Scale bar = 50 µm (A2; applied in A1). B1, B2, TMR retrogradely labeled neurons (red) in the pPVT at low and high magnifications. C1, C2, The recorded neuron, filled with biocytin and visualized with FITC-conjugate avidin (green). D1, D2, Merged images showing that the biocytin-filled neuron is the TMR retrogradely labeled neuron. Scale bars = 100 µm (D1; applied in B1, C1), 20 µm (D2; applied in B2, C2), and 10 µm (D2, inset).
Figure 7.
Figure 7.
The excitability of pPVT-CeA projecting neurons is increased in neuropathic pain rats. A, Sample traces of sEPSCs of recorded pPVT-CeA projecting neurons in the sham and SNI groups. B, Cumulative distributions of the amplitudes (left) and inter-event intervals (right) of the sEPSC of the sham group (n = 10, black line) and the SNI group (n = 9, red line). The mean cumulative distribution of the sEPSC amplitude in the SNI group is significantly shifted to higher amplitudes (**p < 0.01), and the mean cumulative distribution of the sEPSC interevent intervals in the SNI group is significantly shifted to shorter durations (**p < 0.01). C, Graph showing that the sEPSC amplitude and frequency are significantly increased in the SNI group (**p < 0.01). D, Sample traces of minimal depolarizing current induced action potential in the sham group and the SNI group. E, Graph showing that SNI decreases the rheobase current (**p < 0.01), and increases the mean RMP (*p < 0.05), with no significantly change in the firing threshold and spike amplitude.
Figure 8.
Figure 8.
Optogenetic activation of the pPVT-CeA pathway induces mechanical allodynia. A, The constructs as well as the sequences of the adeno-associated viruses (AAV2/9-CaMKIIa-ChR2-mCherry and AAV2/9-CaMKIIa-mCherry) and the experimental procedures. B, The rostro-caudal extent of the virus injection sites in the right pPVT (red) in consecutive coronal brain section. C, Representative images of virus injection sites in the right pPVT (the area in the white frame in C1 is magnified in C2) and virus labeled axonal fibers and terminals in the CeA (C3). The optic fiber trace and its tip site are shown in C3 (white dotted outline) and C4 (black dotted outline). B, C are coming from the same rat. LA: lateral nucleus of amygdala; BLA: basolateral nucleus of amygdala. Scale bars = 200 µm (C4; applied in C1) and 100 µm (C3; applied in C2). D, Light activation of the PVT-CeA pathway results in a significant decrease in the PWTs in naive rats (n = 6 in each group); *p < 0.05, light on versus light off in ChR2-mcherry group; +p < 0.05, ChR2-mCherry versus mCherry in state of light on.
Figure 9.
Figure 9.
The results of anterograde nerve tract tracing by BDA from CeA to vlPAG in the rats. A, The rostro-caudal extent of BDA injection sites in the CeA (red) in consecutive coronal brain section. B1, B2, The BDA injection site in the CeA and Nissl's staining of the adjacent section. C1, C2, The BDA labeled axonal terminals (black arrows) in the vlPAG. The black square area in C1 is enlarged and displayed in C2. A–C are coming from the same rat. dm: dorsomedial subregion of the PAG; dl: dorsolateral subregion of the PAG; l: lateral subregion of the PAG; vl: ventrolateral subregion of the PAG; DR: dorsal raphe nucleus. Scale bars = 200 µm (C1; applied in B1, B2) and 50 µm (C2).
Figure 10.
Figure 10.
Neuronal connectivity on the pPVT-CeA-vlPAG pathway. A1, The rostro-caudal extent of BDA injection sites in the pPVT (black) in consecutive coronal brain section. B1, The rostro-caudal extent of FG injection sites in the vlPAG (black) in consecutive coronal brain section. A2, Representative photomicrograph showing the injection site of BDA into the right pPVT (black). 3v: the third ventricle. B2, Representative photomicrograph showing the injection site of FG into the right vlPAG (bright color). Aq: aqueduct. Scale bar = 200 µm (A2, B2). C1, C2, The distribution of BDA-labeled axon terminals (red) and FG-labeled neurons (green) in the CeA. CeC: capsular part of the CeA; CeL: lateral part of the CeA; CeM: the medial part of the CeA. Scale bars = 100 µm (C1) and 50 µm (C2). D1, D2, The FG-labeled neurons in the CeA after tracer was injected into the vlPAG. E1, E2, The BDA-labeled fibers and axonal terminals in the CeA projected from the pPVT. F1, F2, The connections between BDA-labeled axonal terminals and FG-labeled neurons (white arrows in F2). The white square area in F1 is enlarged and displayed in D2–F2. Scale bars = 20 µm (F1; applied in D1, E1) and 10 µm (F2; applied in D2, E2). A–F are coming from the same rat. G, H, The asymmetric synapses (black arrowheads) are formed by BDA anterogradely labeled axonal terminals (Ax-BDA) and FG-labeled postsynaptic dendrites (Den-FG). Scale bar = 250 nm (G, H).
Figure 11.
Figure 11.
Activation of the pPVT-CeA-vlPAG neural pathway indicated by FOS staining in the CeA. A1, A2, The BDA-labeled axonal terminals (green) observed in the CeA coming from the pPVT. B1, B2, The FG-labeled neuronal somata and processes (blue) in the CeA retrogradely labeled from the vlPAG. C1, C2, The FOS-labeled NeuNs (red). D1, D2, The FG/FOS double-labeled neurons surrounded by BDA-labeled fibers (white arrows in D2). The white square area in D1 is enlarged and displayed in A2–D2. A2–D2 show a projection of four optical sections and the total distance in the z-axis is 4.5 μm. Scale bars = 20 µm (D1; applied in A1–C1) and 10 µm (D2; applied in A2–C2).
Figure 12.
Figure 12.
Fluorescent photomicrographs observation of the pPVT-CeA-vlPAG pathway. A, B, Schematic diagrams of the experimental procedure, the constructs and sequences of the adeno-associated viruses (AAV2/9-Ef1α-DIO-EYFP) and the rabies-based viruses. C, The virus injection sites in the pPVT (green, C1) and the vlPAG (yellow, C2). C2, VGLUT2 starter cells are labeled in yellow, and presynaptic partners throughout the brain are labeled in red. 3v: the third ventricle; Aq: aqueduct; dm: dorsomedial subregion of the PAG; dl: dorsolateral subregion of the PAG; l: lateral subregion of the PAG; vl: ventrolateral subregion of the PAG; DR: dorsal raphe nucleus. Scale bar = 200 µm (C2; applied in C1). D1D3, The pPVT projecting glutamatergic terminals in the CeA (green). E1–E3, The dsred-labeled presynaptic projection neurons in the CeA. F1–F3, The connections (white arrows in F3) between the pPVT projecting glutamatergic terminals and the CeA-vlPAG projection neurons. The white square area in F2 is enlarged and displayed in D3–F3. C–F are coming from the same mouse. Scale bars = 100 µm (F1; applied in D1, E1), 10 µm (F2; applied in D2, E2), and 5 µm (F3; applied in D3, E3).

References

    1. Armbruster BN, Li X, Pausch MH, Herlitze S, Roth BL (2007) Evolving the lock to fit the key to create a family of G protein-coupled receptors potently activated by an inert ligand. Proc Natl Acad Sci USA 104:5163–5168. 10.1073/pnas.0700293104 - DOI - PMC - PubMed
    1. Bhatnagar S, Huber R, Nowak N, Trotter P (2002) Lesions of the posterior paraventricular thalamus block habituation of hypothalamic-pituitary-adrenal responses to repeated restraint. J Neuroendocrinol 14:403–410. 10.1046/j.0007-1331.2002.00792.x - DOI - PubMed
    1. Bubser M, Deutch AY (1998) Thalamic paraventricular nucleus neurons collateralize to innervate the prefrontal cortex and nucleus accumbens. Brain Res 787:304–310. 10.1016/s0006-8993(97)01373-5 - DOI - PubMed
    1. Callaway EM, Luo L (2015) Monosynaptic circuit tracing with glycoprotein-deleted rabies viruses. J Neurosci 35:8979–8985. 10.1523/JNEUROSCI.0409-15.2015 - DOI - PMC - PubMed
    1. Carr PA, Noga BR, Nance DM, Jordan LM (1994) Intracellular labeling of cat spinal neurons using a tetramethylrhodamine-dextran amine conjugate. Brain Res Bull 34:447–451. 10.1016/0361-9230(94)90017-5 - DOI - PubMed

Publication types

LinkOut - more resources