. 2020 Sep 21;3(11):e202000883.
doi: 10.26508/lsa.202000883. Print 2020 Nov.

Implications for tetraspanin-enriched microdomain assembly based on structures of CD9 with EWI-F

Affiliations

Implications for tetraspanin-enriched microdomain assembly based on structures of CD9 with EWI-F

Wout Oosterheert et al. Life Sci Alliance. .

Abstract

Tetraspanins are eukaryotic membrane proteins that contribute to a variety of signaling processes by organizing partner-receptor molecules in the plasma membrane. How tetraspanins bind and cluster partner receptors into tetraspanin-enriched microdomains is unknown. Here, we present crystal structures of the large extracellular loop of CD9 bound to nanobodies 4C8 and 4E8 and, the cryo-EM structure of 4C8-bound CD9 in complex with its partner EWI-F. CD9-EWI-F displays a tetrameric arrangement with two central EWI-F molecules, dimerized through their ectodomains, and two CD9 molecules, one bound to each EWI-F transmembrane helix through CD9-helices h3 and h4. In the crystal structures, nanobodies 4C8 and 4E8 bind CD9 at loops C and D, which is in agreement with the 4C8 conformation in the CD9-EWI-F complex. The complex varies from nearly twofold symmetric (with the two CD9 copies nearly anti-parallel) to ca. 50° bent arrangements. This flexible arrangement of CD9-EWI-F with potential CD9 homo-dimerization at either end provides a "concatenation model" for forming short linear or circular assemblies, which may explain the occurrence of tetraspanin-enriched microdomains.


Conflict of interest statement

The authors declare that they have no conflict of interest.

Figures

Figure S1.
Figure S1.. Characterization of anti-CD9 nanobodies 4C8 and 4E8.
(A) Concentration-dependent binding curves of 4C8 and 4E8 binding to endogenous CD9 on HeLa cells. (B) Concentration-dependent binding curves of 4C8 and 4E8 binding to detergent-purified, full-length CD9. (C) Calculated apparent binding affinity (KD) of both 4C8 and 4E8 on HeLa cells and detergent-purified, full-length CD9 (wtCD9-3xSTREP) after nonlinear regression curve fitting using one-site specific binding equation. Comparable binding curves for 4C8 were described previously (Neviani et al, 2020).
Figure 1.
Figure 1.. Nanobody-bound CD9EC2 structures.
(A, B) Crystal structure of CD9EC2 (blue) bound to nanobody 4C8 (orange, panel A) and nanobody 4E8 (pink, panel B). The regions of the EC2 are annotated. (C, D) Interaction interface between CD9EC2 (blue) and nanobody 4C8 (orange, panel C) and nanobody 4E8 (pink, panel D). Residues contributing to the interface are shown as sticks. (E) Overlay of the nanobody-bound EC2 structures with the structure of full-length CD81 (gray). The CD81 structure is shown parallel to the membrane as a side view.
Figure S2.
Figure S2.. Structures of 4C8 alone and bound to CD9EC2.
(A, B) Asymmetric units of the structure of 4C8 alone (A) and the CD9EC2–4C8 structure (B). 4C8 alone crystallized in space group P21 with two copies in the asymmetric unit. Residues 102–105 of CDR3 are not modeled in the 4C8 structure.
Figure S3.
Figure S3.. Twinned CD9EC2 crystal.
(A) Reciprocal space reconstructions, hk0, hk2, and hk4. Each slice has Bragg reflections from the two twin lattices. In addition, in hk2 streaks along a* + b* can be clearly observed. All slices hk(l = 4n) are ordered. (B) Green and orange structures represent the two twin domains in the crystal. The middle layer is the twin interface with base vectors c and a-b. From there, the structure can continue in the green or orange direction; the relative shift between the two is 1/4 c. Starting from the middle layer, every fourth layer, the two twin structures exactly overlap. (B, C) Structure of CD9EC2 viewed in the same orientation as (B) and colored by B-factor (spectrum blue-white-red, minimum 20 maximum 100 Å2). A region within the D-loop shows high B-factor. It is located at the interface with the next layer, along the a + b direction.
Figure 2.
Figure 2.. CD9EC2 structure and D-loop flexibility.
(A) Asymmetric unit of the twinned CD9EC2 crystal, colored by protein chain. The regions of a single EC2 chain are annotated. (B) Overlay of the C- and D-loop arrangements of CD9EC2 (cyan), nanobody (Nb) 4C8 and 4E8 bound CD9EC2 (blue), and full-length CD81 (gray, pdb 5TCX).
Figure 3.
Figure 3.. Biochemical and structural characterization of CD9 with full-length EWI-F and EWI-F truncations.
(A) Size-exclusion chromatography (SEC) elution profile of co-expressed CD9 and EWI-F after Strep-affinity purification. (B) SDS page gel of peaks 1 and 2 of the SEC elution from panel (A). Multiple bands are visible for EWI-F because of heterogeneous glycosylation and for CD9 because of the partial SDS-induced unfolding of the GFP-tag. (C) Analytical tryptophan fluorescence-assisted SEC elution profile of the CD9-EWI-F complex used for cryo-EM. (D) Cryo-EM micrograph depicting CD9–EWI-F particles in vitreous ice. The scale bar length is 200 Å. Examples of individual particles are boxed in red. (E) Selected 2D-class averages generated through Relion. The box size is 409 × 409 Å. The class that shows evidence for dimeric EWI-F is boxed in red. (F) SDS page gel of Strep-purified CD9 with different variants of EWI-F. Gel bands at the expected molecular weights of the EWI-F variants are marked with an asterisk (*).
Figure 4.
Figure 4.. Cryo-EM sample preparation and imaging of EWI-FΔIg1-5–CD9–4C8.
(A) Size-exclusion chromatography (SEC) elution profile of co-expressed CD9 and EWI-FΔIg1-5, after preincubation with a large excess of nanobody 4C8. (B) SDS page gel of peaks 1 of the SEC elution from panel (A). (C) Analytical fluorescence-assisted SEC elution profile of the EWI-FΔIg1-5–CD9–4C8 complex used for cryo-EM. (D) Cryo-EM micrograph depicting EWI-FΔIg1-5–CD9–4C8 particles in vitreous ice. The scale bar length is 200 Å. (E) Selected 2D-class averages generated through Relion. The box size is 309 × 309 Å.
Figure 5.
Figure 5.. Cryo-EM structure of EWI-FΔIg1-5–CD9–4C8.
(A, B, C) Sharpened, local-resolution filtered cryo-EM density map of EWI-FΔIg1-5–CD9–4C8 fitted with structures of CD9EC2–4C8, the TMD of CD9 (6K4J) and homology models of EWI-F, as viewed parallel to the membrane as a side view (A), orthogonal to the membrane from the extracellular side (B), or as a side view rotated by 30° (C). (D) Zoom of the major interaction region in a CD9 - EWI-F hetero-dimer. Membrane helices are annotated. (E) Overlay of the 4C8-bound CD9EC2 as oriented in the cryo-EM structure with the structure of CD81 (gray, pdb 5TCX).
Figure S4.
Figure S4.. Cryo-EM image processing of the EWI-FΔIg1-5–CD9–4C8 dataset.
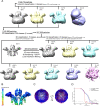
(A) Image-processing strategy in the Relion pipeline (see experimental procedures). All density maps from a single 3D classification are depicted at the same contour level in the same orientation. (B) Local-resolution estimation of the reconstruction, computed through Relion. (C) Angular distribution of the particles that were used for the reconstruction of the 8.6-Å resolution density map. (D) Fourier-shell correlation plot for gold-standard refined masked (black), unmasked (blue), and high-resolution phase randomized (red) half maps. The FSC = 0.143 threshold is shown as a dashed line.
Figure S5.
Figure S5.
Comparison between CD9-EWI-F and CD9-EWI-2 density maps. (A, B) Cryo-EM density maps of CD9–EWI-F (from this study) and CD9–EWI-2 (EMDB-30027) shown in the same orientation parallel to the membrane as a side view. The density for the Ig1–Ig3 domains of CD9–EWI-2 is hidden for clarity. Different protein regions of both maps are annotated.
Figure 6.
Figure 6.. Flexibility of the EWI-FΔIg1-5–CD9–4C8 revealed by 3D classifications.
Four classes obtained from a single 3D classification run are shown (see also Fig S4). The density regions corresponding to the Ig6-domain of EWI-F, CD9EC2, nanobody 4C8, and the digitonin micelle are colored green, blue, orange, and white, respectively. The top row depicts the four classes parallel to the membrane as a side view. The middle row shows the classes orthogonal to the membrane from the extracellular side. The bottom row depicts the density maps in the same orientation as in the middle row, with annotated distances and angles between CD9EC2-residue K135 and 4C8-residue S121.
Figure 7.
Figure 7.. Concatenation model of tetraspanin-enriched microdomain formation.
(A) Cartoon model for the formation of higher order oligomers based on the hetero-tetrameric CD9–EWI-F arrangement observed in the cryo-EM data and biochemical interaction studies. (A, B) Top-view model, shown orthogonal to the membrane, of putative linear and circular tetraspanin-enriched `microdomain assemblies based the straight and bent conformations adopted by the CD9–EWI-F complex and the oligomerization model in panel (A).

References

    1. Adams PD, Grosse-Kunstleve RW, Hung L-W, Ioerger TR, McCoy AJ, Moriarty NW, Read RJ, Sacchettini JC, Sauter NK, Terwilliger TC (2002) PHENIX: Building new software for automated crystallographic structure determination. Acta Crystallogr D Biol Crystallogr 58: 1948–1954. 10.1107/S0907444902016657 - DOI - PubMed
    1. André M, Chambrion C, Charrin S, Soave S, Chaker J, Boucheix C, Rubinstein E, Le Naour F (2009) In situ chemical cross-linking on living cells reveals CD9P-1 cis-oligomer at cell surface. J Proteomics 73: 93–102. 10.1016/j.jprot.2009.08.005 - DOI - PubMed
    1. André M, Morelle W, Planchon S, Milhiet PE, Rubinstein E, Mollicone R, Chamot-Rooke J, Le Naour F (2007) Glycosylation status of the membrane protein CD9P-1. Proteomics 7: 3880–3895. 10.1002/pmic.200700355 - DOI - PubMed
    1. Andreu Z, Yáñez-Mó M (2014) Tetraspanins in extracellular vesicle formation and function. Front Immunol 5: 1–12. 10.3389/fimmu.2014.00442 - DOI - PMC - PubMed
    1. Bennett MJ, Choe S, Eisenberg D (1994) Domain swapping: Entangling alliances between proteins. Proc Natl Acad Sci U S A 91: 3127–3131. 10.1073/pnas.91.8.3127 - DOI - PMC - PubMed

Publication types

MeSH terms

LinkOut - more resources