. 2020 Sep 21;3(11):e202000893.
doi: 10.26508/lsa.202000893. Print 2020 Nov.

Human G-MDSCs are neutrophils at distinct maturation stages promoting tumor growth in breast cancer

Affiliations

Human G-MDSCs are neutrophils at distinct maturation stages promoting tumor growth in breast cancer

Meliha Mehmeti-Ajradini et al. Life Sci Alliance. .

Abstract

Myeloid-derived suppressor cells (MDSCs) are known to contribute to immune evasion in cancer. However, the function of the human granulocytic (G)-MDSC subset during tumor progression is largely unknown, and there are no established markers for their identification in human tumor specimens. Using gene expression profiling, mass cytometry, and tumor microarrays, we here demonstrate that human G-MDSCs occur as neutrophils at distinct maturation stages, with a disease-specific profile. G-MDSCs derived from patients with metastatic breast cancer and malignant melanoma display a unique immature neutrophil profile, that is more similar to healthy donor neutrophils than to G-MDSCs from sepsis patients. Finally, we show that primary G-MDSCs from metastatic breast cancer patients co-transplanted with breast cancer cells, promote tumor growth, and affect vessel formation, leading to myeloid immune cell exclusion. Our findings reveal a role for human G-MDSC in tumor progression and have clinical implications also for targeted immunotherapy.


Conflict of interest statement

K Leandersson is a board member of Cantargia AB, a company developing IL1RAP inhibitors. This does not alter the author’s adherence to all guidelines for publication. The authors otherwise declare no competing interest.

Figures

Figure 1.
Figure 1.. The proportion of granulocytic myeloid-derived suppressor cells (G-MDSCs) is increased in patients with metastatic breast cancer (MBC).
(A) An overview of neutrophil maturation in humans, with all cell stages having the CD15+CD33+CD11b+Lin surface phenotype. (B, C) Flow cytometry analysis of freshly isolated PBMCs from healthy controls (HC), patients with MBC, and patients with Gram-positive sepsis. (B, C) Frequency of G-MDSCs (green box in C) among PBMCs (blue box in C) isolated from HC (N = 21), MBC (N = 25), and patients with Gram-positive sepsis (N = 14). Error bars indicate SEM. **P < 0.01, ***P < 0.001. ANOVA with multiple comparisons Kruskal–Wallis test. (C) Dot plots representing the gating and sorting strategy of G-MDSCs (green box) and monocytes (orange box) of PBMCs, with purity after sorting indicated. (D) G-MDSCs from MBC patients are a heterogeneous cell population. Cytospin fractions of sorted G-MDSCs from MBC patients were analyzed by HE staining and IHC. The cells were a morphologically heterogeneous population with blast-like (orange arrow) and PMN (black arrow) nuclei, and, occasionally, banded neutrophils (purple arrow). The frequencies of blasts and PMNs, determined based on the number of cells with the indicated morphology in a microscopy field under 20× magnification is shown. Error bars indicate SEM. *P < 0.05; N = 4; Mann–Whitney test. (E) The sorted G-MDSCs were negative for α-smooth muscle actin and CD68 expression, positive (brown) for CD31 expression, and only sporadically (<1% cells) expressed CD34, as determined by IHC.
Figure S1.
Figure S1.. Phenotype of human granulocytic myeloid-derived suppressor cells (G-MDSCs).
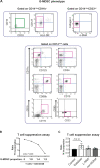
(A) Flow cytometry dot plots of a representative metastatic breast cancer (MBC) patient blood sample showing cell surface and intracellular markers typical for MDSCs. (B) T-cell suppression assay evaluating the immunosuppressive capacity of G-MDSCs. The assay involved allogeneic T cells, stimulating CD3/CD28 Dynabeads, and sorted MBC patient G-MDSCs, co-cultured for 7 d. T cells only, negative control (dashed line). One representative patient sample is shown. (C) G-MDSCs suppress T-cell proliferation via ROS production. T cells stimulated by allogeneic CD3/CD28 and cultured together with sorted G-MDSCs from MBC patients (at 1:2 to 1:4 ratio). T-cell proliferation was increased upon the addition of a chemical ROS inhibitor (catalase) but not after the addition of iNOS (L-NNA) or ARG (nor-NOHA) inhibitors. N = 3. *P < 0.05; ANOVA with Dunn’s with multiple comparison test. Error bars represent SEM.
Figure 2.
Figure 2.. Gene expression profiles of granulocytic myeloid-derived suppressor cells (G-MDSCs) from metastatic breast cancer (MBC) patients are similar to those of neutrophils from healthy donors.
(A) Hierarchical clustering (method average) of gene expression profiles of MBC patient G-MDSCs (MBC 1–3), sepsis patient G-MDSCs (Sepsis 1–3), healthy control neutrophils (HC N 1–2; sample number 3 was excluded because of low RNA yield), and healthy donor monocytes (HC Mo 1–3). Probe sets with a fold-change expression >2 and P < 0.05 between the Sepsis (S) and MBC groups were plotted in Heatmap2 in R. (B) PCA diagram of overlap and significant differences between gene profiles, showing high similarity between MBC patient G-MDSCs (green) and healthy control neutrophils (black), low similarity with Gram-positive sepsis patient G-MDSCs (blue), and no similarity with HC Mo (red). (C) Expression patterns of selected genes. Because N = 2 for HC N samples, no statistical analysis of data was performed in relation to HC N. (D) Volcano plot showing significant differences between sepsis (S) and MBC gene profiles.
Figure 3.
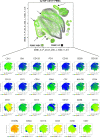
Figure 3.. CyTOF analysis of granulocytic myeloid-derived suppressor cells from metastatic breast cancer (MBC) patients reveals unique cell populations.
(A) Mass cytometry analysis of PBMCs from healthy donors (black N = 2), and patients with MBC (green N = 2), malignant melanoma (M. Mel, red N = 2), and Gram-positive sepsis (blue N = 1). The tSNE plots show CD15+-gated cells (low density granulocytes). The black arrows indicate unique populations associated with cancer patients (MBC and malignant melanoma) that do not overlap with healthy control or sepsis patient CD15+ PBMCs. (B) PBMCs from healthy donors (black) and MBC (green) patients were analyzed by CyTOF. The tSNE plot represents CD15+-gated cells. The black arrows indicate unique populations associated with cancer patients (MBC and malignant melanoma) that do not overlap with healthy control or sepsis patient CD15+ PBMCs. Each plot below the tSNE plot represents a marker, as indicated (see Fig S2 for additional markers); blue color indicates low expression and red color indicates high expression of the indicated marker, in all CD15+-gated cells. Data analysis: 39-parameter data experiments in FlowJo version 10; Perplexity = 20, Eta = 200, Iter = 1,000, Theta = 0.5. Output event = 424,898, down sampled to 30,000 cells.
Figure S2.
Figure S2.. Mass cytometry analysis of granulocytic myeloid-derived suppressor cells from metastatic breast cancer (MBC) patients.
PBMCs from healthy donors (black N = 2) and MBC patients (green N = 2) were analyzed by CyTOF. The tSNE plot shows CD15+-gated cells. The black arrows indicate unique populations associated with cancer patients (MBC and malignant melanoma N = 2) that do not overlap with healthy control or sepsis patient CD15+ PBMCs. Each plot below the tSNE plot represents a marker, as indicated, where blue color indicates low expression and red high expression in all PBMC CD15+-gated cells from MBC. Data analysis: 39-parameter data experiments in FlowJo version 10; Perplexity = 20, Eta = 200, Iter = 1,000, Theta = 0.5. Output event = 424,898, down sampled to 30,000 cells.
Figure 4.
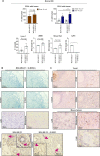
Figure 4.. Granulocytic myeloid-derived suppressor cells (G-MDSCs) from metastatic breast cancer patients co-transplanted with MDA-MB-231 breast cancer cells promote tumor growth and affect vessel formation in vivo.
G-MDSCs from metastatic breast cancer patients (2 × 10⁵ cells/mouse) were co-transplanted with MDA-MB-231 breast cancer cells (2 × 10⁶ cells/mouse) (BC) in immunodeficient Nod scid gamma mice for 21 d. (A) Xenograft tumors consisting of G-MDSC/BC cells were significantly larger than xenograft tumors consisting of only BC cells. N = 4. The black arrows indicate possible sites of hemorrhages, indicating leakage of blood vessels in the G-MDSC co-transplanted tumors only. Error bars indicate SEM. *P < 0.05; Mann–Whitney U-test. (B, C) Tumor sections were stained for the presence of the indicated markers: proliferation marker Ki67, endothelial cell marker CD31, lymphatic endothelial cell marker Lyve-1, activated fibroblast marker α-smooth muscle actin, and the collagen marker Sirius Red. N = 4. Error bars indicate SEM. *P < 0.05; Unpaired t test. (C) Statistical evaluation of expression levels and vessel area from (C) is shown in Fig S3A.
Figure S3.
Figure S3.. Statistical analysis of Nod scid gamma xenografts.
(A) Statistical analysis of the MDA-MB-231 (BC) and G-MDSC/MDA-MB-231 (BC) xenografts (presented in Figs 4 and 5) stained for the presence of the indicated markers. N = 4 for each group. Error bars indicate SEM. Unpaired t test analysis of data for vessels (CD31) with lumen over 10 μm2 (top left; brown), Lyve-1, α smooth muscle actin, Sirius Red, and Ly6C (bottom panels, white). ANOVA with multiple comparisons Holm–Sidak’s test (CD31 with lumen smaller [white] or greater than [blue] 70 μm2 [top right]), unpaired t test or Mann–Whitney test (Ly6C). (B, C) Sections of G-MDSCs/MDA-MB-231 (BC) xenografts stained for the presence of myeloid markers CD11b, CD163, and S100A9, human endothelial cell marker CD31, Ly6G, nitrotyrosine and PDGFRβ where pink arrows indicate pericytes. (C) Positive controls (human tonsil or mouse spleen, panel C) were routinely analyzed in parallel.
Figure S4.
Figure S4.. Gene set enrichment analysis (GSEA) analysis of the tumor cell proliferation and angiogenesis pathways.
(A) Co-culture (48-h) with primary human neutrophils (healthy donor low density granulocytes or high-density granulocytes) did not affect MDA-MB-231 cells in vitro proliferation, as determined by thymidine (3H) incorporation. (B) GSEA enrichment plot of the angiogenesis pathway in granulocytic myeloid-derived suppressor cells (G-MDSCs) isolated from metastatic breast cancer (MBC) patients, as compared with sepsis patient G-MDSCs, healthy control neutrophils, and healthy donor monocytes. (C) Heat map of the angiogenesis pathway in G-MDSCs isolated from MBC patients (MBC 1–3) analyzed by GSEA and compared with the data from sepsis patient G-MDSCs (Sepsis 1–3), healthy control neutrophils (HC N 1–2; sample number 3 was excluded because of low RNA yield), and healthy donor monocytes (HC Mo 1–3). Angiogenesis related genes with statistically higher expression levels in MBC as compared with HC-Mo samples were found and summarized in Table S1. Some genes that were expressed at a significantly higher level in MBC G-MDSCs than in HC-Mo, were angiogenesis inhibitors SPINK5, COL4A2, COL4A3, and NOTCH4; the angiogenesis regulator AMOT; and the proangiogenic factors PROK2 and SHH (Table S1).
Figure 5.
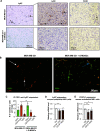
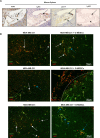
Figure 5.. Human granulocytic myeloid-derived suppressor cells (G-MDSCs) reduce endothelial Ly6C expression and promote immune cell exclusion in mouse model.
(A) IHC analysis of Ly6C levels in xenografts from MDA-MB-231 cells (top) and in MDA-MB-231 grafts co-transplanted with human G-MDSCs (bottom) in Nod scid gamma mice for 21 d. Statistical evaluation of data is shown in Fig S3A. F4/80 mouse macrophage staining is shown as control. (B, C) Ly6C and CD31 IF analysis in xenografts from MDA-MB-231 cells (left) and MDA-MB-231 grafts co-transplanted with human G-MDSCs (right). (C) Green arrow, endothelial vessel (CD31) with no Ly6C co-staining; white solid arrow, endothelial vessel (CD31) co-stained for Ly6C; white dashed arrow, Ly6C+ CD31 myeloid cells infiltrating the tumor; blue dashed arrow, endothelial vessel (CD31) with potential Ly6C+ cells in the vessel lumen (red inside green in C). Statistical evaluation (C) of the IF data from the different xenografts is shown (green = only CD31+ vessels; orange = CD31+Ly6C+ vessels; red = infiltrating myeloid Ly6C+ cell). N = 4. Error bars indicate SEM. **P < 0.01; unpaired t test. (D, E) Relative mRNA levels of mouse Ly6C and CX3CL1 in mouse endothelial MS1 cells co-cultured for 48 h with human CD15+ low-density granulocytes, and in untreated MS1 control cells. N = 5. *P < 0.05, **P < 0.01; paired t test.
Figure S5.
Figure S5.. Immunohistochemistry and immunofluorescence analysis of Ly6C and CD31 in xenografts.
(A) Mouse spleen was stained using antibodies against Ly6C, CD31, Lyve-1, and Ly6G to visualize Ly6C location in the tissue. (B) Immunofluorescence analysis of Ly6C and CD31 in xenografts from MDA-MB-231 cells (left), compared with MDA-MB-231 grafts co-transplanted with human granulocytic myeloid-derived suppressor cells (right). White arrows, endothelial vessels (CD31) that co-stain with Ly6C (orange); white dashed arrows, Ly6C+ myeloid cells (red) infiltrating the tumor; green arrows, endothelial vessels (CD31) that did not co-stain with Ly6C (green); blue dashed arrows, endothelial vessels (CD31) with Ly6C+ cells clearly present in the vessel lumen (red inside green); dashed line, border between tumor and the surrounding stroma; dashed yellow arrow, Ly6C+ myeloid cells that did not infiltrate the tumor and were therefore excluded from analysis.
Figure S6.
Figure S6.. Expression of Ly6C in endothelial cells and CX3CL1 in breast cancer.
(A) Relative mRNA levels of mouse Ly6C in mouse endothelial MS1 cells co-cultured for 48 h with human CD15+ low-density granulocytes (CD15+ LDGs) or CD15+ high-density granulocytes (CD15+ HDGs), with or without the ROS inhibitor catalase, compared with untreated MS1 cells. N = 5. *P < 0.05, **P < 0.01; one-way ANOVA with Holm–Sidak’s multiple comparison test. (B) Correlation between the expression of CX3CL1 and other genes in human breast cancer. In primary human breast cancer, CX3CL1 and OLR1 (a typical granulocytic myeloid-derived suppressor cell gene) mRNA levels are inversely correlated (R = −0.056; P = 0.066), but the correlation is not significant. Data were retrieved from the publicly available database R2 (microarray analysis and visualization platform) (platform).
Figure 6.
Figure 6.. IHC evaluation of CD15+, CD15+MPO+, and CD15+MPO cells in a clinical cohort of primary breast cancers.
(A) CD15+ cells are present in human primary breast tumors (black arrows). (B) CD15+PMN+MPO+ (CD15+MPO+) representing mature neutrophils or PMNs (black arrows), and CD15+PMNMPO (CD15+MPO) cells with a blast-like morphology (yellow arrows) are found in primary human breast tumors. Representative pictures are shown. (C, D, E) Recurrence-free survival of patients, and infiltration of CD15+ cells with or without the mature neutrophil marker MPO and PMN morphology in tumors. A clinical cohort of 144 breast cancer patients was evaluated. CD15+MPO+ cells were considered to be mature neutrophils; CD15+MPO cells with blast-like immature morphology were considered to be immature neutrophils. Log-rank P < 0.05 was considered significant.

References

    1. Afgan E, Baker D, van den Beek M, Blankenberg D, Bouvier D, Cech M, Chilton J, Clements D, Coraor N, Eberhard C, et al. (2016) The galaxy platform for accessible, reproducible and collaborative biomedical analyses: 2016 update. Nucleic Acids Res 44: W3–W10. 10.1093/nar/gkw343 - DOI - PMC - PubMed
    1. Allaoui R, Bergenfelz C, Mohlin S, Hagerling C, Salari K, Werb Z, Anderson RL, Ethier SP, Jirstrom K, Pahlman S, et al. (2016) Cancer-associated fibroblast-secreted CXCL16 attracts monocytes to promote stroma activation in triple-negative breast cancers. Nat Commun 7: 13050 10.1038/ncomms13050 - DOI - PMC - PubMed
    1. Andzinski L, Kasnitz N, Stahnke S, Wu CF, Gereke M, von Kockritz-Blickwede M, Schilling B, Brandau S, Weiss S, Jablonska J (2016) Type I IFNs induce anti-tumor polarization of tumor associated neutrophils in mice and human. Int J Cancer 138: 1982–1993. 10.1002/ijc.29945 - DOI - PubMed
    1. Bacac M, Stamenkovic I (2008) Metastatic cancer cell. Annu Rev Pathol 3: 221–247. 10.1146/annurev.pathmechdis.3.121806.151523 - DOI - PubMed
    1. Baumgart S, Peddinghaus A, Schulte-Wrede U, Mei HE, Grutzkau A (2017) OMIP-034: Comprehensive immune phenotyping of human peripheral leukocytes by mass cytometry for monitoring immunomodulatory therapies. Cytometry A 91: 34–38. 10.1002/cyto.a.22894 - DOI - PubMed

Publication types

MeSH terms