

Decoding the mystery of American pain reveals a warning for the future
- PMID: 32958666
- PMCID: PMC7547221
- DOI: 10.1073/pnas.2012350117
Decoding the mystery of American pain reveals a warning for the future
Abstract
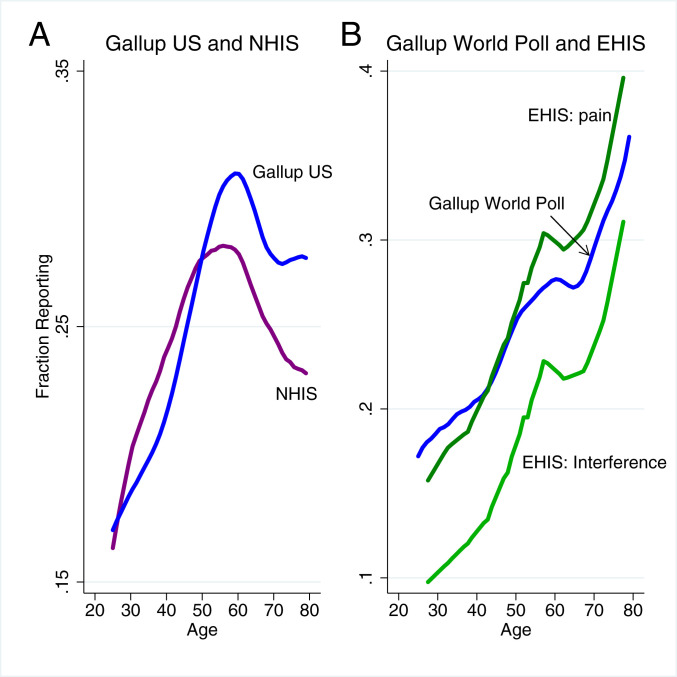
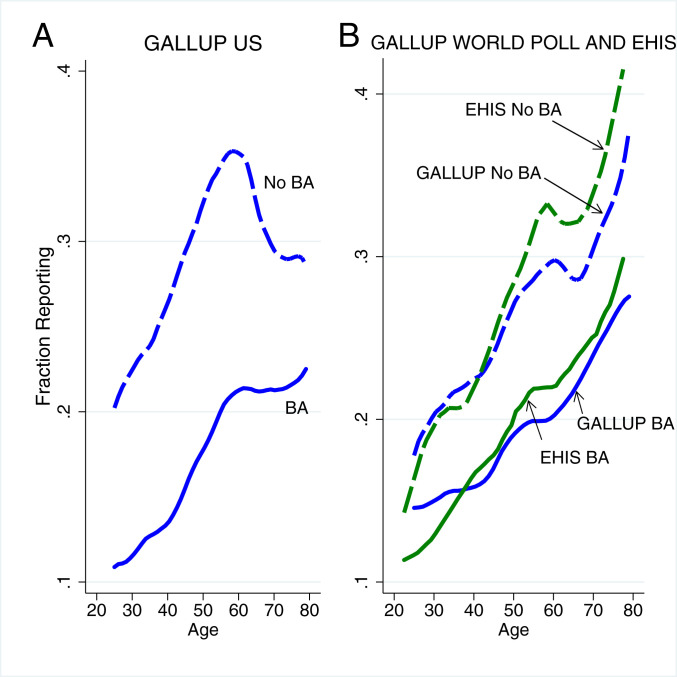
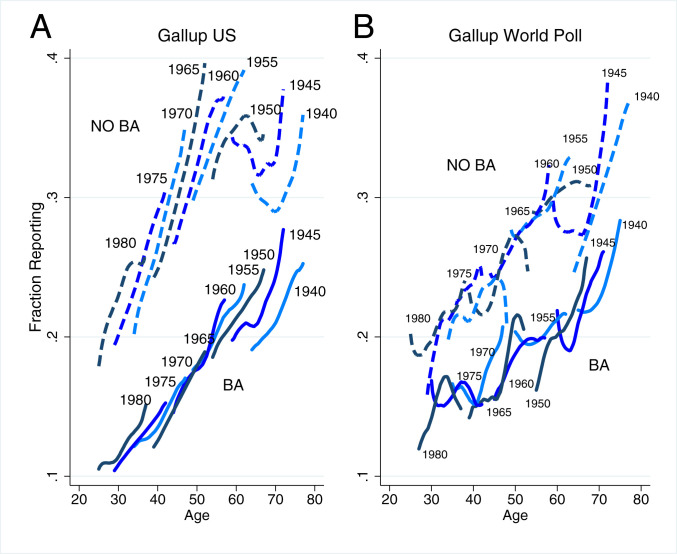
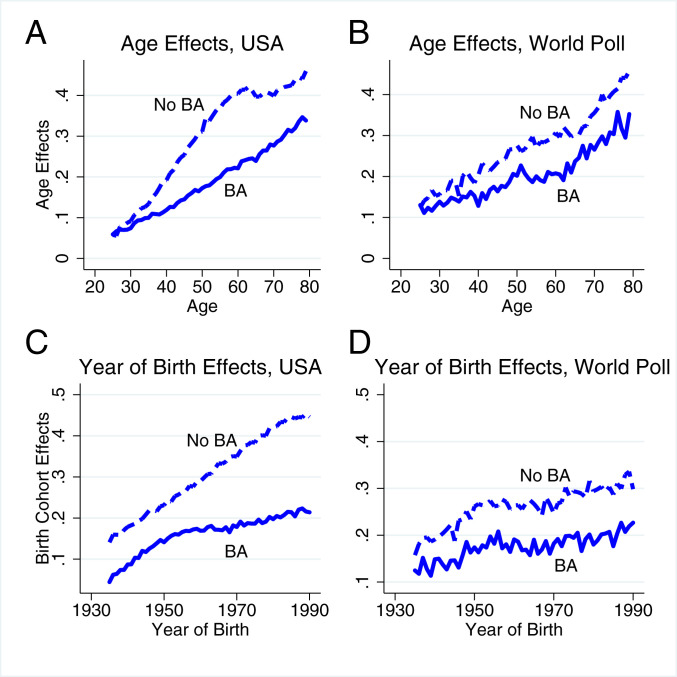
There is an expectation that, on average, pain will increase with age, through accumulated injury, physical wear and tear, and an increasing burden of disease. Consistent with that expectation, pain rises with age into old age in other wealthy countries. However, in America today, the elderly report less pain than those in midlife. This is the mystery of American pain. Using multiple datasets and definitions of pain, we show today's midlife Americans have had more pain throughout adulthood than did today's elderly. Disaggregating the cross-section of ages by year of birth and completion of a bachelor's degree, we find, for those with less education, that each successive birth cohort has a higher prevalence of pain at each age-a result not found for those with a bachelor's degree. Thus, the gap in pain between the more and less educated has widened in each successive birth cohort. The increase seen across birth cohorts cannot be explained by changes in occupation or levels of obesity for the less educated, but fits a more general pattern seen in the ongoing erosion of working-class life for those born after 1950. If these patterns continue, pain prevalence will continue to increase for all adults; importantly, tomorrow's elderly will be sicker than today's elderly, with potentially serious implications for healthcare.
Keywords: birth cohort analysis; educational divide; international comparison; pain prevalence.
Copyright © 2020 the Author(s). Published by PNAS.
Conflict of interest statement
Competing interest statement: A.D. and A.A.S. are Senior Scientists with Gallup, Inc. A.A.S. is a consultant with Adelphi Values, Inc.
Figures
Comment in
-
America in pain, the nation's well-being at stake.Proc Natl Acad Sci U S A. 2020 Oct 27;117(43):26559-26561. doi: 10.1073/pnas.2018650117. Epub 2020 Oct 19. Proc Natl Acad Sci U S A. 2020. PMID: 33077584 Free PMC article. No abstract available.
Similar articles
-
Further decoding the mystery of American pain: The importance of work.PLoS One. 2022 Jan 13;17(1):e0261891. doi: 10.1371/journal.pone.0261891. eCollection 2022. PLoS One. 2022. PMID: 35025882 Free PMC article.
-
Age, education, and changes in the Mini-Mental State Exam scores of older women: findings from the Nun Study.J Am Geriatr Soc. 1996 Jun;44(6):675-81. doi: 10.1111/j.1532-5415.1996.tb01831.x. J Am Geriatr Soc. 1996. PMID: 8642159
-
The coming epidemic of obesity in elderly Americans.J Am Geriatr Soc. 2004 Nov;52(11):1907-12. doi: 10.1111/j.1532-5415.2004.52517.x. J Am Geriatr Soc. 2004. PMID: 15507070
-
Lifetime earnings patterns, the distribution of future Social Security benefits, and the impact of pension reform.Soc Secur Bull. 2000;63(4):74-98. Soc Secur Bull. 2000. PMID: 11641991
-
Bachelor's Degree Nurse Graduates Report Better Quality and Safety Educational Preparedness than Associate Degree Graduates.Jt Comm J Qual Patient Saf. 2019 Mar;45(3):180-186. doi: 10.1016/j.jcjq.2018.08.008. Epub 2018 Oct 15. Jt Comm J Qual Patient Saf. 2019. PMID: 30337145
Cited by
-
Trends in Health in Midlife and Late Life.J Hum Cap. 2022 Spring;16(1):133-156. doi: 10.1086/717542. Epub 2022 Jan 25. J Hum Cap. 2022. PMID: 35419119 Free PMC article.
-
Association of globalization with the burden of opioid use disorders 2019. A country-level analysis using targeted maximum likelihood estimation.Global Health. 2023 Oct 16;19(1):76. doi: 10.1186/s12992-023-00980-3. Global Health. 2023. PMID: 37845722 Free PMC article.
-
Are employment and social integration more strongly associated with deaths of despair than psychological or economic distress?Soc Sci Med. 2024 Sep;357:117197. doi: 10.1016/j.socscimed.2024.117197. Epub 2024 Aug 8. Soc Sci Med. 2024. PMID: 39153233 Free PMC article.
-
Association of Opioid Use Disorder With 2016 Presidential Voting Patterns: Cross-sectional Study in New York State at Census Tract Level.JMIR Public Health Surveill. 2021 Apr 21;7(4):e23426. doi: 10.2196/23426. JMIR Public Health Surveill. 2021. PMID: 33881409 Free PMC article.
-
Varied and unexpected changes in the well-being of seniors in the United States amid the COVID-19 pandemic.PLoS One. 2021 Jun 17;16(6):e0252962. doi: 10.1371/journal.pone.0252962. eCollection 2021. PLoS One. 2021. PMID: 34138938 Free PMC article.
References
-
- Institute of Medicine (US), Committee on Advancing Pain Research Care and Education , Relieving Pain in America: A Blueprint for Transforming Prevention, Care, Education, and Research, (National Academies Press, Washington, DC, 2011). - PubMed
-
- McGreal C., American Overdose: The Opioid Tragedy in Three Acts, (Public Affairs, New York, ed. 1, 2018).
-
- Case A., Deaton A., “Suicide, age, and wellbeing: an empirical investigation” in Insights in the Economics of Aging, Wise D., Ed. (University of Chicago Press, Chicago, 2017), pp. 307–334.
Publication types
MeSH terms
Grants and funding
LinkOut - more resources
Full Text Sources
Medical
Miscellaneous
