. 2020 Oct 26;133(20):jcs244855.
doi: 10.1242/jcs.244855.

Stbd1 promotes glycogen clustering during endoplasmic reticulum stress and supports survival of mouse myoblasts

Affiliations

Stbd1 promotes glycogen clustering during endoplasmic reticulum stress and supports survival of mouse myoblasts

Andria A Lytridou et al. J Cell Sci. .

Abstract

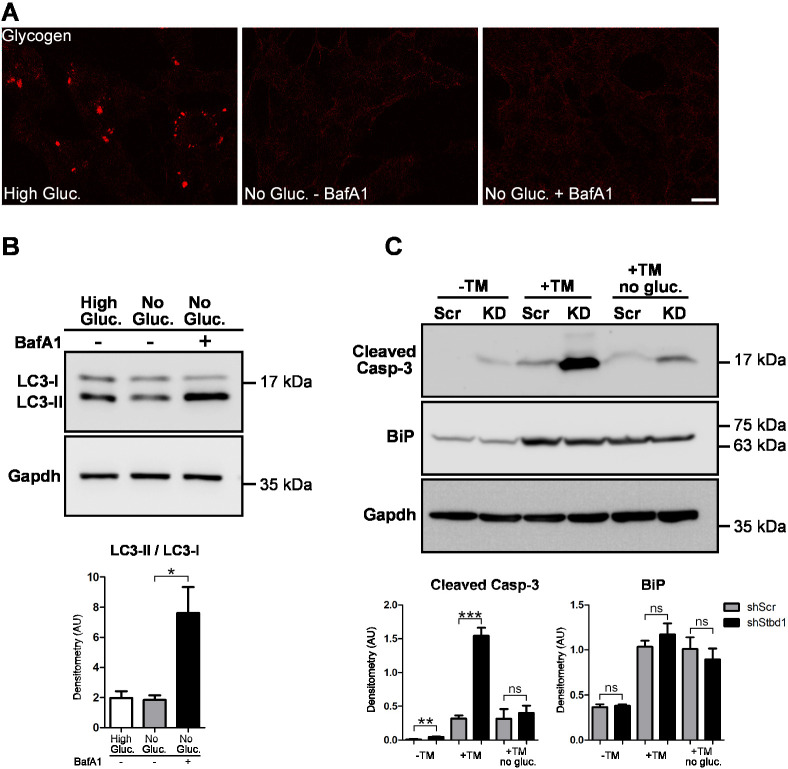
Imbalances in endoplasmic reticulum (ER) homeostasis provoke a condition known as ER stress and activate the unfolded protein response (UPR) pathway, an evolutionarily conserved cell survival mechanism. Here, we show that mouse myoblasts respond to UPR activation by stimulating glycogenesis and the formation of α-amylase-degradable, glycogen-containing ER structures. We demonstrate that the glycogen-binding protein Stbd1 is markedly upregulated through the PERK signalling branch of the UPR pathway and is required for the build-up of glycogen structures in response to ER stress activation. In the absence of ER stress, Stbd1 overexpression is sufficient to induce glycogen clustering but does not stimulate glycogenesis. Glycogen structures induced by ER stress are degraded under conditions of glucose restriction through a process that does not depend on autophagosome-lysosome fusion. Furthermore, we provide evidence that failure to induce glycogen clustering during ER stress is associated with enhanced activation of the apoptotic pathway. Our results reveal a so far unknown response of mouse myoblasts to ER stress and uncover a novel specific function of Stbd1 in this process, which may have physiological implications during myogenic differentiation.This article has an associated First Person interview with the first author of the paper.

Keywords: Apoptosis; ER stress; Glycogen; Glycogen synthase; Glycogenin; UPR.


Conflict of interest statement

Competing interestsThe authors declare no competing or financial interests.

Figures

Fig. 1.
Fig. 1.
ER stress activation induces glycogenesis and the formation of glycogen-containing ER structures. (A) Representative immunofluorescence images of C2C12 myoblasts treated with TM or DMSO (control) and stained for glycogen and Stbd1. TM-treated cells display prominent glycogen structures that strongly coincide with Stbd1 (overlay) [mean±s.e.m. Manders’ colocalization coefficient (MCC), 0.746±0.032; n=10]. DMSO-treated controls occasionally display smaller Stbd1-positive glycogen structures (arrowheads) (MCC, 0.615±0.025; n=6). (B) Glycogen quantification in DMSO- and TM-treated C2C12 myoblasts revealed that ER stress activation stimulates glycogen synthesis (mean±s.e.m. μg glucose/mg protein: DMSO-treated, 0.55±0.20; TM-treated, 9.56±0.74; n=3). ***P≤0.001 (one-tailed unpaired Student's t-test). (C) Representative images of TM- and DMSO-treated C2C12 myoblasts immunostained with the indicated antibodies. In addition to positive Stbd1 immunostaining, both the ER stress-induced glycogen structures and those sporadically present in DMSO-treated controls (arrowheads) stain positive for GS1 (MCC: TM-treated, 0.785±0.012, n=10; DMSO-treated, 0.565±0.052, n=7), GN (MCC: TM-treated, 0.791±0.011, n=10; DMSO-treated, 0.703±0.025, n=8) as well as calnexin (MCC: TM-treated, 0.752±0.019, n=10; DMSO-treated, 0.763±0.040, n=7) but not Lamp1 (MCC: TM-treated, 0.047±0.010, n=10; DMSO-treated, 0.028±0.009, n=10). Inserts show single stainings at higher magnification for the corresponding areas indicated by dashed boxes. (D–F) Transmission electron micrographs of TM- (D,E) and DMSO- treated (F) C2C12 cells. TM-treated cells display prominent membrane-free glycogen structures not present in DMSO-treated control cells. A higher magnification image of the boxed area in D is shown in E. Scale bars: 20 μm (A,C), 2 μm (D,F), 1 μm (E).
Fig. 2.
Fig. 2.
ER stress-induced structures contain α-amylase-degradable glycogen. TM-treated C2C12 cells were incubated either in the absence (A) or presence (B) of α-amylase and double-stained for Stbd1 (green) and glycogen, GS1 or GN (red). α-amylase treatment resulted in glycogen depletion from the ER stress-induced structures, which still displayed positive immunostaining for Stbd1 [mean±s.e.m. Manders’ colocalization coefficient (MCC): −α-amylase, 0.675±0.008, n=10; +α-amylase, 0.022±0.006, n=10], GS1 (MCC: 0.661±0.031, n=10) and GN (MCC: 0.528±0.025, n=10). Overlays are shown as inserts and represent higher magnifications of the indicated boxed areas. Representative images are shown. Scale bar: 20 μm.
Fig. 3.
Fig. 3.
Stbd1 is upregulated in response to ER stress and is required for the formation of glycogen structures. (A) Western blot (top) and densitometry (bottom; mean±s.e.m., n=3) of protein extracts from C2C12 myoblasts collected after 0, 4, 8 or 16 h of TM treatment, showing prominent upregulation of Stbd1. Induction of ER stress was verified by the increase in BiP protein levels, and Gapdh was used as a loading control. (B) Western immunoblot (top) and densitometry (bottom; mean±s.e.m., n=3) for the assessment of Stbd1 silencing efficiency. Protein extracts from non-transduced controls (C2C12) and C2C12 myoblasts expressing either a scrambled (shScr) or a Stbd1-specific (shStbd1) shRNA sequence were prepared in the absence (−) or presence of TM treatment (+) and probed for Stbd1. Non-transduced and shScr cells display increased Stbd1 protein levels following ER stress activation, in contrast to shStbd1 cells. BiP was employed to evaluate ER stress activation, and Gapdh was used as a loading control. (C) Representative images of shScr and shStbd1 cells immunostained for glycogen after TM treatment. Stbd1 silencing impairs the formation of ER stress-induced glycogen clusters. (D) Quantification of glycogen levels in controls (non-transduced and shScr) and shStbd1 cells after treatment with DMSO (−) or TM (+), revealed no statistically significant difference (mean±s.e.m. μg glucose/mg protein: DMSO C2C12, 0.24±0.07; TM C2C12, 6.55±1.05; DMSO shScr, 0.23±0.11; TM shScr, 7.01±0.92; DMSO shStbd1, 0.17±0.08; TM shStbd1, 4.62±1.16; n=3). (E) Representative images of sh3′UTR C2C12 cells transiently transfected with the indicated vectors and immunostained for Myc and glycogen. Glycogen clustering is restored in cells transiently overexpressing Stbd1–Myc [mean±s.e.m. Manders’ colocalization coefficient (MCC): 0.800±0.026, n=10] or the W188A/V191A–Myc AIM mutant (MCC: 0.716±0.033, n=10) but not W273G–Myc (MCC: 0.051±0.014, n=10). Inserts show single stainings of the corresponding boxed areas at higher magnification. *P≤0.05; **P≤0.01; ns, not significant (one-tailed unpaired Student's t-test). Scale bars: 20 μm.
Fig. 4.
Fig. 4.
ER stress-induced Stbd1 upregulation and glycogen clustering depends on PERK signalling. C2C12 cells were either left untreated (−) or cultured with TM (+) in the absence or presence of inhibitors of the individual UPR branches. (A) mRNA expression levels of representative UPR marker genes as assessed by qPCR. Data represent mean±s.e.m. of three independent experiments each performed in triplicate. (B) Representative images of double immunostaining for Stbd1 and glycogen revealed the lack of ER stress-induced, Stbd1-positive glycogen structures in the presence of the PERK inhibitor GSK2606414 [mean±s.e.m. Manders’ colocalization coefficient (MCC): no inhibitor, 0.870±0.011, n=10; 4μ8C, 0.768±0.021, n=10; AEBSF, 0.721±0.019, n=10]. Single stainings are shown as inserts representing higher magnifications of the corresponding boxed areas. (C) Western blot (top) and densitometry (bottom; mean±s.e.m., n=3) of protein extracts from cells treated as described above confirms the lack of ER stress-induced Stbd1 upregulation in the presence of the selective PERK inhibitor and a partial inhibition with AEBSF. Gapdh is shown as a loading control. *P≤0.05; **P≤0.01; ns, not significant (one-tailed unpaired Student's t-test). Scale bar: 20 μm.
Fig. 5.
Fig. 5.
Stbd1 overexpression is sufficient to induce glycogen clustering in the absence of ER stress but does not stimulate glycogenesis. (A) Representative images of C2C12 myoblasts stably overexpressing mouse Stbd1 (C2C12/Stbd1) or GFP as control (C2C12/GFP), stained using the indicated antibodies. C2C12/Stbd1 cells display large glycogen clusters that resemble those induced by ER stress and stain positive for Stbd1 [mean±s.e.m. Manders’ colocalization coefficient (MCC): 0.796±0.014, n=10], GS1 (MCC: 0.792±0.019, n=10), GN (MCC: 0.745±0.014, n=10), calnexin (MCC: 0.774±0.013, n=10) but not Lamp1 (MCC: 0.089±0.005, n=10). C2C12/GFP controls sporadically display smaller structures (arrowheads), with similar immunofluorescence staining for the above markers (MCC: Stbd1, 0.570±0.044, n=10; GS1, 0.618±0.021, n=8; GN, 0.518±0.033, n=8; calnexin, 0.646±0.053, n=5; Lamp1, 0.035±0.015, n=7). Inserts show single stainings of the corresponding boxed areas at higher magnification. (B) Western blot (top) and densitometry (bottom; mean±s.e.m., n=3) of protein lysates from C2C12/GFP and C2C12/Stbd1 cells confirms Stbd1 overexpression and the absence of ER stress activation in C2C12/Stbd1 cells, as assessed by BiP protein levels. Gapdh is shown as a loading control. (C) Quantification of intracellular glycogen levels in non-transduced C2C12, C2C12/GFP and C2C12/Stbd1 cells. Glycogen content in Stbd1-overexpressing cells is not statistically different from that of controls (mean±s.e.m, μg glucose/mg protein: C2C12, 1.56±0.27; C2C12/GFP, 1.87±0.30; C2C12/Stbd1, 2.27±0.60; n=3). ***P≤0.001; ns, not significant (one-tailed unpaired Student's t-test). Scale bar: 20 μm.
Fig. 6.
Fig. 6.
Stbd1 is not required for PTG-induced glycogen accumulation. (A) C2C12 myoblasts transiently transfected with PTG–Myc and immunostained with the indicated antibodies. PTG overexpression induces the build-up of glycogen clusters strongly colocalizing with PTG [mean±s.e.m. Manders’ colocalization coefficient (MCC): 0.775±0.023, n=10]. PTG-induced glycogen structures do not display any detectable Stbd1 (MCC: 0.024±0.006, n=10) or GS1 (MCC: 0.114±0.012, n=10) immunofluorescence; however, they stain weakly positive for GN (MCC: 0.624±0.013, n=10). No colocalization is observed with calnexin (MCC: 0.009±0.003, n=10) or Lamp1 (MCC: 0.067±0.010, n=10). (B) shScr and shStbd1 C2C12 cells transiently transfected with PTG–Myc and double stained for the indicated antibodies. PTG overexpression induces the formation of glycogen structures in the absence of Stbd1 (MCC: shScr, 0.658±0.022, n=10; shStbd1, 0.784±0.029, n=10) which do not coincide with calnexin (MCC: shScr, 0.014±0.002, n=10; shStbd1, 0.107±0.018, n=10). In A and B, representative images are shown. Asterisks indicate non-transfected cells. Inserts show single stainings of the corresponding boxed areas at higher magnification. (C) mRNA expression levels of Ppp1r3c in TM-treated (+) and Stbd1-overexpressing C2C12 myoblasts, as compared to controls [non-treated (−) and GFP-overexpressing cells, respectively]. Data represent mean±s.e.m. of four independent experiments each performed in triplicate. ns, not significant (one-tailed unpaired Student's t-test). Scale bars: 20 μm.
Fig. 7.
Fig. 7.
ER stress-induced glycogen structures are degraded under conditions of glucose restriction. C2C12 myoblasts were treated with TM for 16 h and cultured for an additional 6 h in medium containing either high (25 mM), low (5 mM) or no glucose, in the absence of TM. Representative images of double immunofluorescence staining for glycogen and Stbd1 are shown. Compared to the glycogen clusters in cells cultured in high-glucose medium, ER stress-induced structures appear smaller under low-glucose conditions and were almost completely devoid of glycogen in the absence of glucose. Despite the near-complete degradation of glycogen under glucose-free conditions, structures induced by ER stress displayed positive immunostaining for Stbd1 [mean±s.e.m. Manders’ colocalization coefficient (MCC): high glucose, 0.764±0.018, n=10; low glucose, 0.772±0.013, n=10; no glucose, 0.202±0.045, n=10]. Overlays are shown as inserts and represent higher magnification of the corresponding boxed areas. Scale bar: 20 μm.
Fig. 8.
Fig. 8.
Formation of glycogen-containing clusters is associated with enhanced cell survival during ER stress. (A) Representative immunofluorescence staining for glycogen performed on C2C12 myoblasts treated with TM for 16 h followed by TM withdrawal and additional culturing for 6 h in either medium containing 25 mM glucose (high gluc.) or glucose-free medium in the absence (no gluc.−BafA1) or presence (no gluc.+BafA1) of BafA1. ER stress-induced glycogen is resolved in the presence of BafA1. (B) Western blot (top) and densitometry (bottom; mean±s.e.m., n=3) of lysates from C2C12 cells treated as described above and probed for LC3 revealed elevated LC3-II/LC3-I ratio in the presence of BafA1, thus confirming inhibition of autophagic flux. Gapdh is shown as a loading control. (C) Western blot (top) and densitometry (bottom; mean±s.e.m., n=3) of protein lysates from shScr and shStbd1 (KD) C2C12 cells at basal conditions (−TM), after 16 h of TM treatment (+TM) or after 16 h of TM treatment followed by TM withdrawal and culturing for 6 h in glucose-free medium (+TM no gluc.) reveals significantly elevated cleaved Casp-3 protein levels in shStbd1 cells, particularly after TM treatment. ER stress activation by TM was confirmed by monitoring the protein levels of BiP. Gapdh is shown as a loading control. *P≤0.05; **P≤0.01; ***P≤0.001; ns, not significant (one-tailed unpaired Student's t-test). Scale bar: 20 μm.

References

    1. Acosta-Alvear D., Zhou Y., Blais A., Tsikitis M., Lents N. H., Arias C., Lennon C. J., Kluger Y. and Dynlacht B. D. (2007). XBP1 controls diverse cell type- and condition-specific transcriptional regulatory networks. Mol. Cell 27, 53-66. 10.1016/j.molcel.2007.06.011 - DOI - PubMed
    1. Axten J. M., Medina J. R., Feng Y., Shu A., Romeril S. P., Grant S. W., Li W. H., Heerding D. A., Minthorn E., Mencken T. et al. (2012). Discovery of 7-methyl-5-(1-{[3-(trifluoromethyl)phenyl]acetyl}-2,3-dihydro-1H-indol-5-yl)-7H-p yrrolo[2,3-d]pyrimidin-4-amine (GSK2606414), a potent and selective first-in-class inhibitor of protein kinase R (PKR)-like endoplasmic reticulum kinase (PERK). J. Med. Chem. 55, 7193-7207. 10.1021/jm300713s - DOI - PubMed
    1. Baba O. (1993). Production of monoclonal antibody that recognizes glycogen and its application for immunohistochemistry. Kokubyo Gakkai Zasshi 60, 264-287. 10.5357/koubyou.60.264 - DOI - PubMed
    1. Bravo R., Vicencio J. M., Parra V., Troncoso R., Munoz J. P., Bui M., Quiroga C., Rodriguez A. E., Verdejo H. E., Ferreira J. et al. (2011). Increased ER-mitochondrial coupling promotes mitochondrial respiration and bioenergetics during early phases of ER stress. J. Cell Sci. 124, 2143-2152. 10.1242/jcs.080762 - DOI - PMC - PubMed
    1. Calfon M., Zeng H., Urano F., Till J. H., Hubbard S. R., Harding H. P., Clark S. G. and Ron D. (2002). IRE1 couples endoplasmic reticulum load to secretory capacity by processing the XBP-1 mRNA. Nature 415, 92-96. 10.1038/415092a - DOI - PubMed

Publication types