

The type of stress matters: repeated injection and permanent social isolation stress in male mice have a differential effect on anxiety- and depressive-like behaviours, and associated biological alterations
- PMID: 32958745
- PMCID: PMC7505042
- DOI: 10.1038/s41398-020-01000-3
The type of stress matters: repeated injection and permanent social isolation stress in male mice have a differential effect on anxiety- and depressive-like behaviours, and associated biological alterations
Abstract
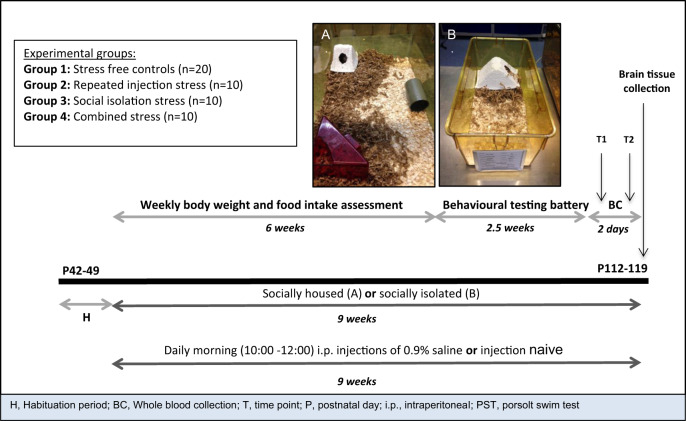
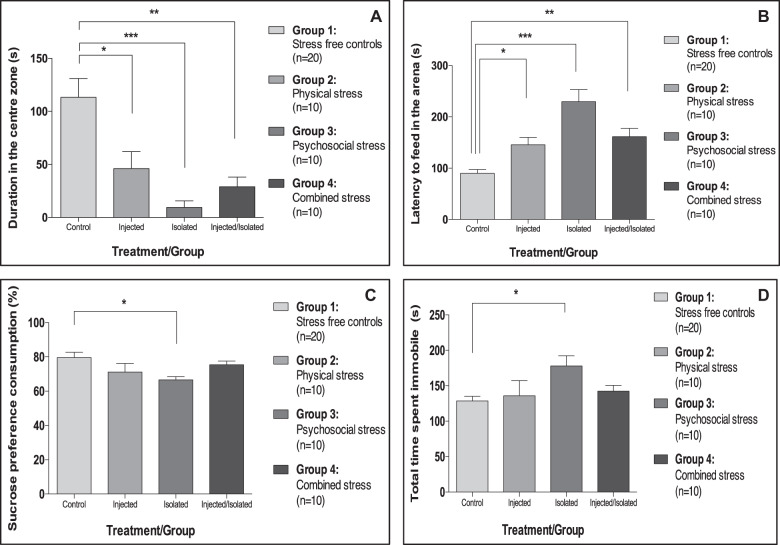
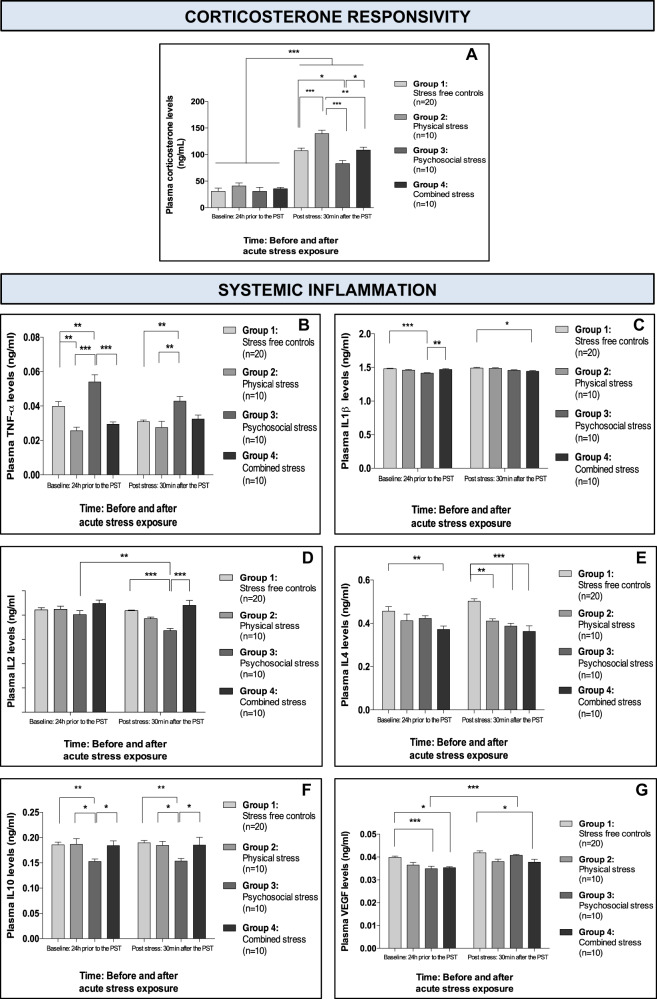
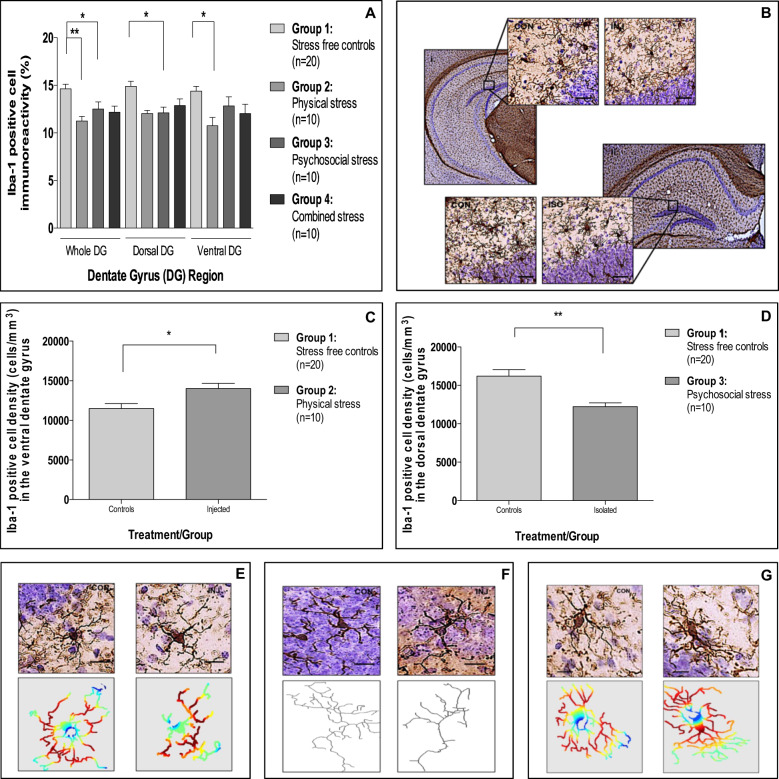
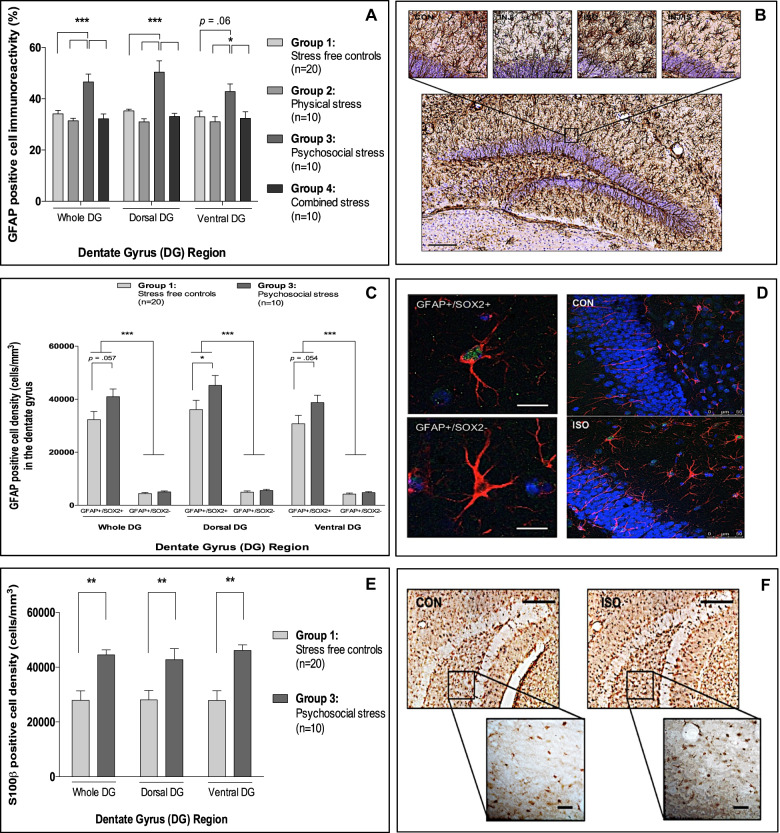
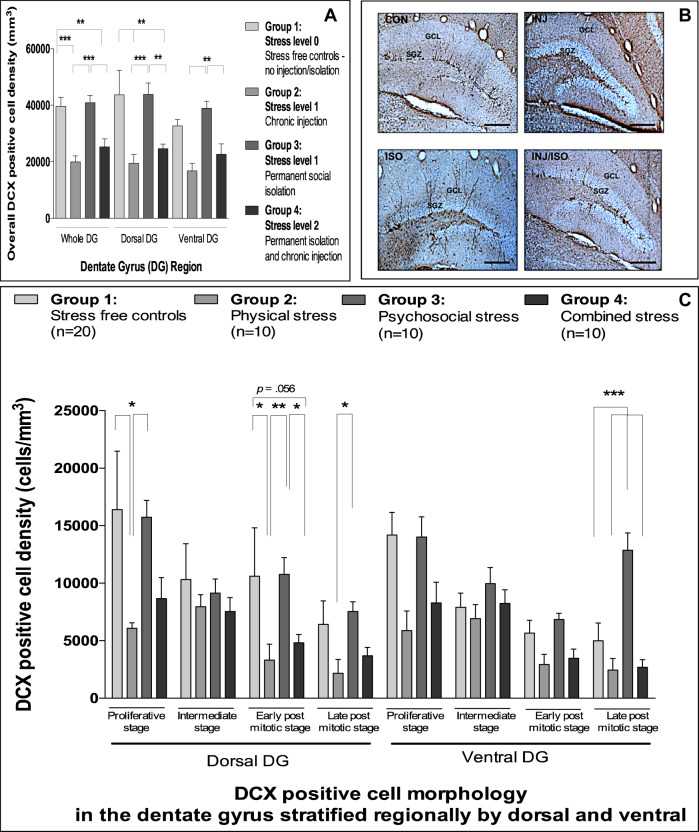
Chronic stress can alter the immune system, adult hippocampal neurogenesis and induce anxiety- and depressive-like behaviour in rodents. However, previous studies have not discriminated between the effect(s) of different types of stress on these behavioural and biological outcomes. We investigated the effect(s) of repeated injection vs. permanent social isolation on behaviour, stress responsivity, immune system functioning and hippocampal neurogenesis, in young adult male mice, and found that the type of stress exposure does indeed matter. Exposure to 6 weeks of repeated injection resulted in an anxiety-like phenotype, decreased systemic inflammation (i.e., reduced plasma levels of TNFα and IL4), increased corticosterone reactivity, increased microglial activation and decreased neuronal differentiation in the dentate gyrus (DG). In contrast, exposure to 6 weeks of permanent social isolation resulted in a depressive-like phenotype, increased plasma levels of TNFα, decreased plasma levels of IL10 and VEGF, decreased corticosterone reactivity, decreased microglial cell density and increased cell density for radial glia, s100β-positive cells and mature neuroblasts-all in the DG. Interestingly, combining the two distinct stress paradigms did not have an additive effect on behavioural and biological outcomes, but resulted in yet a different phenotype, characterized by increased anxiety-like behaviour, decreased plasma levels of IL1β, IL4 and VEGF, and decreased hippocampal neuronal differentiation, without altered neuroinflammation or corticosterone reactivity. These findings demonstrate that different forms of chronic stress can differentially alter both behavioural and biological outcomes in young adult male mice, and that combining multiple stressors may not necessarily cause more severe pathological outcomes.
Conflict of interest statement
The authors declare that they have no conflict of interest.
Figures
Similar articles
-
Chronic stress followed by social isolation promotes depressive-like behaviour, alters microglial and astrocyte biology and reduces hippocampal neurogenesis in male mice.Brain Behav Immun. 2021 Jan;91:24-47. doi: 10.1016/j.bbi.2020.07.015. Epub 2020 Aug 2. Brain Behav Immun. 2021. PMID: 32755644
-
Stress-Induced Anxiety- and Depressive-Like Phenotype Associated with Transient Reduction in Neurogenesis in Adult Nestin-CreERT2/Diphtheria Toxin Fragment A Transgenic Mice.PLoS One. 2016 Jan 21;11(1):e0147256. doi: 10.1371/journal.pone.0147256. eCollection 2016. PLoS One. 2016. PMID: 26795203 Free PMC article.
-
Allopregnanolone regulates neurogenesis and depressive/anxiety-like behaviour in a social isolation rodent model of chronic stress.Neuropharmacology. 2012 Dec;63(8):1315-26. doi: 10.1016/j.neuropharm.2012.08.012. Epub 2012 Aug 23. Neuropharmacology. 2012. PMID: 22939998
-
Do different types of stress differentially alter behavioural and neurobiological outcomes associated with depression in rodent models? A systematic review.Front Neuroendocrinol. 2021 Apr;61:100896. doi: 10.1016/j.yfrne.2020.100896. Epub 2020 Dec 24. Front Neuroendocrinol. 2021. PMID: 33359461
-
Acute and long-term effects of adolescence stress exposure on rodent adult hippocampal neurogenesis, cognition, and behaviour.Mol Psychiatry. 2023 Oct;28(10):4124-4137. doi: 10.1038/s41380-023-02229-2. Epub 2023 Aug 23. Mol Psychiatry. 2023. PMID: 37612364 Free PMC article.
Cited by
-
Cause or consequence? Understanding the role of cortisol in the increased inflammation observed in depression.Curr Opin Endocr Metab Res. 2022 Jun;24:100356. doi: 10.1016/j.coemr.2022.100356. Curr Opin Endocr Metab Res. 2022. PMID: 35634363 Free PMC article.
-
Chronic 17β-estradiol treatment improves negative valence, anhedonic profile, and social interactions in ovariectomized, middle-aged female rats.Front Behav Neurosci. 2025 Jul 2;19:1553501. doi: 10.3389/fnbeh.2025.1553501. eCollection 2025. Front Behav Neurosci. 2025. PMID: 40672384 Free PMC article.
-
Comparison of the effect of postweaning social isolation, enriched environment, and exercise training on learning and memory functions in rats.Turk J Med Sci. 2023 Jun 21;53(5):1412-1420. doi: 10.55730/1300-0144.5708. eCollection 2023. Turk J Med Sci. 2023. PMID: 38812994 Free PMC article.
-
Comparative Perspectives on Neuropeptide Function and Social Isolation.Biol Psychiatry. 2025 May 15;97(10):942-952. doi: 10.1016/j.biopsych.2025.01.019. Epub 2025 Jan 30. Biol Psychiatry. 2025. PMID: 39892690 Review.
-
Exploring the association between loneliness, work environment, and depressive symptoms: evidence from young Korean workers in the Seoul Metropolitan Area.Front Public Health. 2025 May 30;13:1593957. doi: 10.3389/fpubh.2025.1593957. eCollection 2025. Front Public Health. 2025. PMID: 40520319 Free PMC article.
References
-
- Möller M, et al. Social isolation rearing induces mitochondrial, immunological, neurochemical and behavioural deficits in rats, and is reversed by clozapine or N-acetyl cysteine. Brain Behav. Immun. 2013;30:156–167. - PubMed
-
- Xue J, et al. Menthone confers antidepressant-like effects in an unpredictable chronic mild stress mouse model via NLRP3 inflammasome-mediated inflammatory cytokines and central neurotransmitters. Pharm. Biochem Behav. 2015;134:42–48. - PubMed
-
- Liu X, et al. Effects of group housing on stress induced emotional and neuroendocrine alterations. Brain Res. 2013;1502:71–80. - PubMed
-
- Zhuang F, et al. Cytokines and glucocorticoid receptors are associated with the antidepressant-like effect of alarin. Peptides. 2016;76:115–129. - PubMed
Publication types
MeSH terms
Substances
Grants and funding
LinkOut - more resources
Full Text Sources
