. 2020 Sep 21;11(1):4768.
doi: 10.1038/s41467-020-18547-w.

Optical imaging of single-protein size, charge, mobility, and binding

Affiliations

Optical imaging of single-protein size, charge, mobility, and binding

Guangzhong Ma et al. Nat Commun. .

Abstract

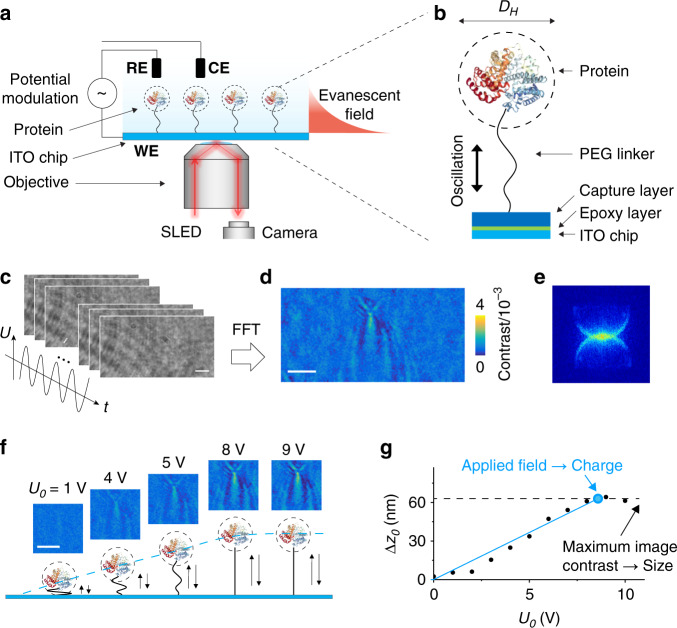
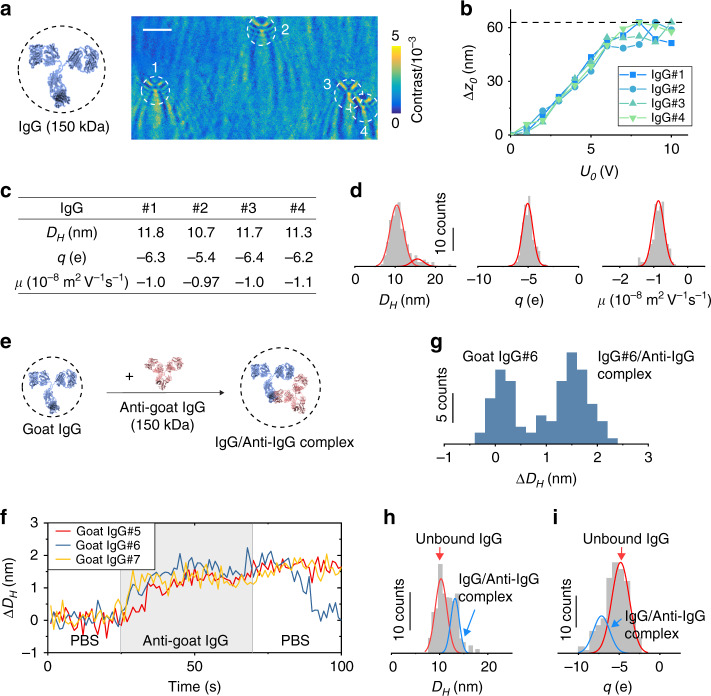
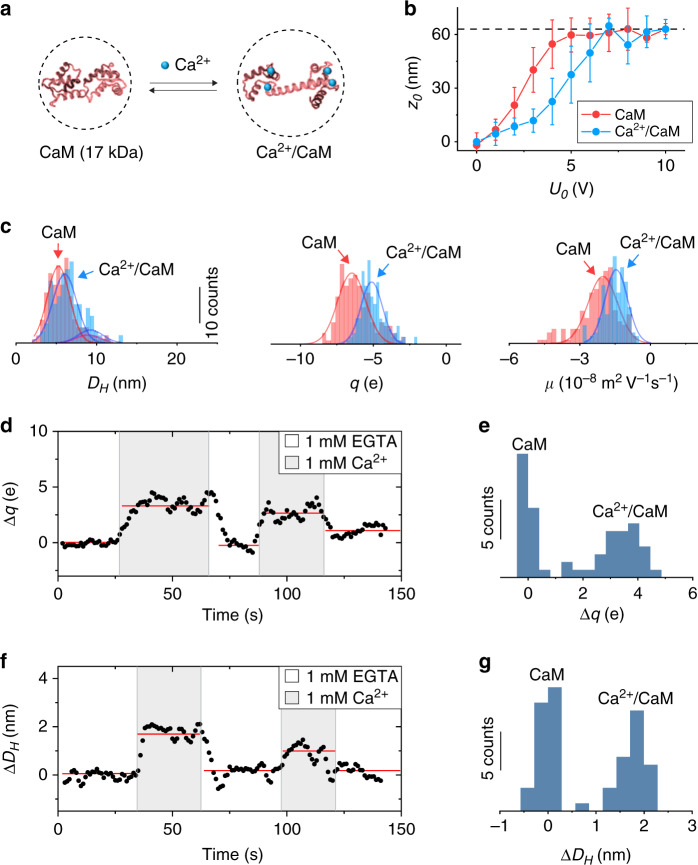
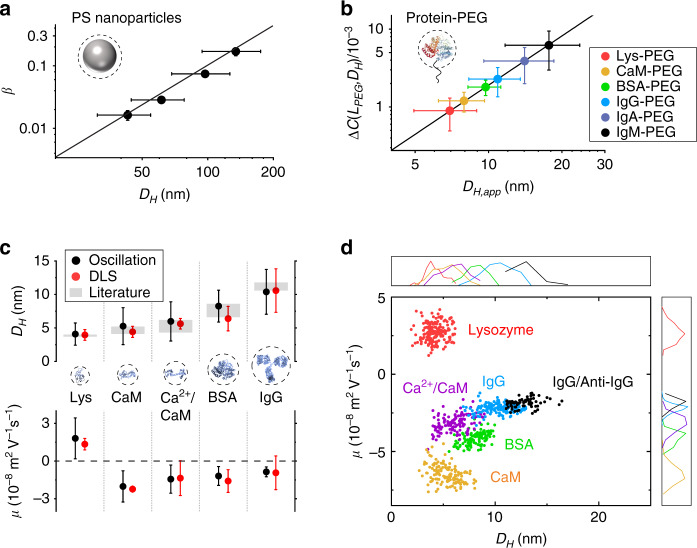
Detection and identification of proteins are typically achieved by analyzing protein size, charge, mobility and binding to antibodies, which are critical for biomedical research and disease diagnosis and treatment. Despite the importance, measuring these quantities with one technology and at the single-molecule level has not been possible. Here we tether a protein to a surface with a flexible polymer, drive it into oscillation with an electric field, and image the oscillation with a near field optical imaging method, from which we determine the size, charge, and mobility of the protein. We also measure antibody binding and conformation changes in the protein. The work demonstrates a capability for comprehensive protein analysis and precision protein biomarker detection at the single molecule level.


Conflict of interest statement

A US patent application (16/584,120) has been filed by Arizona Board of Regents on behalf of Arizona State University based on an early draft of this article and published on 03/26/2020. Inventors: N.T. and G.M.

Figures

Fig. 1
Fig. 1. Imaging single proteins and mechanical oscillations.
a Proteins are tethered to an ITO surface with a flexible polymer tether, and driven into oscillation by an alternating electric potential applied to the surface with a three-electrode electrochemical configuration, where WE, RE, and CE are the working (the ITO surface), reference (Ag/AgCl wire) and counter electrodes (Pt coil), respectively. The oscillating protein molecules scatter the evanescent field generated by illuminating the ITO surface with light from a SLED, and the scattered light is collected to form an image captured with a CMOS camera. b The polymer tether is a 63 nm long polyethylene glycol (PEG), which links the protein (hydrodynamic diameter, DH) to the ITO surface via surface chemistry described in “Methods”. c Time sequence images of oscillating molecules (bovine serum albumin or BSA) recorded at 800 frames/s with potential modulation amplitude and frequency of 8 V and 80 Hz, respectively. d Fast Fourier Transform (FFT) filter is applied to the time sequence images shown in c to produce an FFT image, which resolves a single BSA molecule. e Spatial Fourier transform of the FFT image (k-space) in d showing two rings, indicating the FFT image pattern is due to the interference between a planar wave (evanescent) and circular (scattering by a molecule) waves. f FFT image contrast vs. potential amplitude, showing a linear regime at low electric fields, and a plateau regime associated with fully stretching of the PEG tether at high electric fields. The two regimes are indicated by the blue dash line. g Oscillation amplitude (Δz0) of a BSA molecule vs. potential amplitude (U0). Diameter and charge are determined from the amplitude of the plateau regime (black dash line) and the slope of the linear regime (blue line), respectively. Scale bars in c, d, f represent 3 µm.
Fig. 2
Fig. 2. Quantifying the size, charge, and mobility of single proteins.
a FFT image of immunoglobulin G (IgG) measured with potential amplitude, U0 = 8 V. Scale bar, 3 µm. b Oscillation amplitude (Δz0) vs. potential amplitude (U0) plots for the IgG molecules marked in a, from which diameter (DH), charge (q), and mobility (µ) are obtained. c Measured DH, q, and µ of the molecules shown in b. d Histograms of DH, q, and µ measured for 186 IgG molecules, where the red curves are Gaussian fittings (see Supplementary Table 4). e Anti-goat IgG is introduced to bind with goat IgG tethered on the surface. f Binding/unbinding of anti-goat IgG with three goat IgG molecules tracked in real time, showing diameter changes associated with the binding and unbinding events. Potential amplitude: U0 = 9 V. Buffer: 100× diluted PBS at pH = 7.4. Anti-goat IgG concentration:130 nM. g Size distribution of a goat IgG molecule (#6 shown in f) measured during its binding/unbinding with anti-goat IgG, where the two peaks correspond to IgG and anti-IgG/IgG complex, respectively. h, i DH and q histograms of 137 goat IgG molecules obtained after incubation with 33 nM anti-goat IgG for ~30 min, where the two peaks are due to IgG and anti-IgG/IgG complex (see Supplementary Table 4 for the extracted mean DH and q; Supplementary Fig. 4a for the mobility histogram). The blue and red lines are Gaussian fittings of the peaks.
Fig. 3
Fig. 3. Ligand binding-induced conformation change in a protein.
a Binding of Ca2+ to calmodulin (CaM) causes conformation and charge changes in CaM. b Oscillation amplitude vs. U0 plots before (red) and after (blue) Ca2+ binding to CaM, where the vertical bars are standard deviations of >150 CaM or Ca2+/CaM molecules. c Statistical analysis for 150 CaM molecules (red) and 151 Ca2+/CaM molecules (blue) showing the diameter (DH), charge (q) and mobility (µ) distributions of CaM and Ca2+/CaM complex (see Supplementary Table 4 for a summary). The red and blue lines are Gaussian fittings of the peaks. d, f Tracking of the charge (Δq) and size (ΔDH) changes of a single CaM molecule induced by Ca2+ binding over time, where the size change was measured with U0 fixed at 7 V (the plateau regime) and the charge measurement was performed with U0 = 4 V (the linear regime). The binding and unbinding of Ca2+ to CaM were performed by alternatively flowing 1 mM EGTA and 1 mM Ca2+ in 100× diluted PBS (at pH = 7.4) over the surface. The scatter plots (black dots) are raw data smoothed over three points, and the red lines are guide to the eye, showing the charge or size change duo the binding and unbinding of the molecule with Ca2+. e, g Charge and size histograms obtained from the first binding and unbinding cycle in d, f respectively. Both histograms show two peaks corresponding to the CaM molecule with and without Ca2+ binding.
Fig. 4
Fig. 4. Identifying proteins based on size and mobility.
a Image contrast vs. size for polystyrene (PS) particles. The solid line is fitting of the data showing a power relation of 2.1. Because PS particles bind to the ITO surface from the bulk solution (Δz0), the image contrast is β according to Eq. (3). b Determining protein–PEG complex size (DH,app) from FFT image contrast change, ΔC(LPEG, DH). Unlike PS particles, proteins are tethered to the surface and driven into oscillation with a maximum oscillation amplitude determined by the PEG length. c Comparison of measured DH and µ (Oscillation) with those measured by dynamic light scattering (DLS) experiments performed here and reported in literature. d Mobility (µ) − size (DH) plot of single proteins and protein–ligand complexes, showing different proteins or complexes are separated in the 2D-plot, which resembles “2-D electrophoresis”. Mobility or size, each alone, cannot clearly separate the different proteins, as shown by the corresponding 1D size and mobility histograms (top and side panels). The error bars for image contrast, size and mobility represent standard deviations of >100 single-nanoparticle or single-protein measurements.

References

    1. Brouhard GJ, Rice LM. Microtubule dynamics: an interplay of biochemistry and mechanics. Nat. Rev. Mol. Cell Biol. 2018;19:451–463. - PMC - PubMed
    1. Cournia Z, et al. Membrane protein structure, function, and dynamics: a perspective from experiments and theory. J. Membr. Biol. 2015;248:611–640. - PMC - PubMed
    1. Cairns RA, Harris IS, Mak TW. Regulation of cancer cell metabolism. Nat. Rev. Cancer. 2011;11:85–95. - PubMed
    1. Santos R, et al. A comprehensive map of molecular drug targets. Nat. Rev. Drug Discov. 2016;16:19–34. - PMC - PubMed
    1. Polanski M, Anderson NL. A list of candidate cancer biomarkers for targeted proteomics. Biomark. Insights. 2007;1:1–48. - PMC - PubMed

Publication types