. 2020 Sep 21;11(1):4752.
doi: 10.1038/s41467-020-18500-x.

GPR101 drives growth hormone hypersecretion and gigantism in mice via constitutive activation of Gs and Gq/11

Affiliations

GPR101 drives growth hormone hypersecretion and gigantism in mice via constitutive activation of Gs and Gq/11

Dayana Abboud et al. Nat Commun. .

Abstract

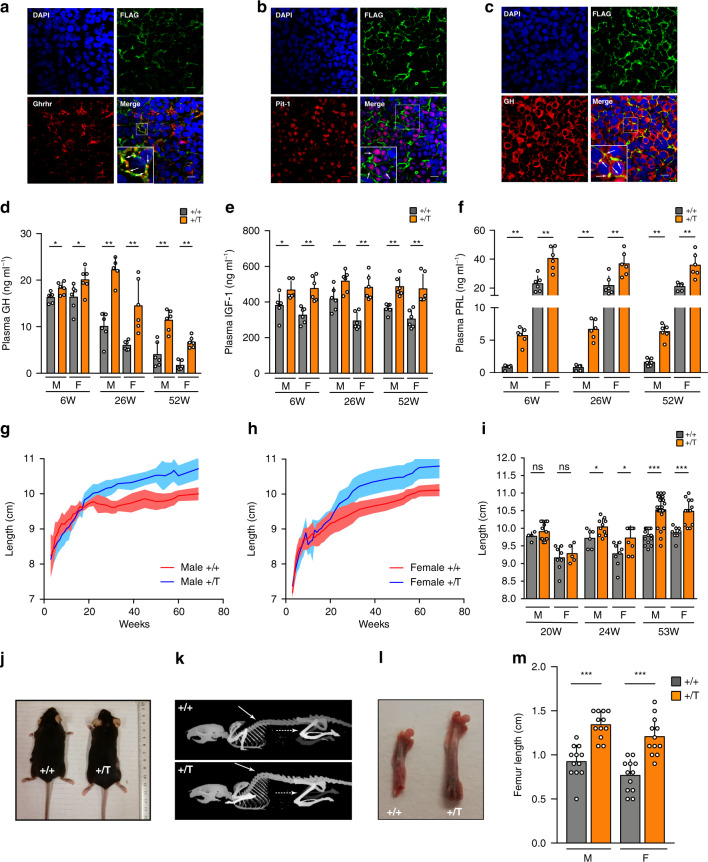
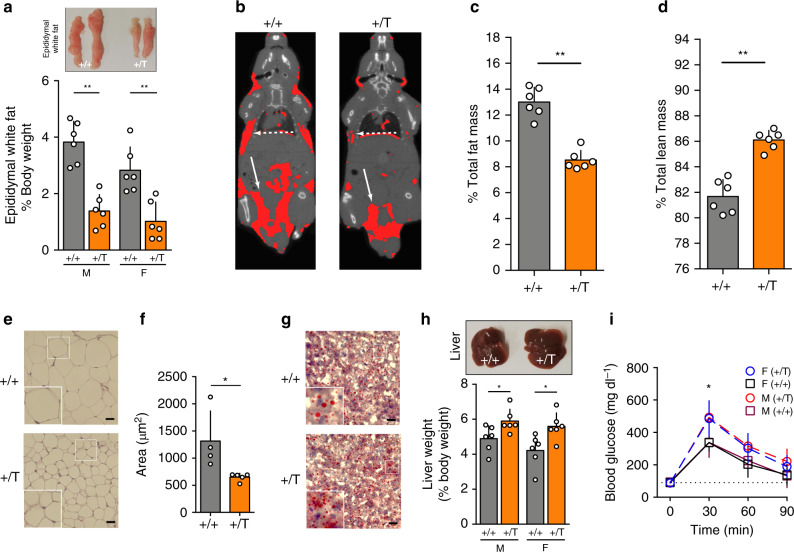
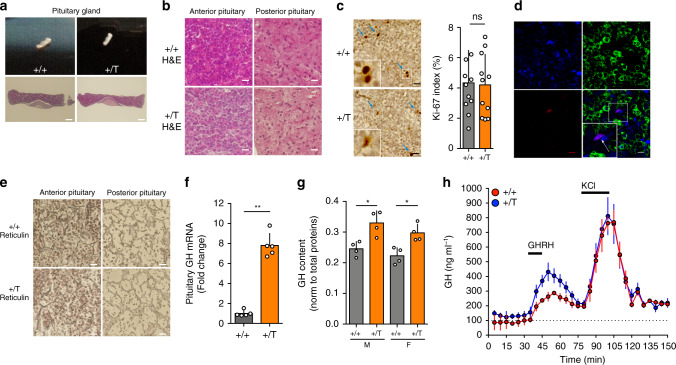
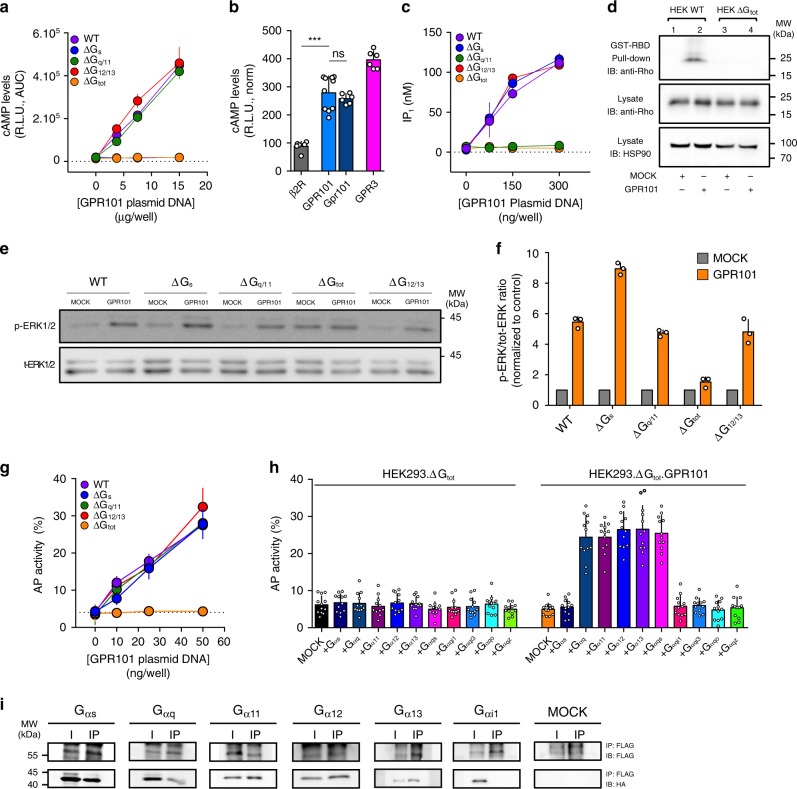
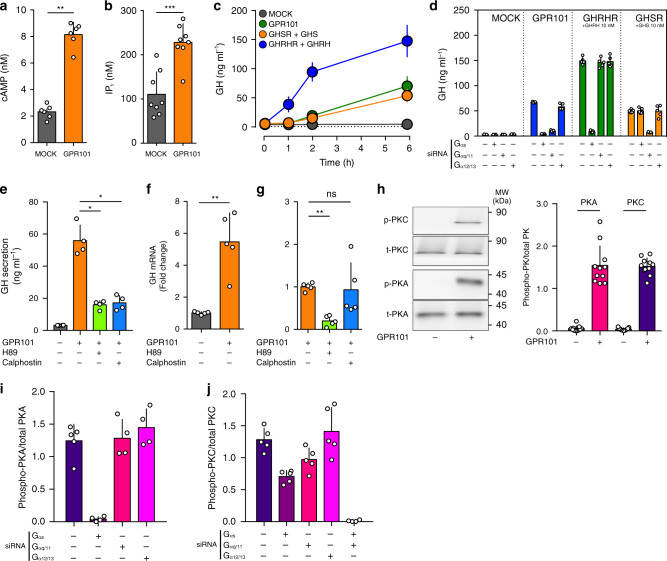
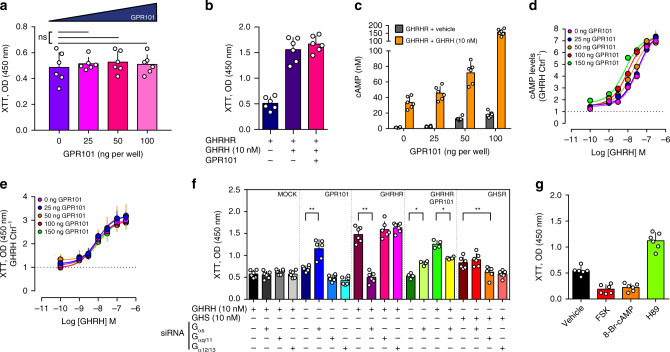
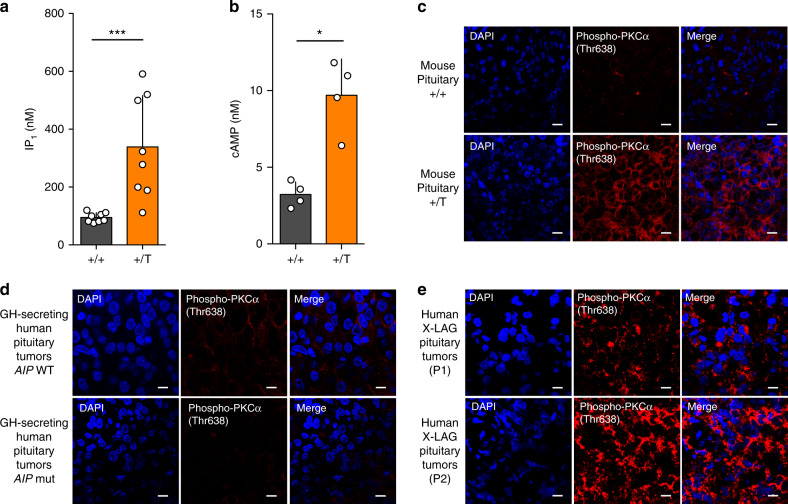
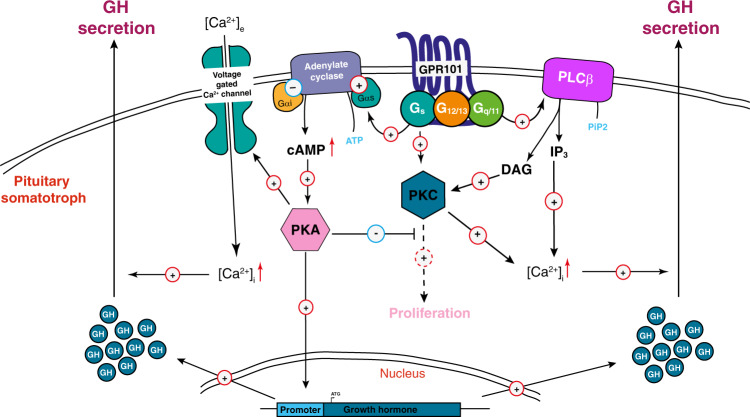
Growth hormone (GH) is a key modulator of growth and GH over-secretion can lead to gigantism. One form is X-linked acrogigantism (X-LAG), in which infants develop GH-secreting pituitary tumors over-expressing the orphan G-protein coupled receptor, GPR101. The role of GPR101 in GH secretion remains obscure. We studied GPR101 signaling pathways and their effects in HEK293 and rat pituitary GH3 cell lines, human tumors and in transgenic mice with elevated somatotrope Gpr101 expression driven by the rat Ghrhr promoter (GhrhrGpr101). Here, we report that Gpr101 causes elevated GH/prolactin secretion in transgenic GhrhrGpr101 mice but without hyperplasia/tumorigenesis. We show that GPR101 constitutively activates not only Gs, but also Gq/11 and G12/13, which leads to GH secretion but not proliferation. These signatures of GPR101 signaling, notably PKC activation, are also present in human pituitary tumors with high GPR101 expression. These results underline a role for GPR101 in the regulation of somatotrope axis function.


Conflict of interest statement

The authors declare the following competing interests A.F.D. and A.B. are Inventors of granted US Patent No. 10,350, 273B2, Treatment of Hormonal Disorders of Growth. All other authors declare no competing interests.

Figures

Fig. 1
Fig. 1. Gpr101 promotes GH/IGF-1 and PRL hypersecretion and overgrowth in vivo.
ac Immunofluorescent staining of anterior pituitary from 29-week-old GhrhrGpr101 Tg mice. Blue: DAPI. Green: FLAG antibody. Red: a Ghrhr antibody, b Pit-1 antibody and c. GH antibody. (×60 magnification, scale bar: 10 µm). These experiments were repeated at least 3 times. d, e Determination in WT (+/+) and GhrhrGpr101 (+/T) (n = 6 mice per group) of plasma levels of d GH. Males 6 W: p = 0.0411, 26 W and 52 W: p = 0.0022. Females 6, 26, and 52 W: p = 0.0022. e IGF-1. Males 6 W and 26 W: p = 0.0260, 52 W: p = 0.0022. Females 6, 26, and 52 W: p = 0.0022. f PRL. Males 6, 26, and 52 W: p = 0.0022. Females 6 W: p = 0.0043, 26 W: p = 0.0087 52 W: p = 0.0022. g, h Growth curves (length, nose-to-anus) of WT (+/+, males n = 4–18 mice, females n = 6–16 mice) and GhrhrGpr101 (+/T, males n = 5–24 mice, females n = 5–13 mice) between week 3 and week 69. i Quantification and statistical analysis of the lengths of mice at different time points. Males 20 W: n = 4 (+/+) and 13 (+/T) mice, p = 0.4790; 24 W: n = 6 (+/+) and 10 (+/T) mice, p = 0.0493; 53 W: n = 15 (+/+) and 24 (+/T) mice, p = 0.0001. Females 20 W: n = 8 (+/+) and 5 (+/T) mice, p = 0.6169; 24 W: n = 8 (+/+) and 9 (+/T) mice, p = 0.0349; 53 W: n = 8 (+/+) and 13 (+/T) mice, p = 0.0002. j Macroscopic findings regarding body length of WT (+/+) and GhrhrGpr101 (+/T) aged 53 weeks. k CT images of WT (+/+) and GhrhrGpr101 (+/T) mice (age 27 weeks). Plain arrow indicates skeletal kyphosis and dashed arrow indicates the femur (n = 4–5 mice per group). l. Extracted femurs of 27-weeks-old WT (+/+) and GhrhrGpr101 (+/T) mice. m Quantification of femur length (n = 12 femurs from 6 mice per group, p = 0.0001 for Males and Females). All Data are Mean ± S.D. For statistical analysis of all data, a two-sided Mann–Whitney test was used. ns not significantly different; *p < 0.05; **p < 0.01 ***p < 0.001.
Fig. 2
Fig. 2. GH/IGF-1 hypersecretion leads to alterations in GhrhrGpr101 mice body composition.
a Picture: Epididymal white fat from WT (+/+) and GhrhrGpr101 (+/T). Bars: quantification of epididymal white fat weight normalized to total body weight (n = 6 mice/group, p = 0.0022 for males and females). b Representative CT images segmented for fat of 27-week-old WT (+/+) and GhrhrGpr101 (+/T) mice (n = 6 mice per group). Total volume is in grayscale and fat volume is in red. Plain white arrows indicate subcutaneous fat and dashed arrows epididymal fat distribution. c Percentage of fat mass in WT (+/+) and GhrhrGpr101 (+/T) mice (n = 6 mice per group, p = 0.0022) determined by CT-scan analysis. d Percentage of lean mass in WT (+/+) and GhrhrGpr101 (+/T) mice (n = 6 mice per group, p = 0.0022) determined by CT-scan analysis. e 27-week-old WT (+/+) and GhrhrGpr101 (+/T) representative histological sections of epididymal adipose tissue stained with H&E. Scale bar: 30 µm. This experiment was repeated at least three times. f Mean adipocyte area, quantified using at least four fields per whole-slide image, from at least four animals per group (p = 0.0159). g Representative liver histological sections from 27-week-old WT (+/+) and GhrhrGpr101 (+/T) mice stained with ORO (n = 4 mice per group). Scale bars: 30 µm. h Picture: extracted livers from WT (+/+) and GhrhrGpr101 (+/T). Bars: quantification of liver weight normalized to body weight (n = 6 mice per group, males: p = 0.0303, females: p = 0.0130). i GTT of 11 month-old WT (+/+) and GhrhrGpr101 (+/T) mice. GTT was performed after 12 h of fasting. Glucose was injected IP to starved mice and blood was collected at indicated time points (0, 30, 60, and 90 min) to measure blood glucose levels (males: n = 6 mice per group, females: n = 5 mice per group). 0 min: p = 0.5173 for males and p = 0.7302 for females. 30 min: p = 0.0260 for males and p = 0.0317 for females. 60 min: p = 0.1970 for males and p = 0.0952 for females. 90 min: p = 0.1320 for males and p = 0.4206 for females. All data are presented as Mean ± S.D. For statistical analysis of all data, a two-sided Mann–Whitney test was used. ns not significantly different; *p < 0.05; **p < 0.01; ***p < 0.001. F Female, M Male.
Fig. 3
Fig. 3. Gpr101 overexpression potentiates GH release but does not lead to hyperplasia/tumorigenesis.
a Upper panel: Macroscopic analysis of the pituitary gland from 27-week-old WT (+/+) and GhrhrGpr101 (+/T) mice. Lower panel: microscopic visualization of pituitary sections after H&E staining. Scale bar: 150 µm. b High magnification of anterior and posterior pituitaries stained with H&E. Scale bar: 15 µm. c Left panel: Immunohistochemical staining of the anterior pituitary sections with the cell proliferation marker Ki-67 (scale bar: 15 µm). Blue arrows indicate Ki-67-positive nuclei staining. Right panel: quantification of the Ki-67 labeling index in pituitary sections of 27-week-old WT (+/+) and GhrhrGpr101 (+/T) mice. The Ki-67 labeling index represents the percentage of positive nuclei stained by anti-Ki-67 antibody. n = 11 independent areas from staining section of WT (+/+) and GhrhrGpr101 (+/T) (n = 4 mice per group, p = 0.9487). d Immunofluorescent staining of GH (green) and Ki-67 (Red). Scale bar: 10 µm. e Reticulin staining of the anterior and posterior pituitaries of WT (+/+) and GhrhrGpr101 (+/T) mice (scale bar: 15 µm). f The expression of GH in the pituitary of WT and GhrhrGpr101 mice (aged 27 weeks n = 5, p = 0.0079) was quantified by RT-qPCR. GAPDH was used as a control housekeeping gene. g The content of the GH protein was quantified by ELISA and normalized to total protein in pituitary lysates of both males and females of the WT (+/+) and GhrhrGpr101 (+/T) genotypes (aged 29 weeks, n = 4, p = 0.0286). h Ex vivo pituitary superfusion analysis. Pituitary glands of WT (+/+) and GhrhrGpr101 (+/T) (aged 29 weeks, n = 3 mice) were superfused at 0.1 ml min−1 in superfusion chambers. Effluents were collected every 5 min for GH measurement. GHRH (100 nM) was added to the medium for 15 min and KCl (0.03 M) for 20 min (as it is indicated with arrows). GH secretion was quantified by ELISA at indicated time points. All the experiments were independently repeated three times unless stated otherwise. F Female, M Male. For statistical analysis of all data, a two-sided Mann–Whitney test was used unless stated otherwise. ns not significantly different; *p < 0.05; **p < 0.01; ***p < 0.001.
Fig. 4
Fig. 4. GPR101 is constitutively coupled to Gs, Gq/11, and G12/13.
a Measurement of cAMP levels after GPR101 transient transfection in HEK293 WT, ΔGs, ΔGq/11, ΔG12/13, or ΔGtot. n = 12 independent experiments. b Comparison of constitutive cAMP levels obtained after transient transfection of pGlo.HEK293 with the indicated receptors: ß2AR (n = 6 independent experiments), GPR101 (n = 10 independent experiments), Gpr101 (n = 6 independent experiments), and GPR3 (n = 6 independent experiments). The values have been normalized to receptor expression to enable direct comparison. GPR101 vs ß2AR: p = 0.0002; GPR101 vs Gpr101: p = 0.5622. c Measurement of IP1 levels after transient GPR101 transfection in HEK293 WT, ΔGs, ΔGq/11, ΔG12/13, or ΔGtot. n = 4 independent experiments. d Activated Rho was detected in lysates of HEK293 WT or HEK293ΔGtot transiently transfected with GPR101 following precipitation with GST-Rho-binding domain (RBD). Shown are representative of at least three independent experiments. See text for details. e Shown are pictures of immunoblots for the determination of ERK1/2 phosphorylation in WT HEK293 or HEK293 cells deficient for the indicated G proteins and transiently transfected with GPR101 or empty vector (MOCK). f Immunoblots were quantified by densitometric analysis. The p-ERK1/2 to total ERK1/2 ratio has been normalized to the MOCK condition. n = 3 independent experiments. g TGF α Shedding assay performed on HEK293 WT, ΔGs, ΔGq/11, ΔG12/13, or ΔGtot transiently transfected with GPR101. Results are expressed as the percentage of AP activity in the conditioned medium. n = 12 independent experiments. h TGF α shedding assay in HEK293 ΔGtot transiently transfected with empty vector (MOCK) or GPR101 alone or together with various Gα proteins and chimeric Gα proteins. Results are expressed as the percentage of AP activity in the conditioned medium. n = 12 independent experiments. i Co-Immunoprecipitation of FLAG-GPR101 with Anti-FLAG beads followed by immunodetection of HA-tagged Gα proteins with anti-HA antibody on WB membranes. Full scans of blots from d, e, and i can be found in the Source Data File. All data are Mean ± S.D. AUC area under curve, HSP90 heat shock protein 90. IB antibody used for blotted membrane, I input, IP immunoprecipitated fraction. Shown are representative pictures of three independent experiments. R.L.U. Relative Luminescence Unit. For statistical analysis of all data, a two-sided Mann–Whitney test was used. ns not significantly different; *p < 0.05; **p < 0.01; ***p < 0.001.
Fig. 5
Fig. 5. GPR101 promotes GH secretion through Gs and Gq/11.
All the experiments presented here were performed on the GH3 pituitary cell line. a Determination of cAMP levels (by ELISA) following transient transfection with MOCK or GPR101 plasmid (p = 0.0022). b Determination of IP1 levels (by ELISA) following transient transfection with MOCK or GPR101 plasmid (p = 0.0006). c Time-dependent (0, 1, 2, and 6H) measurement (by ELISA) of GH secretion in the cell culture supernatant. The cells were transfected with MOCK (dark grey), GPR101 (green), GHSR (orange), or GHRHR (blue) for 24 h, then starved for 3 h. For GHSR and GHRHR, cells were stimulated with their respective ligands (GHS or GHRH, 10 nM). GPR101 and MOCK received a vehicle treatment as control. d GH determination in the cell culture supernatant after 24h-treatment with various siRNAs (Gαs, Gαq/11, or Gα12/13), 24h-transfection with expression plasmids containing receptors (MOCK, GPR101, GHSR, or GHRHR), 3h-starvation and 6h-stimulation with indicated agonists (GHS or GHRH, 10 nM). e GH secretion was determined (by ELISA) in the cell culture supernatant following transfection with GPR101 (or MOCK) and treated with vehicle, H89 (10 µM, p = 0.0286) or Calphostin (10 µM, p = 0.0286). f, g Rat GH mRNA determination by RT-qPCR following transfection with MOCK or GPR101 (p = 0.0079) (f) and treatment with PKA & PKC inhibitors H89 (10 µM, p = 0.0079) and Calphostin (10 µM, p = 0.6905) (g), respectively. h Left: Immunoblot for the detection of phosphorylated PKA and PKC in GH3 cells following transfection with MOCK or GPR101. Right: Quantification by densitometry of immunoblots. Normalization was performed compared to total PKA and PKC proteins in cell lysate. Full scans of blots are available in the Source Data file. I, j Quantification by densitometry of immunoblots for PKA and PKC in the presence of GPR101 and different siRNAs. The antiphosphorylated antibody has been normalized to the signal from the antibody against total protein. All data are Mean ± S.D. of n = 8 (b), n = 6 (a, c), n = 5 (d, f, g, j), n = 4 (e, i), and n = 3 (h) independent experiments. For statistical analysis of all data, a two-sided Mann–Whitney test was used. ns not significantly different; *p < 0.05; **p < 0.01; ***p < 0.001.
Fig. 6
Fig. 6. GPR101 does not increase GH3 cell proliferation.
a Proliferation was measured with XTT cell proliferation kit on GH3 cells transiently transfected with increasing amounts (0, 25, 50, and 100 ng) of pcDNA3.1 FLAG-GPR101 plasmid (0 ng vs 25 ng p = 0.8182; vs 50 ng p = 0.5887; vs 100 ng p = 0.6991). b Quantification of proliferation (by using the XTT reagent) of GH3 cells co-transfected with GHRHR and GPR101 (or MOCK) and treated with vehicle or GHRH at final concentration of 10 nM. c Comparison of cAMP levels (measured by ELISA) in GH3 cells transfected with GHRHR (100 ng) in the presence of increasing amounts (0, 25, 50, and 100 ng) of GPR101 plasmids, and treated with vehicle (dark grey) or GHRH (10 nM, orange). d, e GH3 cells transfected with GHRHR (100 ng) and increasing amounts of FLAG-GPR101. The cells were treated with increasing concentration of GHRH. d cAMP levels measured by ELISA and normalized to vehicle condition. e Proliferation measured with XTT assay. f Effect of the siRNA-mediated depletion of different G protein α subunits (Gαs, Gαq/11, or Gα12/13) on GH3 proliferation measured Briefly, GH3 cells were incubated with siRNAs (Gαs, Gαq/11, or Gα12/13, at a final concentration of 1 µM) for 24 h, and then transfected with MOCK, GPR101 (NTS vs Gαs p = 0.0022), GHRHR (NTS vs Gαs p = 0.0022), GPR101+GHRHR (untreated NTS vs Gαs p = 0.0286, GHRH-treated NTS vs Gαs p = 0.0286) or GHSR (GHS-treated NTS vs Gαq/11 p = 0.0065). GHRHR- and GPR101+GHRHR-transfected cells were stimulated with GHRH (10 nM) and GHSR-transfected cells with GHS (10 nM). g Determination of the proliferation of GPR101-transfected GH3 cells treated with vehicle or different pharmacological agents, such as FSK (adenylate cyclase activator, 10 µM), 8-Br-cAMP (PKA activator, 10 µM), and H89 (PKA inhibitor, 10 µM). All data are Mean ± S.D. of n = 6 independent experiments (except for the co-transfection of GHRHR with GPR101 in panel f and for experiments of panels d, e where n = 4). For statistical analysis of all data, a two-sided Mann–Whitney test was used. ns not significantly different; *p < 0.05; **p < 0.01; ***p < 0.001.
Fig. 7
Fig. 7. PKC activation is a signature in somatotropes with high GPR101 expression in vivo.
a Quantification of IP1 levels in WT (+/+) and GhrhrGpr101 (+/T) pituitaries by ELISA in mice aged 29 weeks (n = 8 mice per group, p = 0.0005). b Quantification of cAMP levels in WT (+/+) and GhrhrGpr101 (+/T) pituitaries by ELISA in mice aged 29 weeks (n = 4 mice per group, p = 0.0286). c Immunofluorescent staining of Phospho-PKCα (Thr638) (in red) and DAPI (in blue) in pituitaries from 29-week-old WT (+/+) and WT (+/+) mice (n = 4 mice/group). The results show that the staining for Phospho-PKCα (Thr638) is increased in tg GhrhrGpr101 mice compared to WT mice. Scale bar: 10 µm. d, e Illustrative examples of immunofluorescent staining of Phospho-PKCα (Thr638) (in red) and DAPI (in blue) in human GH-secreting pituitary adenomas (d, in total n = 9 patients) that are either AIP WT (upper panel, n = 6) or AIP mutated (lower panel, n = 3) and illustrative examples of human X-LAG pituitary tumors from two different patients (e, n = 3 patients). The results show that Phospho-PKC (Thr638) staining in human X-LAG pituitary tumors is elevated. Photos were taken at ×60 magnification. Scale bar: 10 µm. All data are Mean ± S.D. For statistical analysis of all data, a two-sided Mann–Whitney test was used. *p < 0.05; **p < 0.01; ***p < 0.001.
Fig. 8
Fig. 8. Proposed model for GPR101-induced GH secretion.
[Ca2+]i: Intracellular Calcium; cAMP 3′,5′-cyclic Adenosine Monophosphate, DAG Diacylglycerol, GH Growth Hormone, IP3 Inositol Triphosphate, PIP2 Phosphatidylinositol 4,5-bisphosphate, PKA Protein Kinase A, PKC Protein Kinase C, PLCβ Phospholipase Cβ.

References

    1. Lui JC, Garrison P, Baron J. Regulation of body growth. Curr. Opin. Pediatr. 2015;27:502–510. - PMC - PubMed
    1. Buchman M, Bell S, Kopchick JJ. Growth hormone discovery and structure. Pediatr. Endocrinol. Rev. 2018;16:2–10. - PubMed
    1. Steyn, F. J., Tolle, V., Chen, C. & Epelbaum, J. In Comprehensive Physiology vol. 6, pp. 687–735 (John Wiley & Sons, Inc., 2016). - PubMed
    1. Beckers A, Petrossians P, Hanson J, Daly AF. The causes and consequences of pituitary gigantism. Nat. Rev. Endocrinol. 2018;14:705–720. - PubMed
    1. Rostomyan L, et al. Clinical and genetic characterization of pituitary gigantism: an international collaborative study in 208 patients. Endocr. Relat. Cancer. 2015;22:745–757. - PMC - PubMed

Publication types

MeSH terms

Substances