Estimating retention benchmarks for salvage logging to protect biodiversity
- PMID: 32958767
- PMCID: PMC7505835
- DOI: 10.1038/s41467-020-18612-4
Estimating retention benchmarks for salvage logging to protect biodiversity
Abstract
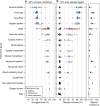
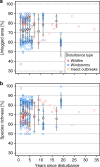
Forests are increasingly affected by natural disturbances. Subsequent salvage logging, a widespread management practice conducted predominantly to recover economic capital, produces further disturbance and impacts biodiversity worldwide. Hence, naturally disturbed forests are among the most threatened habitats in the world, with consequences for their associated biodiversity. However, there are no evidence-based benchmarks for the proportion of area of naturally disturbed forests to be excluded from salvage logging to conserve biodiversity. We apply a mixed rarefaction/extrapolation approach to a global multi-taxa dataset from disturbed forests, including birds, plants, insects and fungi, to close this gap. We find that 75 ± 7% (mean ± SD) of a naturally disturbed area of a forest needs to be left unlogged to maintain 90% richness of its unique species, whereas retaining 50% of a naturally disturbed forest unlogged maintains 73 ± 12% of its unique species richness. These values do not change with the time elapsed since disturbance but vary considerably among taxonomic groups.
Conflict of interest statement
The authors declare no competing interests.
Figures


Similar articles
-
The effect of natural disturbances on forest biodiversity: an ecological synthesis.Biol Rev Camb Philos Soc. 2022 Oct;97(5):1930-1947. doi: 10.1111/brv.12876. Epub 2022 Jul 8. Biol Rev Camb Philos Soc. 2022. PMID: 35808863
-
Selective‐logging and oil palm: multitaxon impacts, biodiversity indicators, and trade‐offs for conservation planning.Ecol Appl. 2014;24(8):2029-49. Ecol Appl. 2014. PMID: 29185670
-
Disturbance gradient shows logging affects plant functional groups more than fire.Ecol Appl. 2016 Oct;26(7):2280-2301. doi: 10.1002/eap.1369. Epub 2016 Sep 20. Ecol Appl. 2016. PMID: 27755744
-
Natural disturbance impacts on ecosystem services and biodiversity in temperate and boreal forests.Biol Rev Camb Philos Soc. 2016 Aug;91(3):760-81. doi: 10.1111/brv.12193. Epub 2015 May 22. Biol Rev Camb Philos Soc. 2016. PMID: 26010526 Free PMC article. Review.
-
Salvage logging, ecosystem processes, and biodiversity conservation.Conserv Biol. 2006 Aug;20(4):949-58. doi: 10.1111/j.1523-1739.2006.00497.x. Conserv Biol. 2006. PMID: 16922212 Review.
Cited by
-
Forest restoration in a time of fire: perspectives from tall, wet eucalypt forests subject to stand-replacing wildfires.Philos Trans R Soc Lond B Biol Sci. 2023 Jan 2;378(1867):20210082. doi: 10.1098/rstb.2021.0082. Epub 2022 Nov 14. Philos Trans R Soc Lond B Biol Sci. 2023. PMID: 36373929 Free PMC article.
-
Refining manual annotation effort of acoustic data to estimate bird species richness and composition: The role of duration, intensity, and time.Ecol Evol. 2022 Nov 14;12(11):e9491. doi: 10.1002/ece3.9491. eCollection 2022 Nov. Ecol Evol. 2022. PMID: 36398198 Free PMC article.
-
Quantifying the impact of key factors on the carbon mitigation potential of managed temperate forests.Carbon Balance Manag. 2024 Mar 2;19(1):10. doi: 10.1186/s13021-023-00247-9. Carbon Balance Manag. 2024. PMID: 38430356 Free PMC article.
-
Enhancing structural complexity: An experiment conducted in the Black Forest National Park, Germany.Ecol Evol. 2023 Jan 9;13(1):e9732. doi: 10.1002/ece3.9732. eCollection 2023 Jan. Ecol Evol. 2023. PMID: 36636429 Free PMC article.
-
What secondary research evidence exists on the effects of forest management after disturbances: a systematic map protocol.Environ Evid. 2024 Jun 2;13(1):16. doi: 10.1186/s13750-024-00340-7. Environ Evid. 2024. PMID: 39294750 Free PMC article.
References
-
- Kurz W, et al. Mountain pine beetle and forest carbon feedback to climate change. Nature. 2008;452:987–990. - PubMed
-
- Turner MG. Disturbance and landscape dynamics in a changing world. Ecology. 2010;91:2833–2849. - PubMed
-
- Müller J, et al. Increasing disturbance demands new policies to conserve intact forest. Conserv. Lett. 2019;12:e12449.
-
- Lindenmayer, D., Burton, P. J. & Franklin, J. F. Salvage Logging and its Ecological Consequences. (Island Press, 2008).
Publication types
MeSH terms
LinkOut - more resources
Full Text Sources
Miscellaneous

