

doi: 10.1038/s41467-020-18559-6.
Elucidation of the aberrant 3' splice site selection by cancer-associated mutations on the U2AF1
Affiliations
- PMID: 32958768
- PMCID: PMC7505975
- DOI: 10.1038/s41467-020-18559-6
Item in Clipboard
Elucidation of the aberrant 3' splice site selection by cancer-associated mutations on the U2AF1
Nat Commun.
.
Abstract
The accurate exclusion of introns by RNA splicing is critical for the production of mature mRNA. U2AF1 binds specifically to the 3´ splice site, which includes an essential AG dinucleotide. Even a single amino acid mutation of U2AF1 can cause serious disease such as certain cancers or myelodysplastic syndromes. Here, we describe the first crystal structures of wild-type and pathogenic mutant U2AF1 complexed with target RNA, revealing the mechanism of 3´ splice site selection, and how aberrant splicing results from clinically important mutations. Unexpected features of this mechanism may assist the future development of new treatments against diseases caused by splicing errors.
Conflict of interest statement
The authors declare no competing interests.
Figures
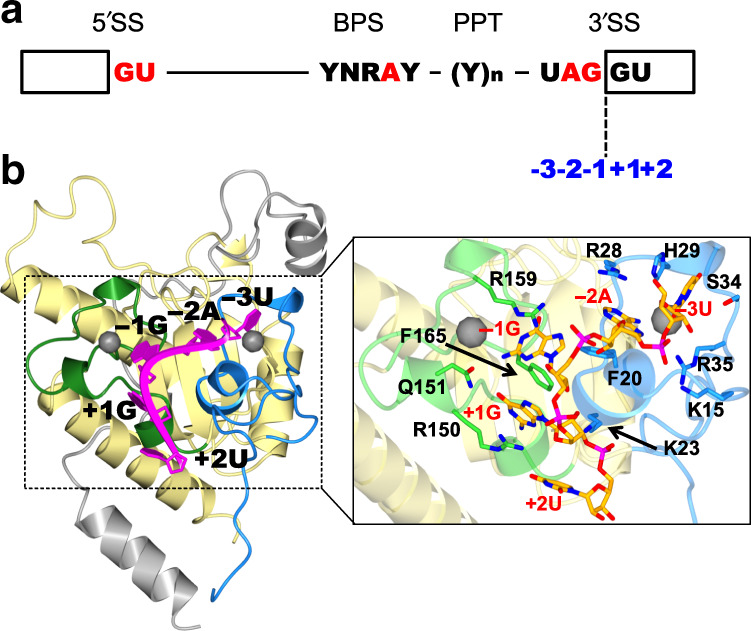
a Sequence elements required for splicing. Boxes indicate exons; Y pyrimidine, R purine, N any nucleotide, 5′SS 5′ splice site, BPS branch-point sequence, PPT polypyrimidine tract, 3′SS 3′ splice site. The dotted line indicates the exon boundary at the 3′ splice site, and numbers indicate the distance from the boundary. b Crystal structure of U2AF1 complexed with RNA, 5′-UAGGU. The N-terminal zinc finger (2-43, ZF1), U2AF homology motif (UHM, 44-141), C-terminal zinc finger (ZF2, 143-170), U2AF2 fragment (105–159), and RNA are colored blue, yellow, green, gray, and magenta, respectively. Inset: close-up view of the RNA-binding region in U2AF1. RNA is shown in stick representation colored with orange.
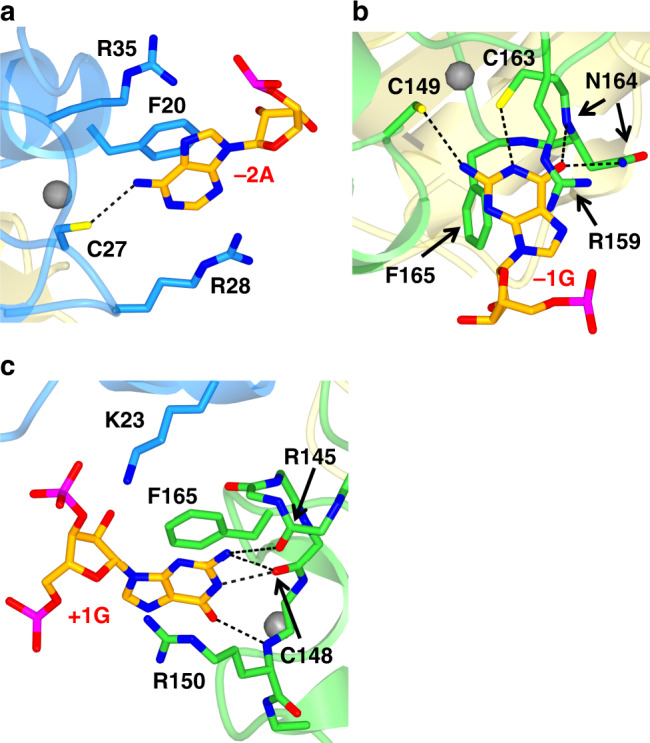
a Interaction of U2AF1 with adenine at −2 position. b Interaction of U2AF1 with guanine at −1 position and (c) with guanine at +1 position structures. In U2AF1, ZF1, ZF2, and RNA are colored as in Fig. 1b.
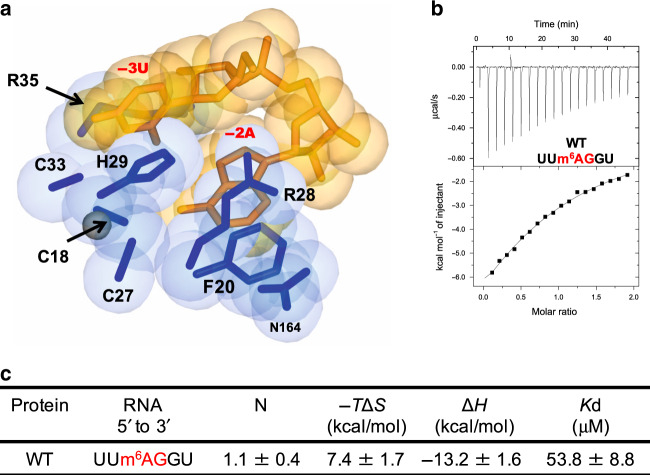
a Space-filling representation around the −2A base. The side chains of the U2AF1 amino-acid residues are shown in blue, and the RNA bases in orange. The interface around −2A base is intimately surrounded by the amino-acid residues of U2AF1. Thus, no space is found for the N6-methyl modification of the –2A base to interact with U2AF1. b Binding affinity of U2AF1 WT for the methyl modified RNA, 5′-UUm6AGGU, measured by ITC. Raw data and the corresponding binding curve are depicted. c RNA-binding activities calculated by ITC measurements. Mean value for the dissociation constant (Kd) with standard deviation is based on three independent measurements.
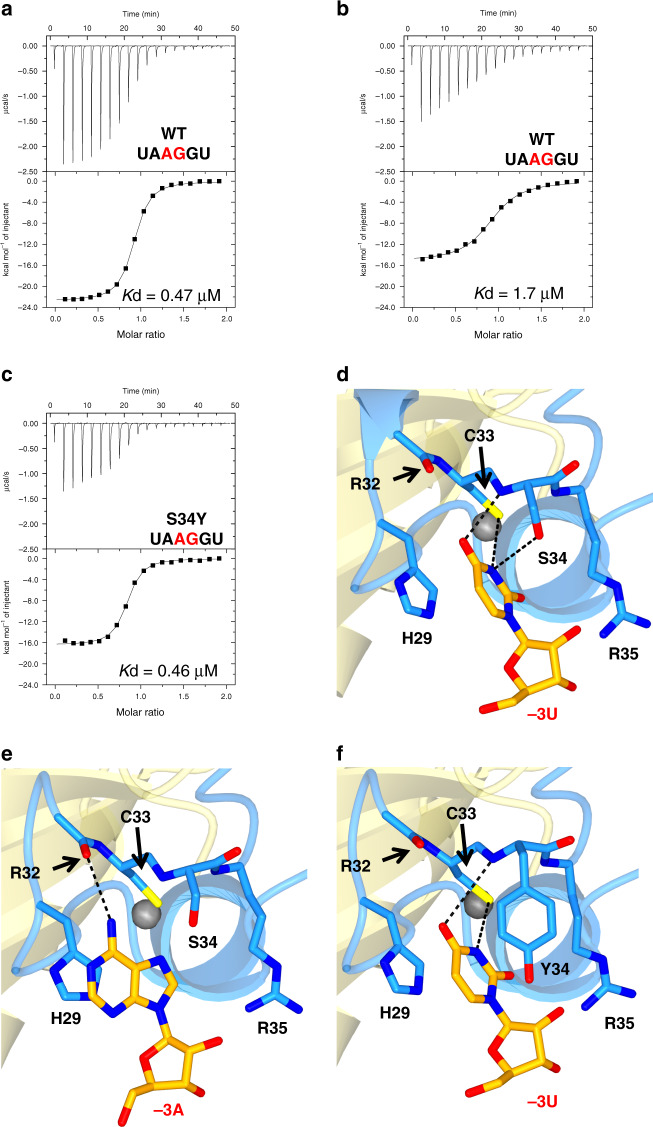
a Binding affinities of U2AF1 WT for the 5′-UUAGGU RNA, b for the 5′-UAAGGU RNA, and c S34Y for the 5′-UAAGGU RNA measured by ITC. Raw data and the corresponding binding curve are depicted. Mean value for the dissociation constant (Kd) with standard deviation is based on three independent measurements. Representative views of the interaction (d) between U2AF1 WT and −3 uridine, e between U2AF1 WT and −3 adenine, and (f) between U2AF1 S34Y and −3 uridine. U2AF1 and RNA are colored as in Fig. 1b.
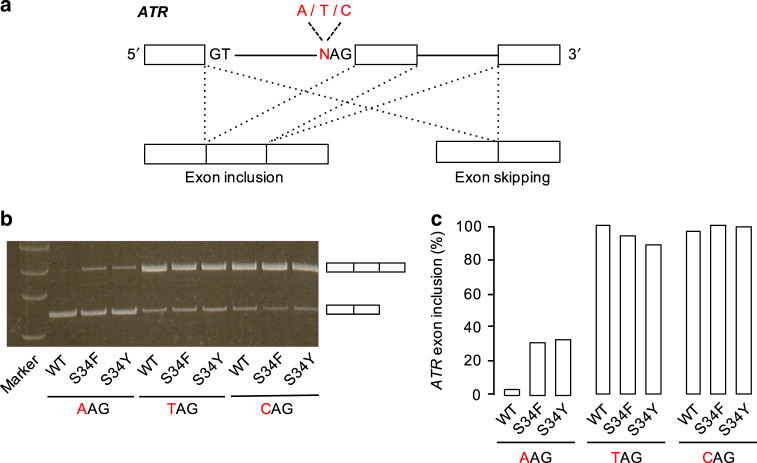
a Schematic diagram of ATR minigene designed for the splicing assay, which has different nucleotide A or T at the −3 position of the 3′ splice site. The minigene exons are shown as boxes, and introns as solid lines. Two different pre-mRNA splicing patterns are shown as exon inclusion and exon skipping. The RNA product of the exon inclusion is derived from the removal of two introns and junction of three exons, whereas that of the exon skipping is produced by the junction of exons at both ends. b Gel electrophoresis of RT-PCR products from HEK293 cells expressing WT or mutants of U2AF1. Upper fragments correspond to the product by the exon inclusion, and lower fragments correspond to that by the exon skipping. Raw image data of gel electrophoresis are shown in Supplementary Fig. 13. c The ratio of ATR exon inclusion and the skipping is quantified from the result of (b), and compared based on the amount from cells expressing WT with TAG minigene.
References
Publication types
MeSH terms
Substances
LinkOut - more resources
Full Text Sources
Molecular Biology Databases
