. 2020 Sep 21;11(1):4758.
doi: 10.1038/s41467-020-18455-z.

Rational programming of history-dependent logic in cellular populations

Affiliations

Rational programming of history-dependent logic in cellular populations

Ana Zúñiga et al. Nat Commun. .

Abstract

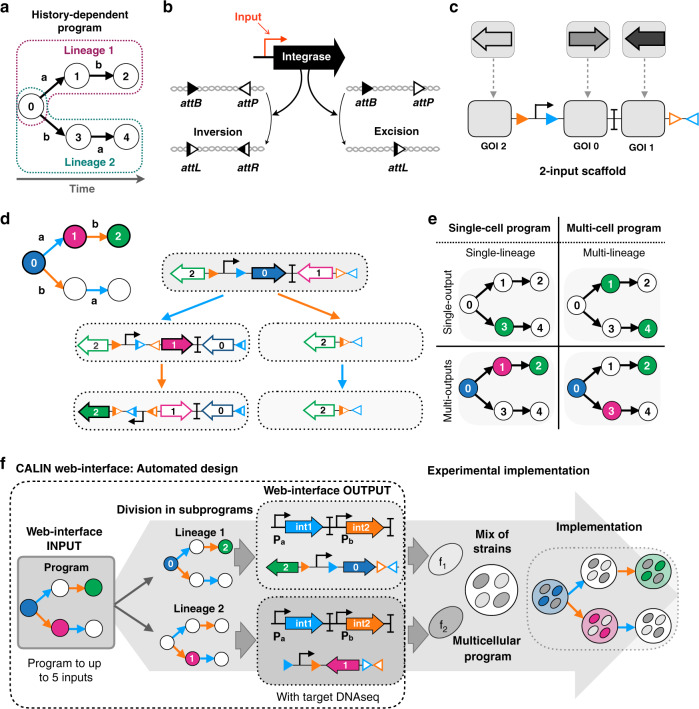
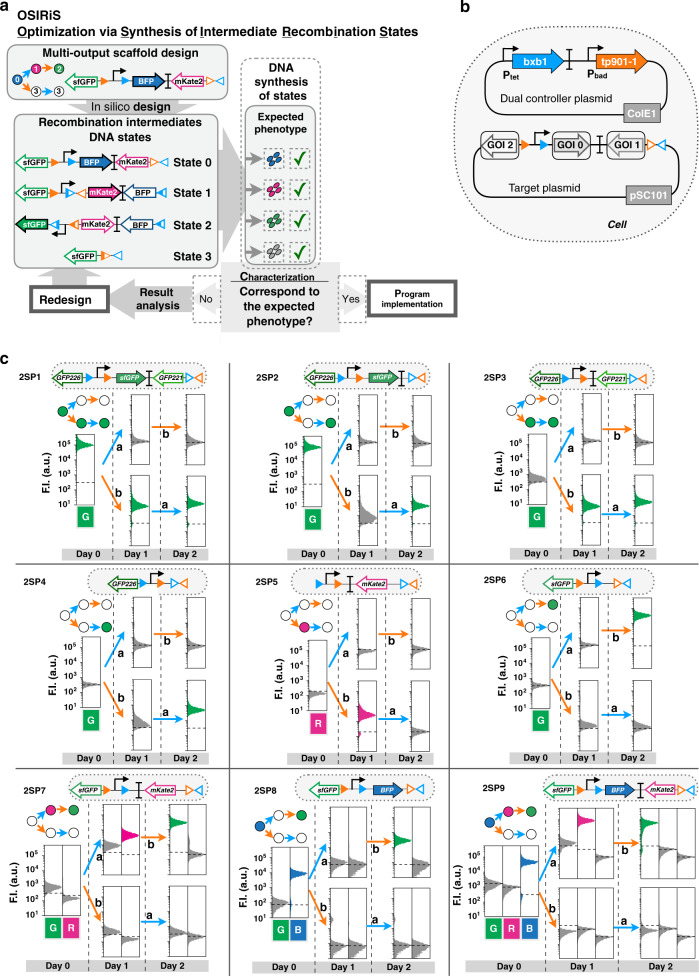
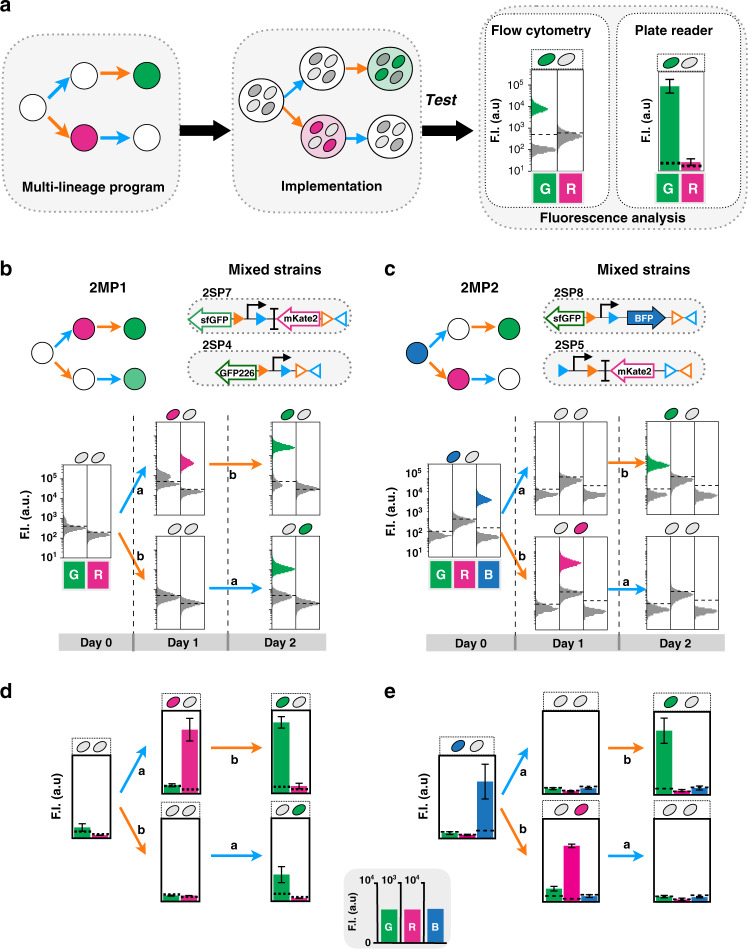
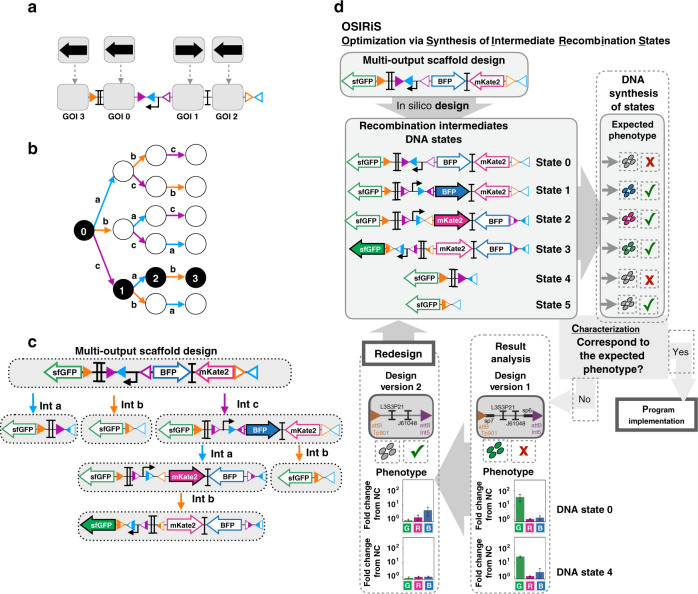
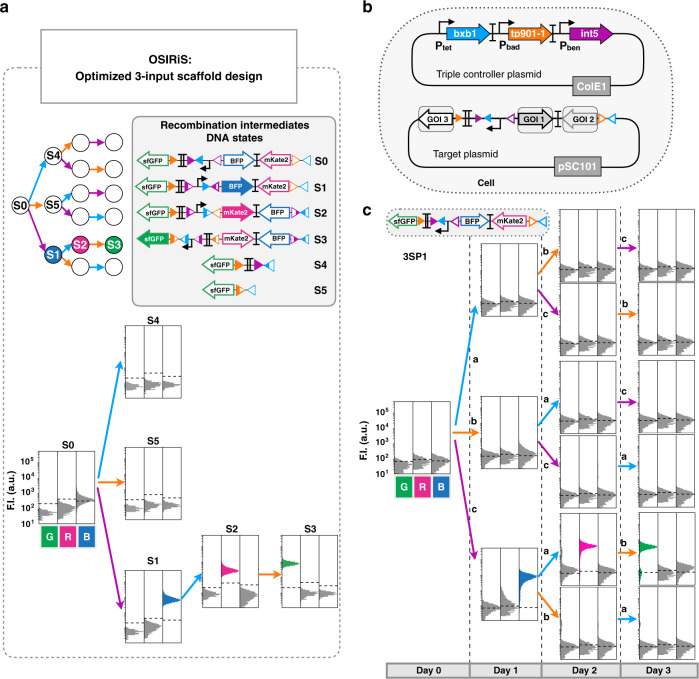
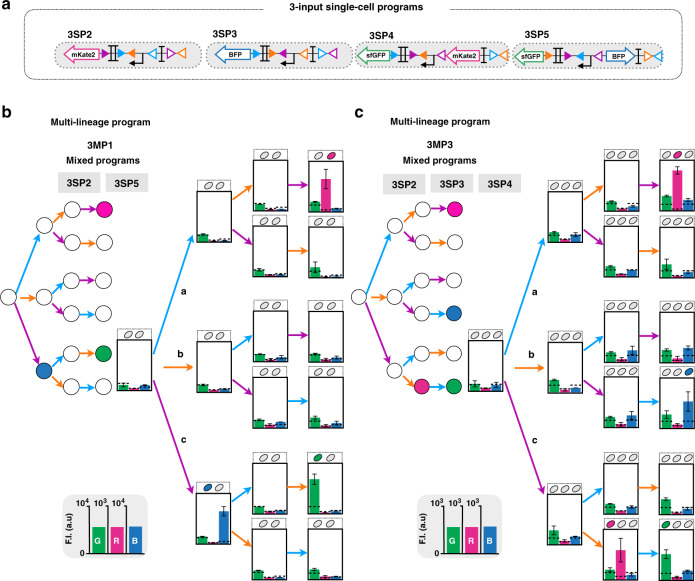
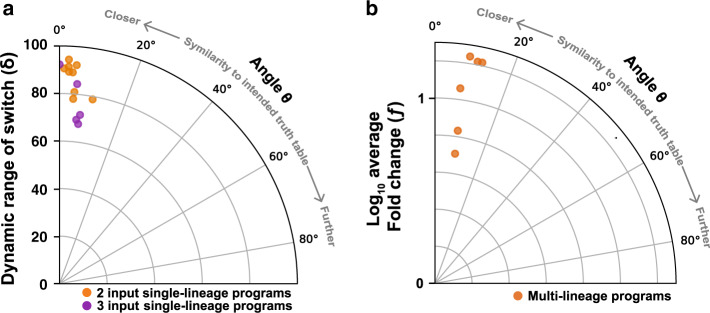
Genetic programs operating in a history-dependent fashion are ubiquitous in nature and govern sophisticated processes such as development and differentiation. The ability to systematically and predictably encode such programs would advance the engineering of synthetic organisms and ecosystems with rich signal processing abilities. Here we implement robust, scalable history-dependent programs by distributing the computational labor across a cellular population. Our design is based on standardized recombinase-driven DNA scaffolds expressing different genes according to the order of occurrence of inputs. These multicellular computing systems are highly modular, do not require cell-cell communication channels, and any program can be built by differential composition of strains containing well-characterized logic scaffolds. We developed automated workflows that researchers can use to streamline program design and optimization. We anticipate that the history-dependent programs presented here will support many applications using cellular populations for material engineering, biomanufacturing and healthcare.


Conflict of interest statement

The authors declare no competing interests.

Figures

Fig. 1
Fig. 1. Design of a modular scaffold for 2-input history-dependent multicellular programs.
a Lineage tree representing a history-dependent program. Letters represent the presence of the two inputs (a and b) and numbers on nodes represent states of the system associated with the order of occurrence of the inputs. For two inputs programs, five states are possible. b Integrase-mediated excision or inversion. When integrase sites are in the opposite orientation (left panel), the DNA sequence flanked by the sites is inverted. If integrase sites are in the same orientation (right panel), the DNA sequence flanked by the sites is excised. c 2-input history-dependent scaffold. Integrase sites are positioned to trigger expression of an output gene (arrows) or not (empty gray squares) in the corresponding lineage. Programs are implemented by inserting genes corresponding to the ON states in adequate scaffold positions. d DNA transitions, recombination intermediates, and gene-expression states for the 2-input scaffold. The corresponding lineage tree is represented in the upper left. e Single-cell programs operate in a single lineage and can control expression of single or multiple outputs. Multicell programs operate in multiple lineages and can control the expression of a single or multiple outputs. f Automated design of history-dependent programs. The CALIN algorithm takes as input a history-dependent program written as a lineage tree. CALIN decomposes multilineage programs into subprograms, each corresponding to a different lineage (a then b; b then a). For each subprogram, the algorithm identifies the ON states and the order of inputs within the lineage. Based on this information, the biological design is computed, and the software provides input/integrases connections, the architecture of history-dependent scaffolds and their corresponding DNA sequences. Each subprogram is executed in a different strain as a DNA device (f1, f2). The full program is implemented by composing the different strains into multicellular systems.
Fig. 2
Fig. 2. Characterization of 2-input single-lineage programs.
a OSIRiS workflow. A 2-input history-dependent scaffold with consecutive expressions of BFP, RFP, and GFP in one lineage is designed. The DNA sequences of the different input states corresponding to the intermediate recombination states are generated (DNA states). The DNA states sequences are synthesized and characterized and the phenotypes are compared to the expected ones. If they match, the implementation of the program is performed. Otherwise, the results are precisely analyzed to identify the origin of the failure, the multioutput scaffold is redesigned and a new OSIRiS cycle is performed. b genetic design of the two plasmid used to characterize each program. The dual-controller plasmid regulates the gene expression of the Bxb1 and Tp901-1 integrases. The target plasmid corresponds to the 2-input history-dependent scaffold. c Nine single-lineage history-dependent programs (2SP1–2SP9) exhibiting lineage specific, or state-specific gene expression with single or multiple genetic outputs were implemented and characterized. Bxb1 and Tp901-1 are induced by aTc (input a) and by arabinose (input b), respectively. The lineage tree for each program and its corresponding genetic DNA device are represented. Cells transformed with both plasmids were sequentially induced twice for 16 h, at which point fluorescence intensity was measured by flow cytometry. Each histogram shows the expression of fluorescent reporters expressed at different induction states. All experiments were performed in triplicate three times on three different days. A representative example from three biological replicates is depicted here. Fold change measurements can be found in Fig. S5.
Fig. 3
Fig. 3. Characterization of 2-input multicellular programs.
Workflow characterization of 2-input multicellular programs (a). After the input program design, single-lineage programs are mixed and the multicellular program is implemented. The program characterization is done by fluorescence measurements by flow cytometry and plate reader. The flow-cytometry analysis allows us to observe the percentage of population ON and OFF for one state. Design and characterization of 2-input multicellular program 2MP1 and 2MP2, by flow cytometry (b, c) and plate reader (d, e), respectively. Both multicellular programs were implemented using two different single-lineage strains. The lineage trees for each program and its corresponding genetic DNA device are represented. The inputs are represented by letters, a for aTc inducing Bxb1 Integrase and b for arabinose inducing Tp901-1 integrase. To implement each program, the strains were mixed in similar proportions, grown for 16 h and sequentially induced with each molecule. Each histogram shows the expression of fluorescent reporters at different induction states. A representative example is depicted here. The bar graph corresponds to the mean value of the fluorescence intensity (F.I.) in arbitrary units (a.u) for each fluorescent channel (G (GFP), R (RFP), and B (BFP)) with linear different scales. All experiments were performed in triplicate three times on 3 different days (data distribution in dot plots in Fig. S7c–f). The error bars correspond to the ±standard deviation of the mean of the three different experiments. The dotted line indicates the negative autofluorescence from control strain. Note that GFP226 has a lower fluorescence intensity than sfGFP, as expected.
Fig. 4
Fig. 4. Design of a modular scaffold for 3-input history-dependent programs.
3-input history-dependent scaffold (a) and its lineage tree (b). Integrase sites are positioned to permit expression of an output gene in various states of the lineage tree. For each state of the desired lineage, a different gene is expressed, and a gene is also expressed when no input is present. The four columns of the lineage tree correspond to different numbers of inputs that have occurred sequentially (from 0 to 3 inputs) and the six lineages correspond to different order of occurrences of inputs (example: a–b–c for lineage 1 and b–a–c for lineage 3). c DNA and gene-expression states of the scaffold. The gene at the GOI position 0 is expressed only when no input is present. The scaffold has six different DNA states. d Optimization of the 3-input scaffold using OSIRiS. For a given 3-input program, a scaffold with consecutive expressions of BFP, RFP, and GFP in one lineage is designed. From this design, six intermediate DNA states are generated and the expected phenotype for each DNA state of the tree is predicted. Two versions of this 3-input scaffold were analyzed. Version 1 was producing unexpected GFP fluorescence in state 0 and state 4. Version 2 is an optimized design from version 1, in which two DNA sequences corresponding to spacers sp7 and sp6, flanking L3S2P21 and J61048 terminators, were removed. The fluorescence intensities in different channels for two versions in DNA states 0 and 4 is shown. The bar graph corresponds to the fold change over the negative control (strain without fluorescent protein) for each channel (GFP, RFP, and BFP) from three experiments with three replicates per experiment. The error bars correspond to the standard deviation between the fold changes obtained in three separate experiments.
Fig. 5
Fig. 5. Characterization of scaffold for 3-input history-dependent programs.
a Characterization of the final 3-input scaffold and its recombination intermediates DNA states by flow cytometry. We characterized each DNA state by measurement of GFP, RFP, and BFP fluorescence intensities. Each histogram shows fluorescent reporters expressed in the different DNA states, from three experiments with three replicates per experiment. A representative example is depicted here. A detailed design for the final 3-input scaffold and fold change measurements can be found in Fig. S8. b Genetic design of the two plasmids used to implement 3-input programs. The triple controller plasmid regulates the expression of Bxb1, TP901-1, and Int5 integrases. The target plasmid corresponds to the 3-input history-dependent scaffold. c Characterization of a 3-input history-dependent scaffold. We cotransformed the 3-input program with the triple controller plasmid. Bxb1 expression is induced by aTc (input a), Tp901 by arabinose (input b), and Int5 by benzoate (input c). The lineage tree for the program and its corresponding genetic DNA device is represented. For characterizing the system, cells were sequentially induced three times for 16 h each, with different order of occurrences of inputs. Each histogram shows fluorescent reporters expressed in different states. All experiments were performed in triplicate three times on three different days. A representative example is depicted here. Fold change measurements can be found in Fig. S12.
Fig. 6
Fig. 6. Characterization of 3-input multicellular programs.
Design and characterization of 3-input single-cell (single-lineage) programs operating in various lineages (a). Multicellular programs were composed by mixing two (b) or three (c) single-lineage programs. The inputs are represented by letters, a (blue) for aTc (expression of Bxb1 Integrase), b (orange) for arabinose (expression of integrase TP901-1), and c (purple) for benzoate (expression of Int5). Strains were mixed in equal proportions and sequentially induced three times for 16 h each, with different order of occurrences of inputs. The bar graph corresponds to the mean value of fluorescence intensity (F.I.) in arbitrary units (a.u) for each fluorescent channel (GFP, RFP, and BFP), with different and linear scales each. All experiments were performed in triplicate three times on three different days (data distribution in dot plots in Fig. S14). The error bars correspond to the ± standard deviation of the mean of the three different experiments performed in triplicate on three different days, and measured using a plate reader. The dotted line indicates the autofluorescence of negative control strain.
Fig. 7
Fig. 7. Robustness of history-dependent programs.
Angles representing the similarity between biological and the ideal implementation of history-dependent programs were plotted. The lower the angle deviation is from 0°, the closer the program behavior is to its expected one. a Switching robustness, with angles computed from percentage of cell versus the worst-case switching rate of the switch (δ), were plotted. b Implemented multicellular programs robustness with angles evaluated between biological and expected fluorescence from plate reader measurement versus the logarithm of average fluorescence fold change (f) were plotted.

Similar articles

Cited by

References

    1. Anderson PW. More is different. Science. 1972;177:393–396. - PubMed
    1. Doebeli M, Ispolatov I. Complexity and diversity. Science. 2010;328:494–497. - PubMed
    1. Durand PM, Sym S, Michod RE. Programmed cell death and complexity in microbial systems. Curr. Biol. 2016;26:R587–R593. - PubMed
    1. Wolpert L. Positional information and pattern formation. Curr. Top. Dev. Biol. 2016;117:597–608. - PubMed
    1. Byrne KM, et al. Bistability in the Rac1, PAK, and RhoA signaling network drives actin cytoskeleton dynamics and cell motility switches. Cell Syst. 2016;2:38–48. - PMC - PubMed

Publication types