. 2020 Nov;23(11):1433-1443.
doi: 10.1038/s41593-020-00706-3. Epub 2020 Sep 21.

Revealing the structure of pharmacobehavioral space through motion sequencing

Affiliations

Revealing the structure of pharmacobehavioral space through motion sequencing

Alexander B Wiltschko et al. Nat Neurosci. 2020 Nov.

Abstract

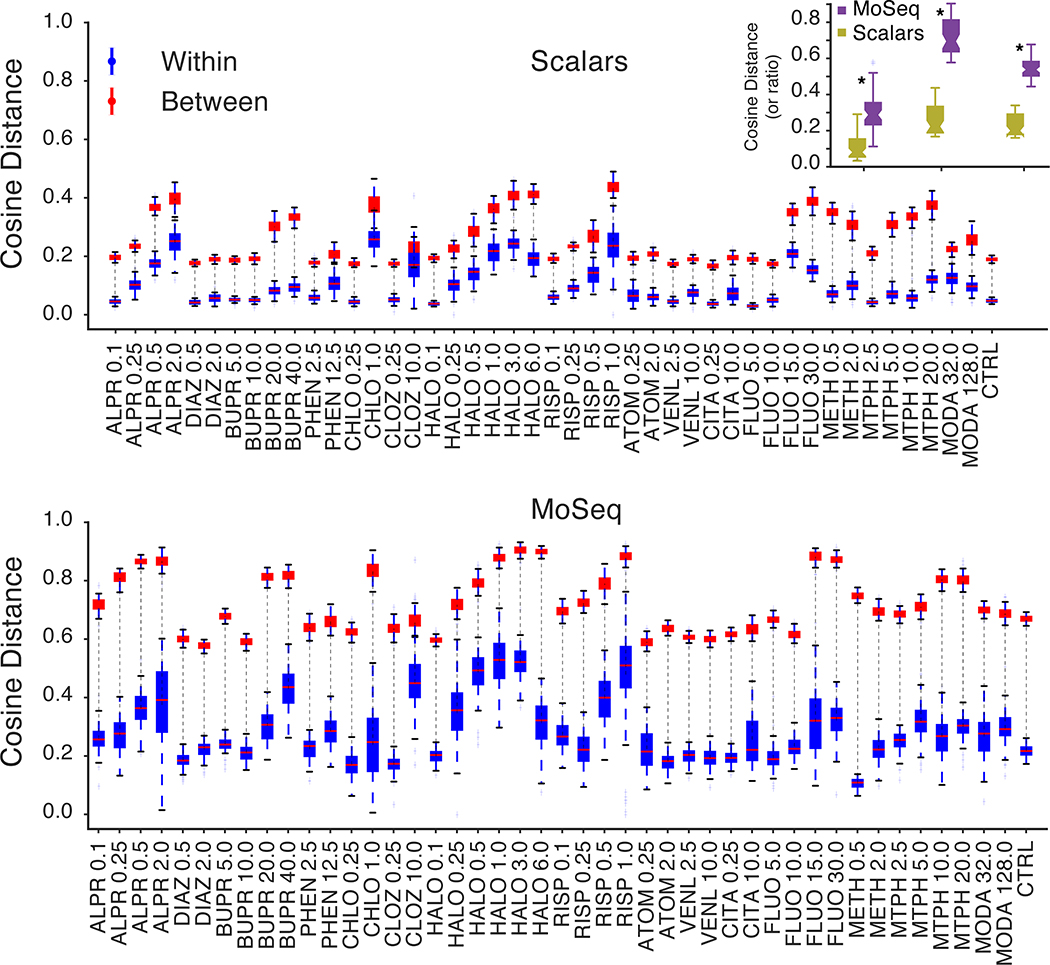
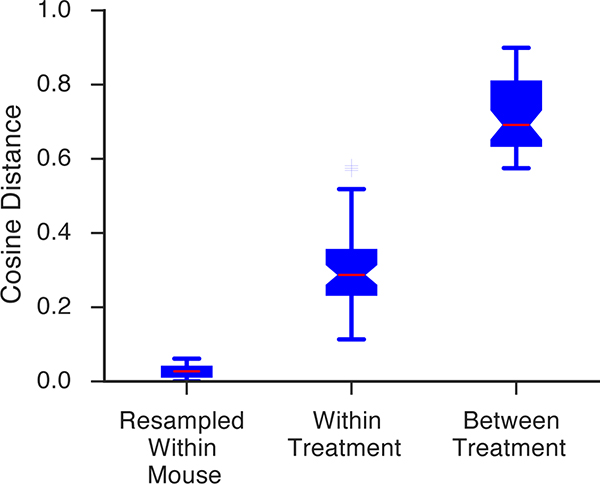
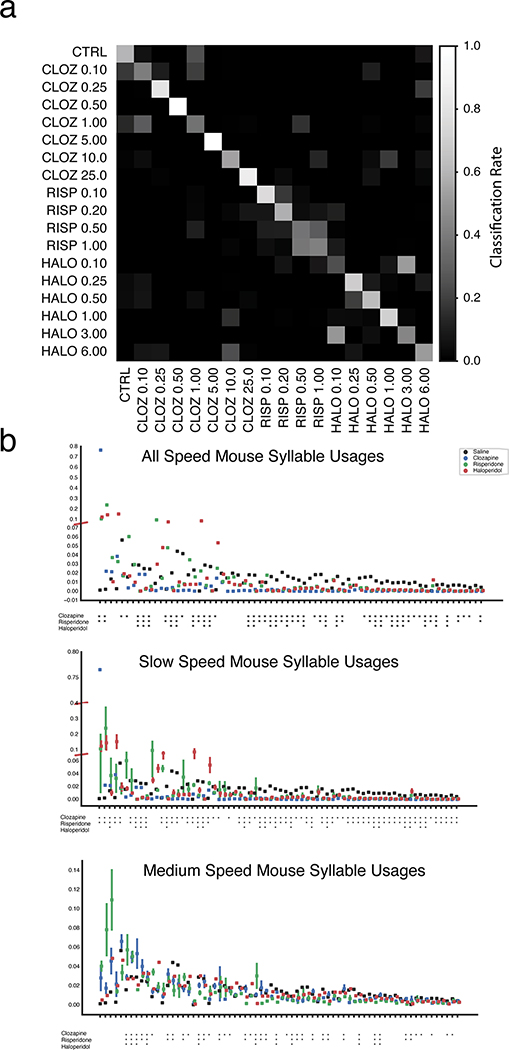
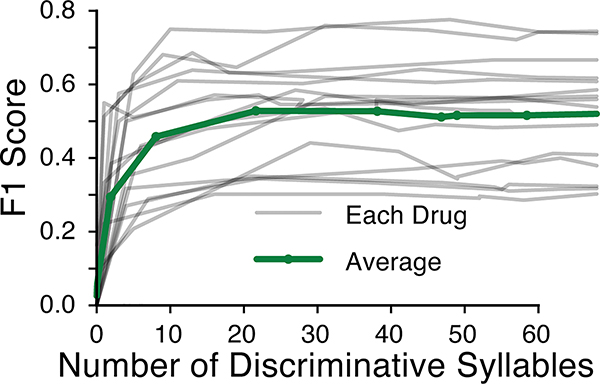
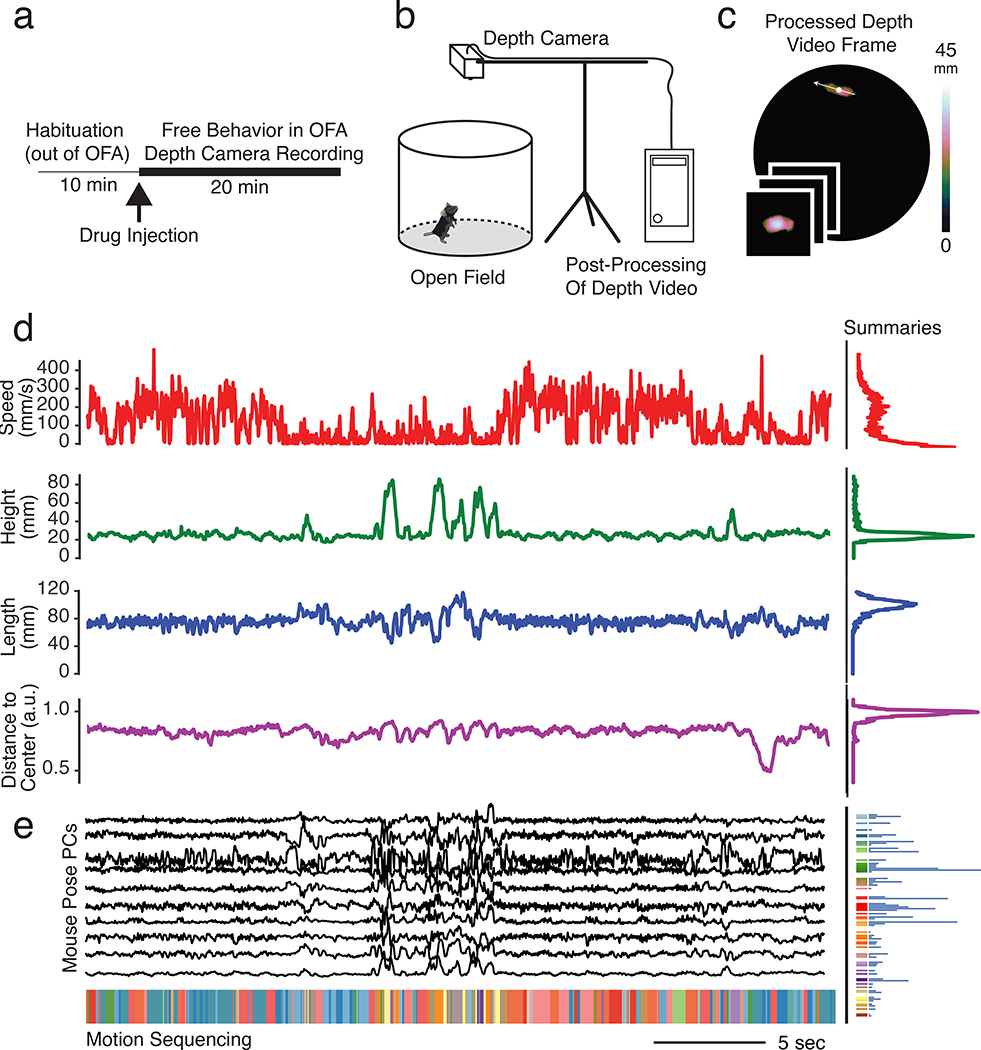
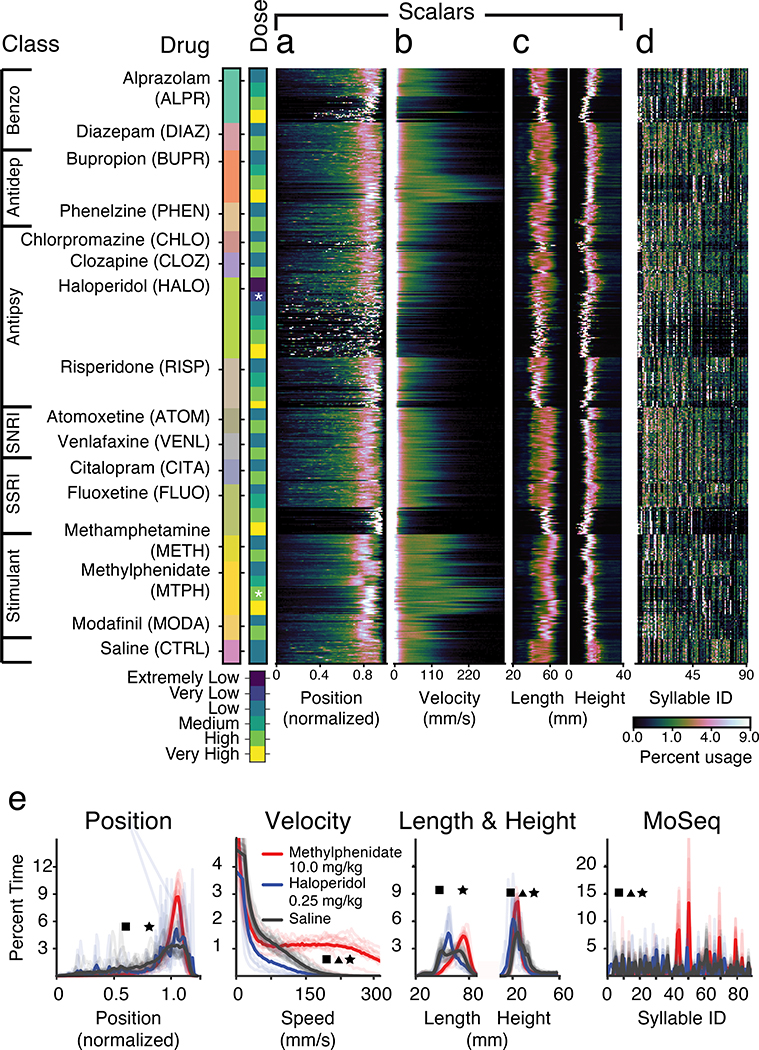
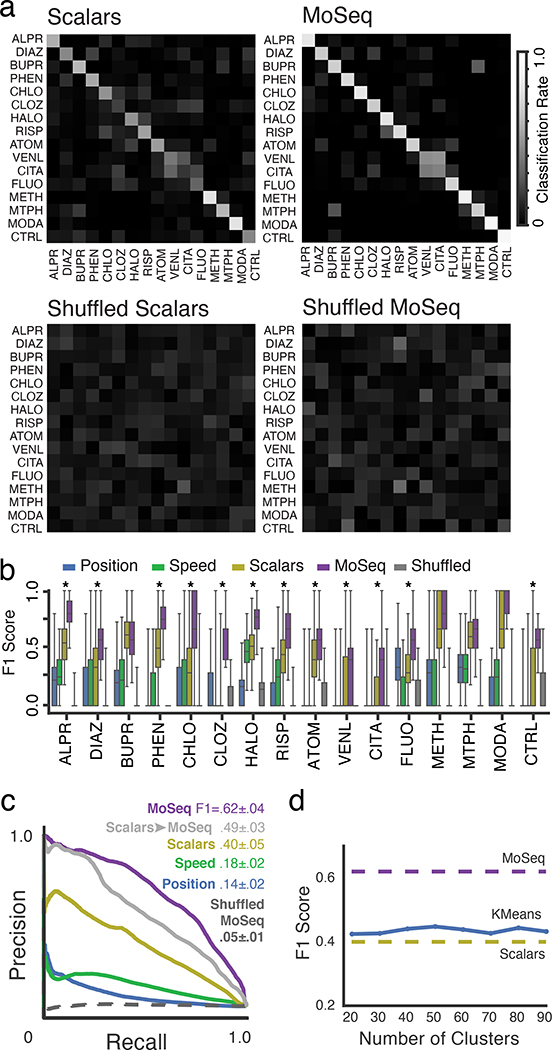
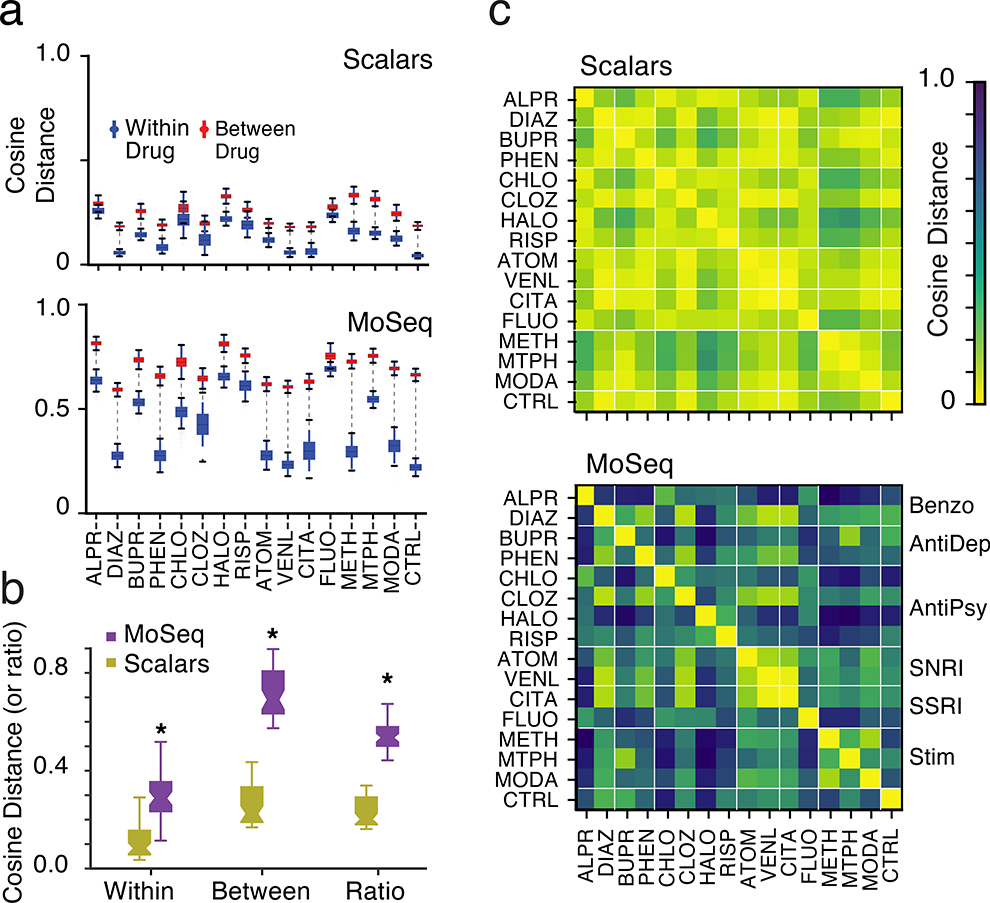
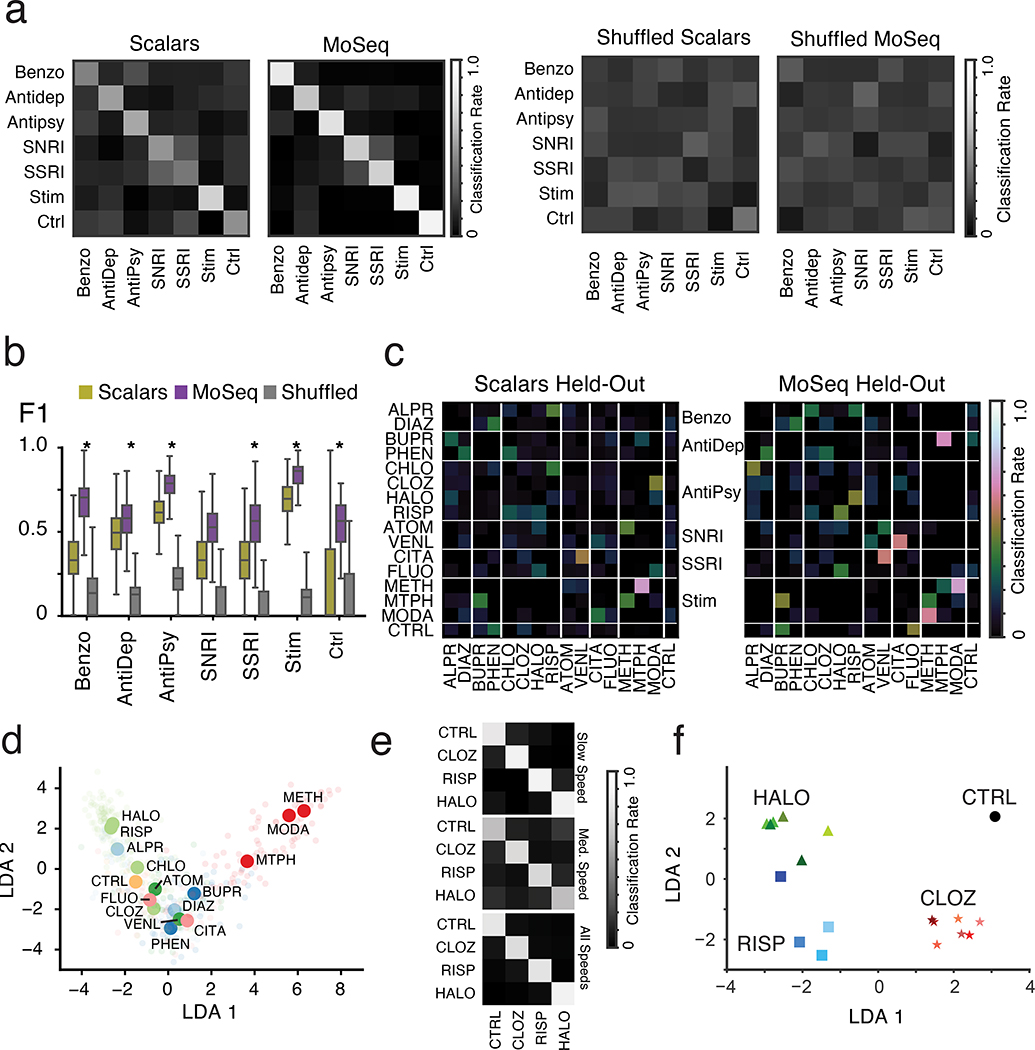
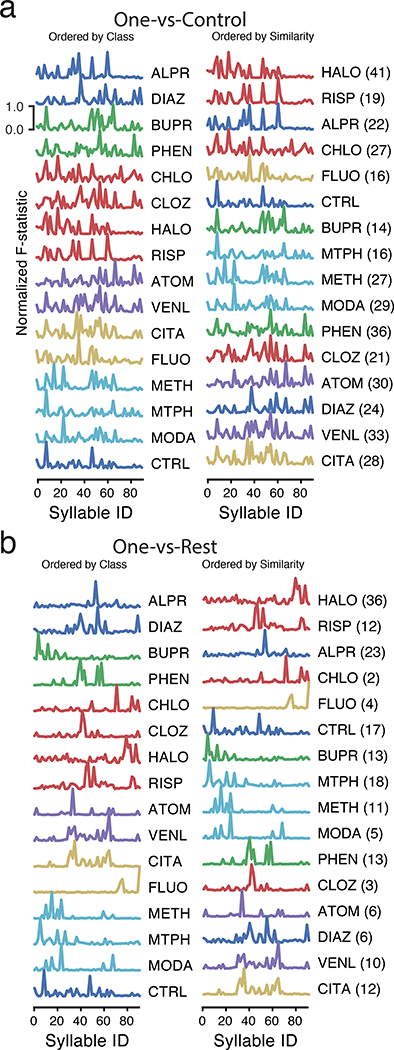
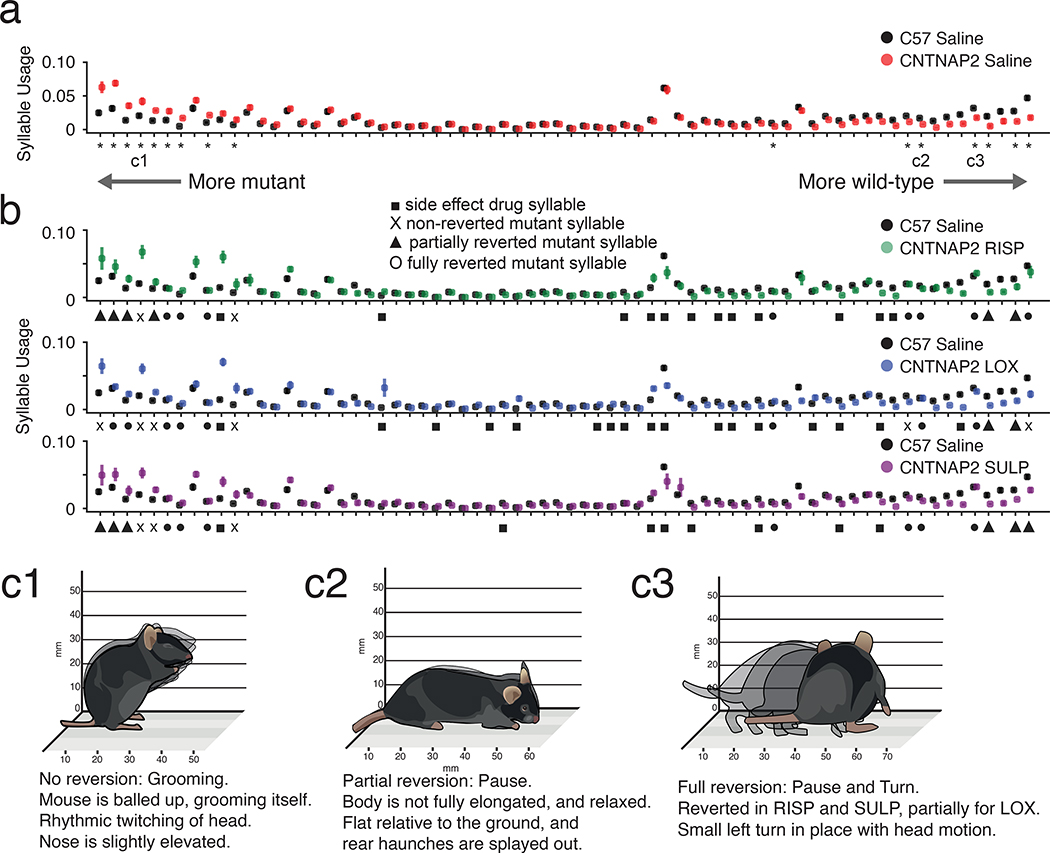
Understanding how genes, drugs and neural circuits influence behavior requires the ability to effectively organize information about similarities and differences within complex behavioral datasets. Motion Sequencing (MoSeq) is an ethologically inspired behavioral analysis method that identifies modular components of three-dimensional mouse body language called 'syllables'. Here, we show that MoSeq effectively parses behavioral differences and captures similarities elicited by a panel of neuroactive and psychoactive drugs administered to a cohort of nearly 700 mice. MoSeq identifies syllables that are characteristic of individual drugs, a finding we leverage to reveal specific on- and off-target effects of both established and candidate therapeutics in a mouse model of autism spectrum disorder. These results demonstrate that MoSeq can meaningfully organize large-scale behavioral data, illustrate the power of a fundamentally modular description of behavior and suggest that behavioral syllables represent a new class of druggable target.


Conflict of interest statement

Competing Interest Statement

The authors declare the following competing interests: ABW, MJJ and SRD are co-founders of Syllable Life Sciences, Inc. ABW and SRD are co-authors on awarded patents WO2013170129A1 and US10025973B2, which describe behavioral methods used herein.

Figures

Extended Data Fig. 1.
Depth cameras are used to capture 3D video data encapsulating mouse postural dynamics in the open field. These data are saved locally before being uploaded to the cloud, where the videos are denoised and aligned. The image of the mouse is then extracted from the larger image; at this step, scalar behavioral metrics (like the position of the mouse within the arena, or its velocity) are computed. After extraction, aligned 3D mouse images are analyzed either locally or in the cloud, depending upon resource demands. 3D mouse images are compressed by PCA (for ease of computation), then these data are used to train an AR-HMM (as in Wiltschko et al). The output of this training procedure is the optimal set of behavioral syllables that describe the 3D pose dynamics observed within the experiment (each of which is described as an autoregressive process through pose space). Every frame of the imaging data is then labeled with behavioral syllable MoSeq considers most likely, thereby revealing the behavioral grammar that governs the transitions from any given syllable to any other syllable. Herein, each mouse is characterized by a MoSeq behavioral summary that includes only information about how often each behavioral syllable is expressed during the experiment (without consideration of the syllable transition matrix), whereas the scalar summary includes a wide variety of data describing the mouse’s behavioral comportment (including height, length, speed, position). These MoSeq and scalar behavioral summaries are then submitted to linear classifiers to predict the identity of the drug, drug and dose, or drug class to which each mouse was exposed.
Extended Data Fig. 2.
a. Scanning the MoSeq kappa parameter (which sets the timescale at which syllables are identified) reveals a value at which the modal syllable length matches the model-free block length identified by changepoints analysis (see Methods). b. The mode of the syllable duration distribution established by MoSeq, given the kappa established in a, matches that for the model-free changepoint distribution. c. Ninety percent of the total frames are explained by 92 behavioral syllables; for the sake of simplicity herein we analyze the top 90 syllables.
Extended Data Fig. 3.
A cladogram describing behavioral relationships among syllables was computed using hierarchical clustering performed on the autoregressive matrices describing all syllables (see Methods). Nine general behavioral categories were identified after visual inspection and given natural language names. Illustrations are representative of syllables in each category.
Extended Data Fig. 4.
a. Normalized confusion matrices as in Fig. 3a, but computed for all drug/dose combinations. For the shuffled control (bottom row), syllable labels were shuffled on a per-mouse basis to compute a baseline of expected random performance. Heat map indicates classification successes and errors (see Methods for summary definitions). b. Mean precision-recall curves for all drugs and doses, computed for each behavioral summary type. c. The Fukunaga and Olsen method441 was used to estimate the effective dimensionality of both scalar and MoSeq summaries; this analysis demonstrated that that MoSeq has a higher effective dimensionality than scalars (34 versus 26 dimensions), using a threshold value of 0.01 (see Methods).
Extended Data Fig. 5.
a. Additional information was added to the MoSeq and scalar behavioral summaries used to predict drug identity. For “MoSeq++,” the empirical transition matrix derived from the syllable label sequence was calculated, flattened, and concatenated to the syllable usage frequency information. For “Scalars++,” histograms of mouse acceleration, the mouse’s heading, the area contained by the mouse’s body contour, the ellipticity of the best-fit ellipse around the mouse’s contour, and the mouse’s width were added to the initial scalar behavioral summary. b. The granularity of the bins used to generate scalar behavioral summaries was systematically varied; bin size did not affect classification performance. c. To ensure that the higher dimensionality of the scalar summaries did not adversely affect performance, behavioral summaries containing scalars were also subjected to PCA to assess the consequences of dimensionality reduction (keeping the number of dimensions required to capture 95 percent of the variance; for scalars this is 33 dimensions); although performance was modestly improved, performance did not equal that observed for MoSeq.
Extended Data Fig. 6.
Average cosine distance ±1 standard deviation of mice given the same drug/dose pair (blue) and mice given different drug/dose pairs (red) using either scalar- (top) or MoSeq-based behavioral summaries (bottom). The difference observed between mice given the same drug/dose pair and different drug/dose pairs is uniformly larger when behavior is summarized using MoSeq when compared to scalars. Inset: summary of mean within- and between- class differences and their ratio for either scalar- and MoSeq-based analysis. MoSeq shows larger differences (two-sided paired t-test, p<0.05, stars indicate statistically significant differences between MoSeq and scalars).
Extended Data Fig. 7.
To test whether the cosine distances that separate individual mice within a treatment class reflect individual variability or technical noise, we subsampled the data from each individual mouse and then asked how these sub-samples of each individual mouse compared to each other; observing low variability in these sub-samples would be consistent with each individual mouse expressing a stable set of behavioral syllables within an experiment, and with the within-condition variability observed across mice reflecting differences in individual mouse responses to a given drug and dose. In specific, within-mouse variability of MoSeq was assessed by randomly picking 1000 frames (with replacement) of the 3D imaging data (which for each mouse was constituted of approximately 36,000 frames), identifying the syllable associated by MoSeq with that frame, and then using those syllable labels to compute overall syllable usages; this procedure is roughly equivalent to randomly choosing less than one third of the syllables to quantify the pattern of syllable usage within a mouse. We repeated this procedure 100 times, and by computing cosine distances between each sub-sample within-mouse variability could be assessed. The bootstrapped estimate of individual variability (Resampled Within Mouse) was lower than the treatment-induced variability (Within tTreatment), as measured by the cosine distance between all pairs of mice given the same treatment, and was also lower than the cosine distance between pairs of mice given different treatments (Between Treatment). Thus the observed within-treatment variability reflects stable differences in behavior expressed by individual mice.
Extended Data Fig. 8.
a. Similar as Fig. 3a, but classifying drug/dose identity instead of drug identity, across the entire risperidone, haloperidol, clozapine dose-response experiment. Many significant syllables that differentiated drug-treated mice from controls were, by inspection, behaviors like grooming or rearing that do not include significant two-dimensional velocity components (data not shown). b. Syllable usages for all mice and all drug/dose combinations (top), doses which resulted in slow mouse movement speed (middle) or moderate movement speed (bottom). Slow and medium speeds (relative to normal) were identified via a Gaussian Mixture Model (mean centroid speed of saline control mouse = 74 mm/sec; “medium speed” = 54 mm/sec; “slow speed” = 24 mm/sec; see Methods). Significant differential syllable usage for each drug versus control indicated with an asterisk (Kruskal-Wallis and post-hoc Dunn’s two-sided test with permutation, with Benjamini/Hochberg FDR with alpha = 0.05).
Extended Data Fig. 9.
Sparsification reveals the number of syllables required to correctly distinguish each drug, as assessed by F1 scores emerging from linear classifiers trained on subsets of syllables (see Methods).
Fig. 1.
Fig. 1.. Motion Sequencing (MoSeq) captures 3D mouse pose dynamics after drug treatment.
a. Trial structure for mouse open field assay (OFA)-based behavioral imaging. b. Mouse 3D pose dynamics were recorded using depth cameras placed above the arena, with raw frames stored locally and then processed in a cloud computing environment (see Methods). c. A pre-processing pipeline identifies the mouse within the depth image, enabling analysis of 3D pose dynamics as well as quantification of scalar behavioral metrics (see Methods). d. Imaging-based distributions of an example mouse’s speed, height, length and distance to arena center during a 30 second example snippet. e. The first ten principal components of the pre-processed 3D imaging data (top) were fed to the MoSeq algorithm to assign each frame to a particular behavioral syllable (bottom, see Extended Data Fig. 1). The number of times each syllable is expressed during this 30 second example snippet is represented as a histogram (right); for each mouse a MoSeq-based behavioral summary was generated using 20 minutes of data.
Fig. 2.
Fig. 2.. Generating behavioral diversity though pharmacology.
a. Each mouse (rows) was treated with the indicated drug, and the distribution of mouse positions normalized to the arena center position was computed. Drug class is indicated at left (here and throughout, Benzo = benzodiazepine, Antidep = antidepressant, Antipsy = antipsychotic, SNRI = serotonin non-specific reuptake inhibitor, SSRI = serotonin selective reuptake inhibitor; see Supplementary Table 1 for the number of mice per treatment). b. Same as a. but for velocity. c. Same as a. but for length and height. d. Same as a. but the behavioral summary is composed of how often each MoSeq-identified syllable (arrayed on x-axis) was used. e. Comparisons of behavioral summaries for methylphenidate, haloperidol and saline at the doses indicated by the stars in the “dose” column in a. (p<0.05, square indicated significant differences between methylphenidate and haloperidol, triangle between haloperidol and saline, and star between methylphenidate and saline; two-sided Mann-Whitney U test is used on mean values for scalars; for MoSeq syllable differences using a two-factor MANOVA; faint lines represent distribution of individual mice).
Fig. 3.
Fig. 3.. MoSeq discriminates drug-induced patterns of behavior
a. Normalized classification matrices (across rows and columns, plots represent classifier means after 500 cross-validation folds, see Methods for details and Supplementary Table 1 for number of mice used per treatment) summarizing the performance of a linear classifier at distinguishing different drugs based upon the indicated behavioral summary. Perfect classifier performance (in which each mouse is correctly assigned to its drug label) corresponds to white along the diagonal and black on the off-diagonal (i.e., a classification rate of 1). For the shuffled control (bottom row), drug labels were shuffled on a per-mouse basis to compute a baseline of expected random performance. Heat map indicates classification successes and errors (see Methods for summary definitions). Drug abbreviations here and throughout as indicated in Fig. 2. b. F1 values, reflecting classification accuracy, for all behavioral summaries, including a label-shuffled random baseline. Box plots represent the distribution across 500 cross-validation folds, with whiskers representing 1.5 times the inter-quartile range. Shuffle controls as in a (p<0.01, paired two-sided t-test, Holm-Bonferroni step-down correction; stars indicate statistically-significant differences between MoSeq and scalars) c. Mean precision-recall curves and F1 values for all summary types across all drug treatments. Shuffle controls as in a. “Scalars -> MoSeq” indicates performance observed when modeling scalar values rather than 3D imaging data using MoSeq. d. Mean F1 score of an alternative behavioral summary, constructed by performing KMeans clustering (with cluster number indicated) on the 3D image principal components (see Methods). Note that the MoSeq summaries are composed of 90 syllables, which corresponds to the maximum number of clusters chosen for analysis here. For comparison, mean F1 predictive performance scores are indicated for MoSeq and scalars.
Fig. 4.
Fig. 4.. MoSeq enhances the separation between treatment classes relative to scalars.
a. Average cosine distances of individual mice given the same drug (blue) compared to mice given different drugs (red, ±1 standard deviation indicated; see Supplementary Table 1 for number of mice used per treatment). b. Mean within- and between-treatment cosine distances, and their ratio, for scalar summaries and MoSeq (p<0.05, stars indicate significant difference between MoSeq and scalars, paired two-sided t-test). c. Average pairwise cosine distances between mice given indicated drug treatments (distance indicated by color bar; lines separate drug classes indicated to right of lower panel).
Fig. 5.
Fig. 5.. MoSeq reveals behavioral relationships between drug classes and can distinguish catalepsy from sedation.
a. Normalized classification matrices (across rows and columns, plots represent means after 500 cross-validation folds, see Methods) summarizing classification performance of linear classifiers trained to predict drug class on a mouse-for-mouse basis (left). Heat map indicates classification successes and errors; perfect classifier performance (in which each mouse is correctly assigned to its class label) corresponds to white along the diagonal and black on the off diagonal (i.e., a classification accuracy of 1). For the shuffled control (right), class labels were shuffled on a per-mouse basis to compute a baseline of expected random performance. See Supplementary Table 1 for number of mice used per treatment. b. F1 scores for linear classifiers designed to predict pharmacological drug class on a mouse-for-mouse basis. Box plots represent the distribution across 500 cross-validation folds, with whiskers representing 1.5 times the inter-quartile range (p < .01, stars indicate significant differences between MoSeq and scalars, paired two-sided t-test corrected with Holm-Bonferroni step-down procedure, see Methods). Shuffle control performed as in a. c. Held-out confusion matrices (across rows and columns) indicating the classification of a given drug when that drug was excluded from the drug classifier (and thus these matrices represent confusions made over 16 separate classifiers). This procedure identifies the drugs most confused with the query drug (given that, by design, the held-out classifier must identify a non-query drug as the correct label for each mouse). As correct within-drug classification is impossible in this representation, the diagonal is dark (plots depicts means after 500 cross-validation folds, see Methods for details of “held-out” classification, drug classes are indicated). d. Linear discriminant analysis (LDA) plot indicating the similarity between the mean behavioral summaries of mice across drug treatments. Opaque circles indicate mean summary embeddings, and semi-transparent circles show the embedding location of each mouse. Colors indicate drugs from the same pharmacological class. e. Normalized classification matrices for different drugs, where the specific doses chosen for each drug were grouped based upon mouse speed (mean centroid speed of saline control mouse = 74 mm/sec; “medium speed” = 54 mm/sec; “slow speed” = 24 mm/sec; see Methods for description of Gaussian Mixture Model-based method for grouping doses based upon speed). Perfect classification is indicated by white along the diagonal and black off diagonal; the high degree of predictability when stratifying different below normal speeds demonstrates that MoSeq can distinguish these drugs independent of their effects on gross movement. f. LDA plot indicating the observed mean MoSeq-characterized pattern of syllable usages for the three indicated drugs (green = haloperidol, red = clozapine, blue = risperidone) at doses tiling very low (light) to very high (dark, see Methods). In general, all doses of each drug cluster together in LDA space, and separate from a control saline treatment, although at the highest doses risperidone and haloperidol elicit similar patterns of behavior (see darkest blue square and darkest green triangle).
Fig. 6.
Fig. 6.. Subsets of syllables fingerprint each drug.
a. A normalized F statistic identifies the quantitative relevance of each indicated syllable for discriminating a given drug treatment from a control saline treatment; ordering on left is based upon pharmacological class, ordering on right is based upon similarities in the F statistic-identified syllables. The number of significant syllables is indicated next to the drug treatment name on the right (Holm-Bonferroni corrected p<0.01 from the two-sided F-test). The control treatment F statistic is computed by comparing against all other treatments. b. Same as a. but computing the F statistic between a given drug treatment and all other treatments; the all-vs-all comparison reveals many fewer statistically-significant syllables than when comparing to control alone. Note that those syllables that distinguish a given drug from control can be distinct from those that maximially distinguish a particular drug from all other tested drugs.
Fig. 7.
Fig. 7.. MoSeq-based phenotypic fingerprinting reveals on- and off-target drug effects in a mouse model of autism spectrum disorder.
a. Usage plots for wild-type (black) and Cntnap2 −/− (red) mice injected with saline control (bootstrapped 95% confidence intervals indicated). Syllables sorted by the degree to which they are overused in the mutant (see Methods), with differentially used syllables marked by asterisks (for all statistical tests in this figure, Kruskal-Wallis and post-hoc Dunn’s two-sided test with permutation, with Benjamini/Hochberg FDR with alpha = 0.05). Example syllables illustrated in c are indicated as c1, c2 and c3. See Methods for number of mice per treatment group. b. Usage plots for wild-type (black) and Cntnap2 −/− mice injected with risperidone (RISP; green), loxapine (LOX; blue) and sulpiride (SULP; purple). Symbols indicate differentially used syllables (circle: fully reverted mutant syllable, triangle: partially reverted mutant syllable, cross: not reverted mutant syllable; square: drug-induced side-effect syllable, see Methods for definitions of reversions and side effects). c. Schematic illustrations of syllables that were either not reverted (c1), partially reverted (c2) or fully reverted (c3) by drug treatments. Note that syllable c3 was fully reverted with RISP and SULP, but only partially reverted with LOX.

Comment in

Similar articles

Cited by

References

    1. Tinbergen N The study of instinct. (Clarendon Press, 1951).
    1. Dawkins R in Growing points in ethology. (Cambridge U Press, 1976).
    1. Datta SR, Anderson DJ, Branson K, Perona P & Leifer A Computational Neuroethology: A Call to Action. Neuron 104, 11–24, doi:papers3://publication/doi/10.1016/j.neuron.2019.09.038 (2019). - DOI - PMC - PubMed
    1. Anderson DJ & Perona P Toward a science of computational ethology. Neuron 84, 18–31, doi:10.1016/j.neuron.2014.09.005 (2014). - DOI - PubMed
    1. Mathis A et al. DeepLabCut: markerless pose estimation of user-defined body parts with deep learning. Nature Publishing Group 21, 1281–1289, doi:papers3://publication/doi/10.1038/s41593-018-0209-y (2018). - DOI - PubMed

Methods References

    1. Fukunaga K & Olsen DR An algorithm for finding intrinsic dimensionality of data. IEEE Transactions on Computers 20, 176–183, doi:(null) (1971).
    1. Bishop CM Pattern Recognition and Machine Learning. (Springer, 2006).

Publication types