. 2020 Nov;21(11):1444-1455.
doi: 10.1038/s41590-020-0783-5. Epub 2020 Sep 21.

Lung mesenchymal cells elicit lipid storage in neutrophils that fuel breast cancer lung metastasis

Affiliations

Lung mesenchymal cells elicit lipid storage in neutrophils that fuel breast cancer lung metastasis

Peishan Li et al. Nat Immunol. 2020 Nov.

Abstract

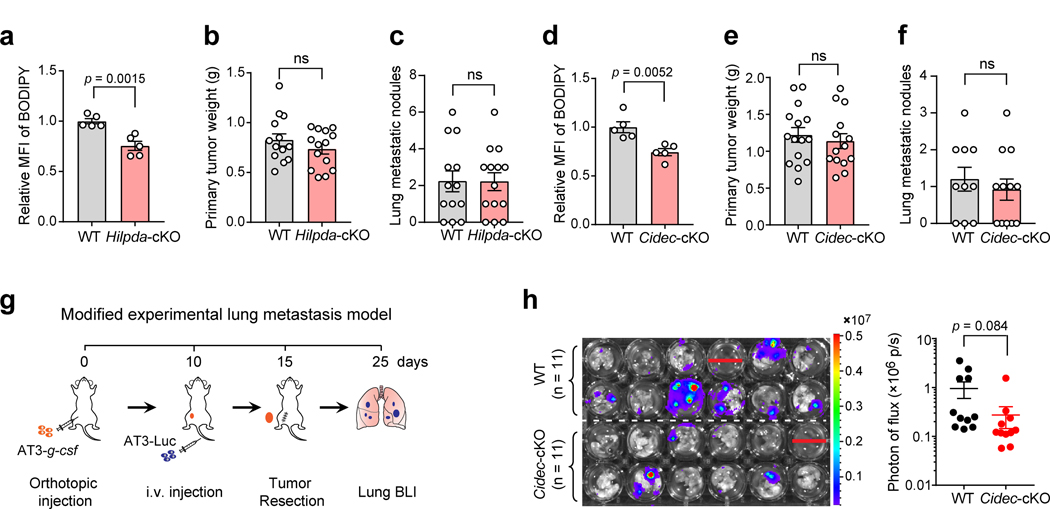
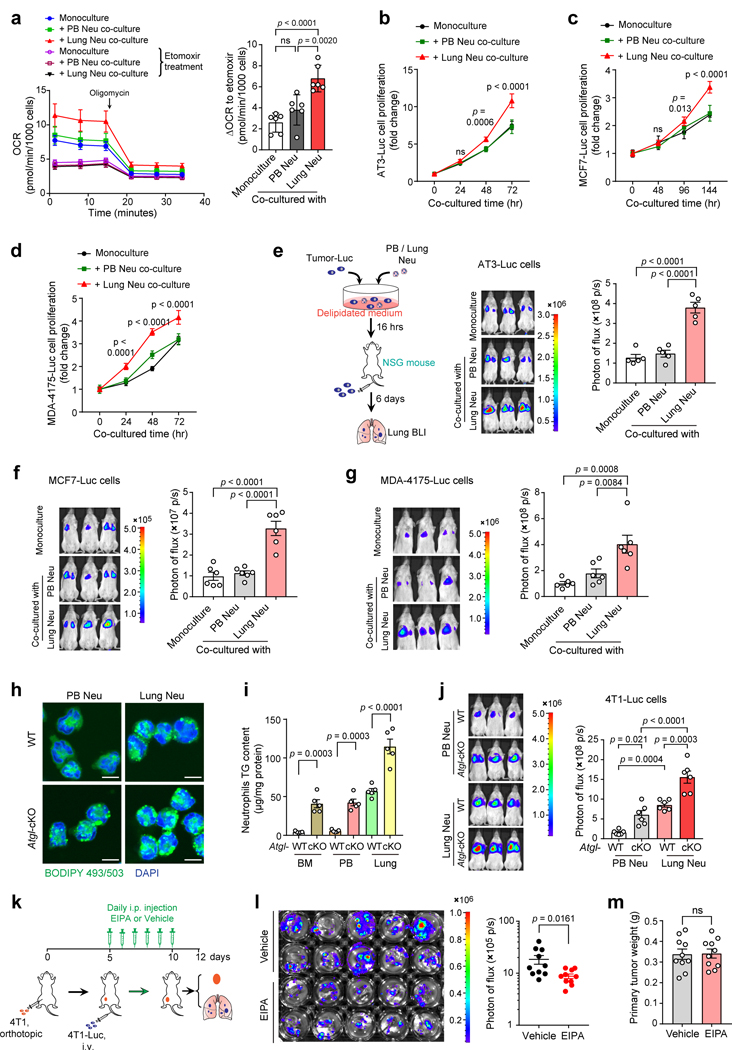
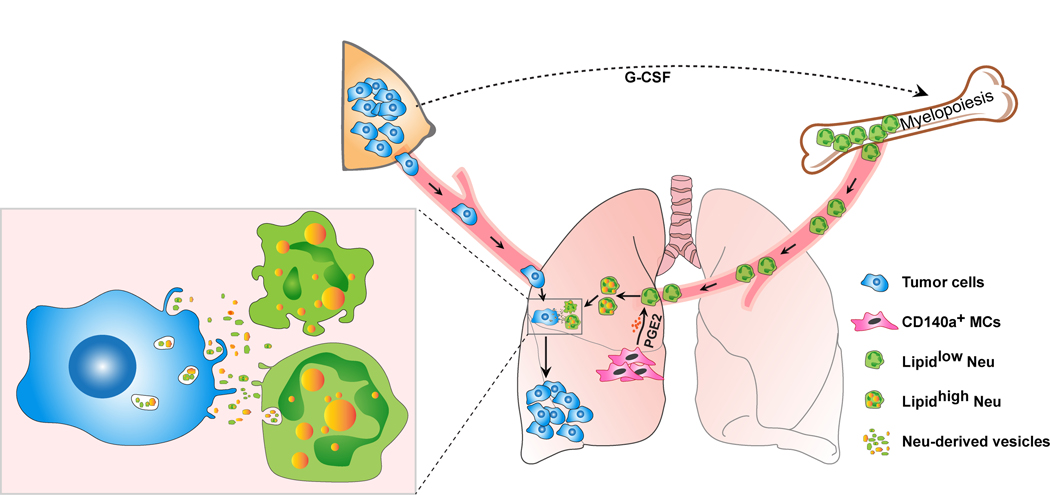
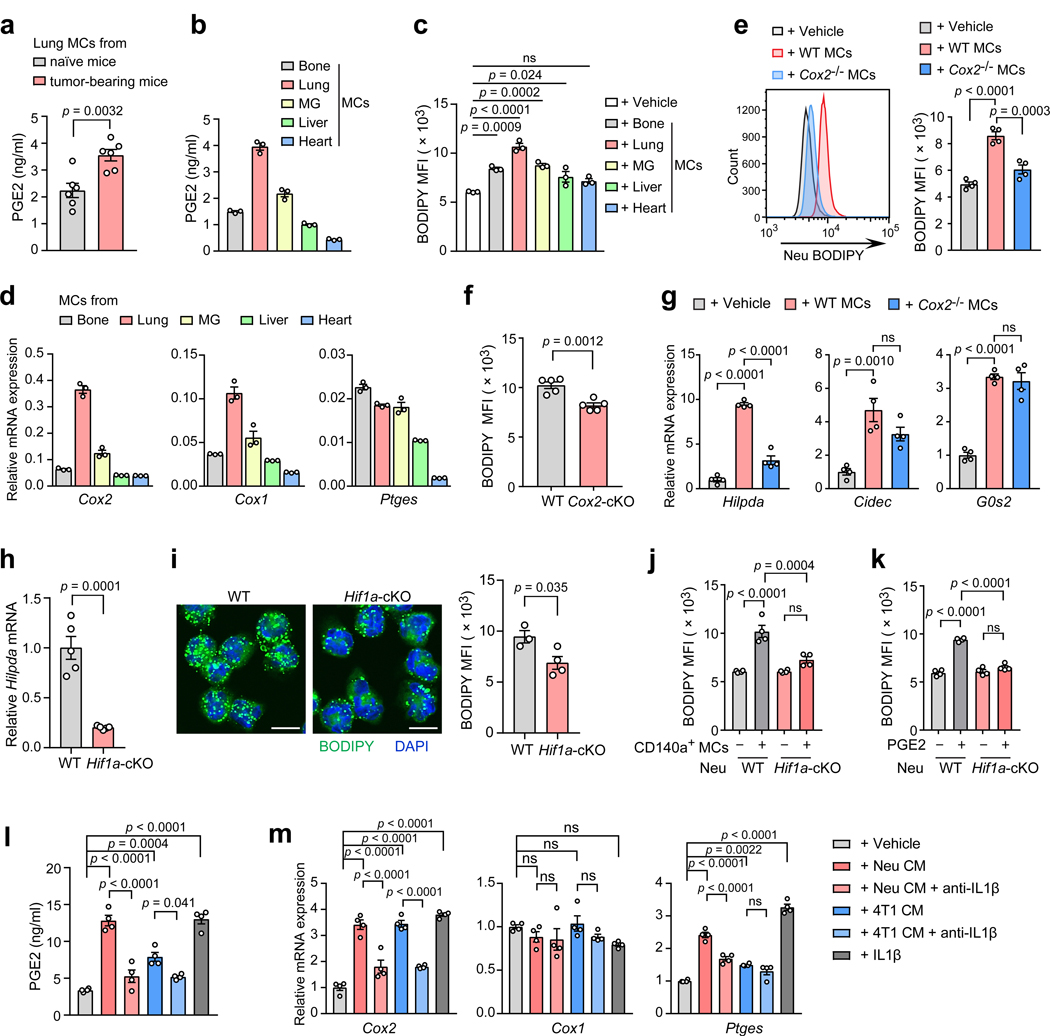
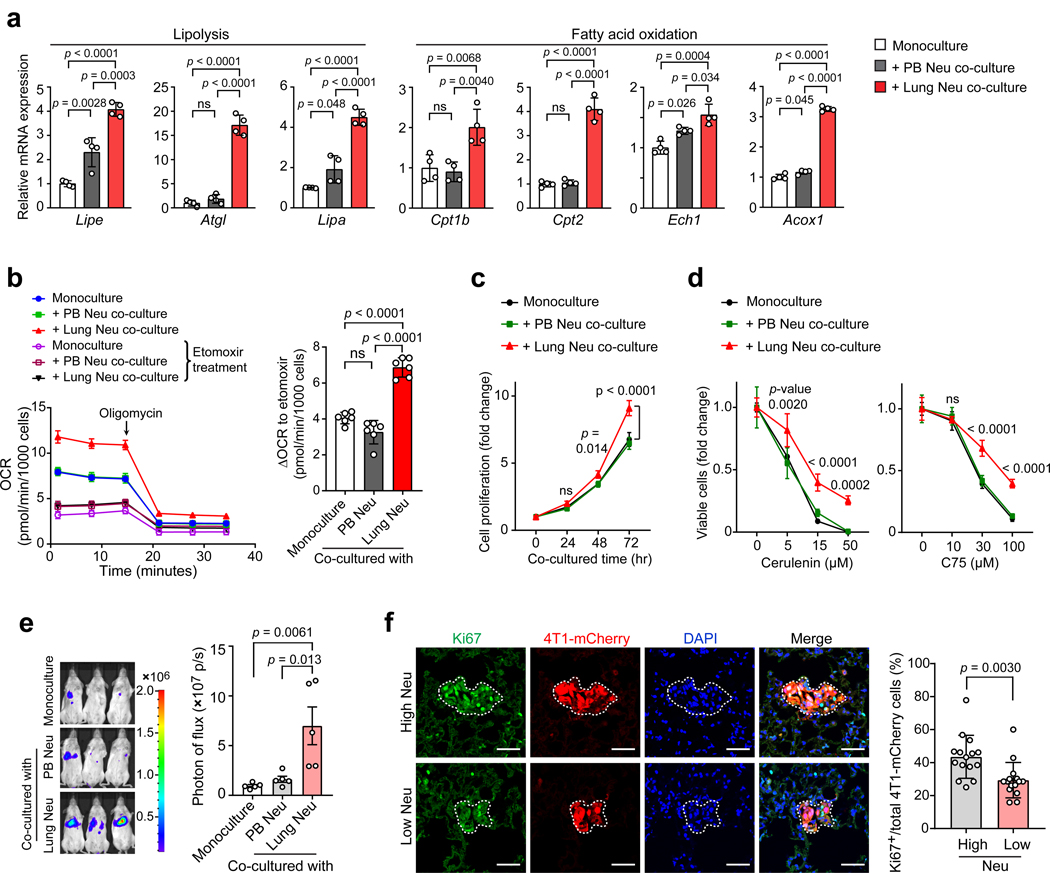
Acquisition of a lipid-laden phenotype by immune cells has been defined in infectious diseases and atherosclerosis but remains largely uncharacterized in cancer. Here, in breast cancer models, we found that neutrophils are induced to accumulate neutral lipids upon interaction with resident mesenchymal cells in the premetastatic lung. Lung mesenchymal cells elicit this process through repressing the adipose triglyceride lipase (ATGL) activity in neutrophils in prostaglandin E2-dependent and -independent manners. In vivo, neutrophil-specific deletion of genes encoding ATGL or ATGL inhibitory factors altered neutrophil lipid profiles and breast tumor lung metastasis in mice. Mechanistically, lipids stored in lung neutrophils are transported to metastatic tumor cells through a macropinocytosis-lysosome pathway, endowing tumor cells with augmented survival and proliferative capacities. Pharmacological inhibition of macropinocytosis significantly reduced metastatic colonization by breast tumor cells in vivo. Collectively, our work reveals that neutrophils serve as an energy reservoir to fuel breast cancer lung metastasis.


Figures

Extended Data Fig. 1
Extended Data Fig. 1. Lung neutrophils acquire a lipid-laden phenotype in the orthotopic 4T1 tumor model
a-d, Transcriptional profiles of BM, PB and lung neutrophils sorted from the orthotopic 4T1 tumor-bearing BALB/cJ mice (n = 3). Volcano plots showing fold-change and p-value for the comparison of lung versus BM neutrophils (a), and PB versus BM neutrophils (b) based on the RNA-seq data. P values were determined by unpaired two-tailed t-test and smaller than 0.05 were considered significant. A schematic diagram showing the major pathway and key factors in lipid metabolism (c). A heat map depicts expression levels of the major lipid metabolic genes (d). e, Upper: a diagram showing the pre-metastatic and metastatic stages in the orthotopic 4T1 tumor model; lower: Representative immunostaining of neutrophils (Ly6G) in lung sections of naïve and 4T1 tumor-bearing BALB/cJ mice (n = 4 from 2 independent experiments). Scale bars, 20 μm. f, Intracellular lipids in neutrophils detected by BODIPY 493/503 staining under microscope (n = 4 mice from 2 independent experiments). Scale bars, 5 μm. g, The flow cytometry gating strategy is shown: neutrophils were identified as the Ly6G+Ly6Clow cell population which was gated on CD45+CD11b+ cells. h, Measurement of total lipid contents in neutrophils isolated from naïve and 4T1 tumor-bearing mice by BODIPY 493/503 staining and flow cytometry (n = 6). i, Cellular TG contents in neutrophils (n = 5). In f and i, neutrophils were isolated from the indicated tissues and organs of orthotopic 4T1 tumor-bearing mice at the pre-metastatic stage. n represents biologically independent animals. Data are mean ± s.e.m. and P values were determined by one-way ANOVA with Tukey’s multiple comparisons test (h and i). ns, not significant.
Extended Data Fig. 2
Extended Data Fig. 2. Up-regulation of genes encoding ATGL inhibitory factors led to reduced TG hydrolysis in pre-metastatic lung-infiltrating neutrophils
a-h, Levels of total triglyceride (TG) (a), cholesteryl ester (CE) (b), phosphatidylethanolamine (PE) (c), phosphatidylcholine (PC) (d), phosphatidylserine (PS) (e), phosphatidylinositol (PI) (f), ceramides (Cer) (g) and phosphatidylglycerol (PG) (h) in PB and lung neutrophils isolated from the pre-metastatic stage of orthotopic 4T1 tumor-bearing mice (n = 5), were determined by liquid chromatography-mass spectrometry. Relative levels of these lipid were also shown in Fig. 1f. The exact values of specific chemical species for each lipid type were provided in Source Data file. i-l, Neutrophils were isolated from the BM, PB and lung tissues of orthotopic 4T1 tumor-bearing mice (n = 5) at the pre-metastatic stage and compared for relative mRNA expression (to Rps18) of Hilpda, Cidec, G0s2, Atgl and Abhd5 by qRT-PCR (i); HILPDA, CIDEC and G0S2 protein expression by Western blotting with GAPDH as a loading control (j); relative TG hydrolase activity (k); and cellular lipase activity (l). n represents biologically independent animals. Data are mean ± s.e.m. and P values were determined by one-way ANOVA with Tukey’s multiple comparisons test (i and l) or unpaired two-tailed t-test (k). ns, not significant.
Extended Data Fig. 3
Extended Data Fig. 3. Neutrophil-specific genetic ablation of Hilpda or Cidec did not lead to significant changes on lung metastases of breast cancer in vivo
a-f, The neutrophil-targeting cKO mice (a-c, Hilpda-cKO; d-f, Cidec-cKO), and their wild type littermates were orthotopically implanted with AT3-g-csf cells. On day 15, the relative lipid levels in lung neutrophils were determined by BODIPY 493/503 staining and flow cytometry (a and d) (n = 5 per group), and the resected primary tumors were weighed (b and e). At the end point (day 30), spontaneous lung metastases of WT and cKO mice were quantified (c and f). n = 13 (WT group) and 14 (Hilpda-cKO group) for b and c; n = 15 (WT group) and 14 (Cidec-cKO group) for e, n = 10 (WT group) and 12 (Cidec-cKO group) for f. g, A schematic diagram showing the modified experimental lung metastasis model employed in this study. Mice were first orthotopically implanted with non-labeled AT3-g-csf cells to induce a neutrophil-high host condition. Luciferase-labeled AT3-Luc cells were then implanted intravenously on day 10, a time point within the pre-metastatic stage. On day 15, the primary tumors were resected. At the end point, the lung metastatic progression of AT3-Luc cells was detected by ex vivo BLI. h, Following the above modified experimental lung metastasis model, the lung metastatic progression of AT3-Luc cells in WT and Cidec-cKO recipient mice was determined by ex vivo BLI. Representative BLI images of the harvested lungs are shown and red lines indicate blank wells without lung tissues (left) (n = 11). n represents biologically independent animals. Data are mean ± s.e.m. and P values were determined by unpaired two-tailed t-test. ns, not significant.
Extended Data Fig. 4
Extended Data Fig. 4. Tumor cells absorb lipids from lipid-laden lung neutrophils
a, Representative images from 2 biologically independent experiments showing lipid transfer from BODIPY FL C16-loaded neutrophils to 4T1-mCherry cells. Arrowheads indicate neutrophils. Scale bars, 20 μm. b, 4T1-mCherry or AT3-mCherry cells were mono-cultured or co-cultured with their respective tumor-bearing mice-derived neutrophils that were pre-loaded with BODIPY FL C16. Then the intensity of BODIPY in tumor cells was examined by flow cytometry. Representative of 3 biologically independent experiments. c, The cellular TG contents of AT3-mCherry cells after mono-culture or co-culture with neutrophils. Data are mean ± s.d. from 3 biologically independent cell cultures. d, Measurement of the lipids in early lung-colonizing AT3-mCherry cells in G-CSF-pretreated mice without and with anti-Ly6G-based neutrophil depletion (see Methods) (n = 5). Data are mean ± s.e.m. e, The lipid transfer from BODIPY FL C16-loaded lung neutrophils to the indicated tumor cells in vivo as determined by flow cytometry (see Methods) (n = 4). Representative flow cytometry histograms are shown. f, As depicted in the left panel, AT3-mCherry or 4T1-mCherry cells were mono-cultured or co-cultured with PB or lung neutrophils. In one experimental group, lung neutrophils were pre-activated by phorbol 12-myristate 13-acetate (PMA) and hydrogen peroxide (H2O2). The total lipid levels in tumor cells were determined by BODIPY 493/503 staining and flow cytometry. Data are mean ± s.d. from 5 (4T1-mCherry) or 3 (AT3-mCherry) biologically independent cell cultures. Neutrophils used throughout this figure were isolated from the pre-metastatic stage of 4T1 tumor-bearing mice or AT3-g-csf tumor-bearing mice. n represents biologically independent animals. P values were determined by one-way ANOVA with Tukey’s multiple comparisons test. ns, not significant.
Extended Data Fig. 5
Extended Data Fig. 5. Neutrophil-derived lipids enhance the proliferative capacity of metastatic tumor cells
a, Oxygen consumption rates (OCR) of AT3 cells, upon mono-culture or co-culture with PB or lung neutrophils (left). The amount of OCR derived from fatty acid oxidation was quantified as the magnitude of the response to etomoxir (right). b-d, Measurement of the proliferative capacities of the indicated tumor cells without and with co-culture with PB or lung neutrophils (see Methods). e-g, Comparison of the metastatic colonization potentials of the indicated tumor cells (e, AT3-Luc; f, MCF7-Luc; and g, MDA-4175-Luc) without and with co-culture with PB or lung neutrophils (see Methods). Representative BLI images of the recipient mice and quantification of BLI signals within the lung areas are shown (n = 5 for e and n = 6 for f, g). h, i, PB and lung neutrophils were isolated from AT3-g-csf tumor-bearing WT or Atgl-cKO mice (pre-metastatic stage). The intracellular lipids in neutrophils were detected by BODIPY 493/503 staining under microscope (representative of n = 5 mice). Scale bars, 5 μm (h). The cellular TG contents of neutrophils were measured (n = 5) (i). j, 4T1-Luc cells, upon co-culture with PB or lung neutrophils isolated from AT3-g-csf tumor-bearing WT or Atgl-cKO mice (pre-metastatic stage), were intravenously injected into NSG mice (see Methods). Representative BLI images of the recipient mice and quantification of BLI signals within the lung areas are shown (n = 6). k-m, As depicted in k, the effects of EIPA treatment on lung colonization by 4T1 tumor cells (l) and on primary tumor growth (m) were determined (see Methods) (n = 10). Neutrophils throughout this figure were isolated from the pre-metastatic stage of 4T1 tumor-bearing mice (c, d, f and g) or AT3-g-csf tumor-bearing mice (a, b and e), except otherwise stated. n represents biologically independent animals. Data are mean ± s.d. from 6 (a) or 4 (b-d) biologically independent cell cultures, and mean ± s.e.m. for e-g, i, j, l and m. P values were determined by two-way ANOVA with Sidak’s multiple comparisons test (b-d, mono-culture versus lung Neu co-culture), one-way ANOVA with Tukey’s multiple comparisons test (a, e-g, i and j) or unpaired two-tailed t-test (l and m). ns, not significant.
Extended Data Fig. 6
Extended Data Fig. 6. Both lipid- and neutrophil-associated gene expression signatures are related with lung metastasis in human breast cancer patients
Kaplan–Meier plots of lung metastasis-free survival of breast cancer patients, stratified by expression of indicated gene signature sets in their primary tumors (GEO accession number: GSE2603, n = 82 patients). A risk score was calculated for each sample which was defined as a linear combination of expression values of genes in one signature set weighted by their estimated Cox model regression coefficients. If the risk score for one sample was in the top 20th percentile of the risk scores, then it was classified into high-risk group, otherwise into low-risk group. P values were calculated by a 2-sided log-rank test. The used gene signature sets are derived from Gene Ontology (GO): Biological Process of MsigDB v.7.1, including GO_POSITIVE_REGULATION_OF_LIPID_CATABOLIC_PROCESS (M14107, 25 genes); GO_POSITIVE_REGULATION_OF_LIPID_TRANSPORT (M11731, 61 genes); GO_LIPID_OXIDATION (M15880, 101 genes); GO_NEUTROPHIL_MIGRATION (M25402, 119 genes); GO_REGULATION_OF_NEUTROPHIL_CHEMOTAXIS (M19283, 30 genes); and GO_NEUTROPHIL_EXTRAVASATION (M24616, 13 genes).
Extended Data Fig. 7
Extended Data Fig. 7. A lung MC → neutrophil → tumor cell metabolic axis in the lung metastatic niche
A schematic diagram depicts how lung neutrophils are stimulated by lung resident MCs to accumulate lipids, and in turn transport their stored lipids to metastatic tumor cells for survival and proliferation leading to accelerated lung metastasis in a breast cancer model.
Fig. 1
Fig. 1. Neutrophils acquire a lipid-laden phenotype in the pre-metastatic lung
a, Volcano plots showing fold-change and p-value for the comparison of lung neutrophils versus PB neutrophils based on the RNA-seq data from the 4T1 orthotopic model (n = 3). b, Intracellular lipids in neutrophils detected under confocal microscopy (upper; scale bars, 5 μm) or transmission electron microscopy (lower; scale bars, 0.5 μm). Arrowheads indicate lipid droplets (LDs) (representative of n = 3 mice). c, Immunostaining of lung section of MMTV-PyMT mice showing in situ LDs (BODIPY) in neutrophils (Ly6G). Scale bars, 5 μm. (representative of n = 3 mice). d, Lipid quantification in neutrophils by flow cytometry (n = 6). e, Cellular triglyceride (TG) contents in neutrophils (n=5). f, Relative levels of the indicated types of lipids in PB and lung neutrophils measured by mass spectrometry (n = 5). See Extended Data Fig. 2a–h. g, A diagram showing ATGL and its regulatory factors in TG hydrolysis. h, Relative mRNA expression (as compared to the control gene Rps18, encoding ribosomal protein S18) of the indicated genes in neutrophils determined by qRT-PCR (n = 5). i, The indicated protein expression in neutrophils detected by Western blotting with GAPDH as a loading control (n = 3). j, Correlation between expression of human LD-associated genes and that of neutrophil signature genes in human breast cancer lung metastasis samples (GSE14018, n = 16), analyzed by linear regression with Pearson’s correlation (See Methods). k, Relative TG hydrolase activity in neutrophils (n = 6 and 5 for PB and lung, respectively). l, Cellular lipase activity in neutrophils (n = 5). In b, d, e, h, i, k and l, neutrophils (Neu) were isolated from the indicated tissues from tumor-bearing MMTV-PyMT mice at the pre-metastatic stage. n represents biologically independent animals except j for independent human patients. Data are mean ± s.e.m. and P values in animal experiments were determined by one-way ANOVA with Tukey’s multiple comparisons test except a and k by unpaired two-tailed t-test. ns, not significant.
Fig. 2
Fig. 2. Lung CD140a+ mesenchymal cells (MCs) drive lipid accumulation in neutrophils
a, Comparison of the lipid levels in the implanted neutrophils in the indicated organs or tissues of recipient naïve or 4T1 tumor-bearing mice (see Methods, n = 6). b, BM neutrophils (Neu) were mono-cultured or co-cultured with the indicated stromal cells sorted from naïve BALB/cJ mouse lungs. Lipid levels of neutrophils were quantitated by flow cytometry 16 hours later. c, Immunostaining of lung section showing the localization of MCs and neutrophils in AT3-g-csf orthotopic tumor-bearing CD140a-GFP mice (pre-metastatic stage) (representative of n = 4 mice). Receptor for advanced glycation end products (RAGE) was also stained to indicate the lung epithelium. Scale bar, 20 μm. d, Relative mRNA expression of the indicated genes in BM neutrophils after their mono-culture or co-culture with CD140a+ lung MCs or lung MC-conditioned medium. e, An upstream regulator (soluble proteins or chemicals) prediction was performed using the ingenuity pathway analysis based on the differentially expressed genes between lung and BM neutrophils, using the RNA-seq data as in Extended Data Fig. 1a. f, The lipid levels of BM neutrophils stimulated with the indicated candidate regulators, as measured by flow cytometry (see Methods). g, Relative mRNA expression of the indicated genes in BM neutrophils stimulated with PGE2 (10 ng ml−1). h, The lipid levels of BM neutrophils co-cultured with CD140a+ MCs in the presence and absence of the PGE2 receptor (EP) antagonists were quantitated by flow cytometry (see Methods). i, Measurement of the lung neutrophil lipid levels in 4T1 tumor-bearing mice without and with administration with the EP2 antagonist (PF-04418948, 10 mg kg−1) (n = 6). The BM neutrophils used in b, d and f-h were isolated from the 4T1 tumor-bearing BALB/cJ mice (n = 4 except g with n = 3). n represents biologically independent animals. Data are mean ± s.e.m. and P values were determined by one-way ANOVA with Tukey’s multiple comparisons test except g and i by unpaired two-tailed t-test. ns, not significant.
Fig. 3
Fig. 3. A critical role of the PGE2-HIF1α-HILPDA axis in lung MC-triggered lipid storage in neutrophils.
a, The PGE2 levels in lung MCs (105 cells per ml in 24 hours) from naïve and AT3-g-csf tumor bearing CD140a-GFP mice (n = 6). b-d, The CD140a+ MCs were freshly isolated from the indicated tissues of naïve CD140a-GFP mice (n = 3). Their PGE2 secretion (b), abilities to stimulate lipid accumulation in BM neutrophils (c), and relative mRNA expression (to Rps18) of the indicated genes (d) were assessed. MG, mammary gland. e-g, Lung MC-specific COX2 in eliciting the lipid-laden neutrophil phenotype. In vitro, BM neutrophils were mono-cultured or co-cultured with lung MCs isolated from WT or Cox2-cKO (CD140a-Cre; Cox2flox/flox) mice. Then the lipid levels (e) and relative mRNA expression of the indicated genes (g) in neutrophils were determined. The BM neutrophils were isolated from the AT3-g-csf tumor-bearing mice (n = 4). In vivo, the lipid levels in lung neutrophils isolated from the AT3-g-csf tumor-bearing WT and Cox2-cKO mice (n = 5) were compared (f). h, Relative mRNA levels of Hilpda in lung neutrophils isolated from AT3-g-csf tumor-bearing WT and Hif1a-cKO (S100a8-Cre; Hif1aflox/flox) mice (n = 5). i, Lipid levels in lung neutrophils from AT3-g-csf-bearing WT (n = 3) and Hif1a-cKO (n = 4) mice, were detected by confocal microscopy (left; scale bars, 5 μm) or flow cytometry (right). j, k, BM neutrophils isolated from AT3-g-csf tumor-bearing WT or Hif1α-cKO mice (n = 4) were mono-cultured or co-cultured with lung MCs (j), or stimulated with exogenous PGE2 (10 ng ml−1) (k). Then the lipid levels in neutrophils were determined. l, m, Lung MCs were cultured with the indicated conditioned medium (CM) or IL-1β (20 ng ml−1), with and without anti-IL1β (1 μg ml−1). The PGE2 levels (l) and the relative mRNA expression of the indicated genes (m) were measured. The lung MCs were isolated from naïve CD140a-GFP mice (n = 4). n represents biologically independent animals. Data are mean ± s.e.m. and P values were determined by one-way ANOVA with Tukey’s multiple comparisons test except a, f, h, and i by unpaired two-tailed t-test. ns, not significant.
Fig. 4
Fig. 4. Genetic ablation of Atgl in host neutrophils leads to more aggressive lung metastasis of breast cancer
a, Left: Representative images showing LDs in lung neutrophils from AT3-g-csf-bearing WT and Atgl-cKO mice. Scale bars, 5 μm. Right: Lipid levels of neutrophils from above mice (n = 6) were quantitated by flow cytometry. b, c, WT (n = 15) and Atgl-cKO mice (n = 16) were orthotopically implanted with AT3-g-csf cells. The primary tumors were resected and weighed on day 15 (n = 10) (b). At the end point (day 30), spontaneous lung metastases were assessed. Representative histological images of the lung sections stained with H&E are shown, and arrowheads indicate metastatic lesions (c, left). Scale bars, 1 mm. The number of metastatic nodules on the lungs were counted (c, right). d-f, Following the modified experimental lung metastasis model (see Extended Data Fig. 3g and Methods), the lung metastatic progression of AT3-Luc cells in Atgl-cKO recipient mice (d) and Hilpda-cKO recipient mice (e), as well as E0771-Luc cells in Atgl-cKO recipient mice (f) was determined by ex vivo bioluminescence imaging (BLI), with their WT littermates as controls. Representative BLI images of the harvested lungs are shown (d-f, left). n = 11 (WT) and 10 (Atgl-cKO) for d, n = 13 (WT) and 14 (Hilpda-cKO) for e, and n =10 per group for f. g, Comparison of the spontaneous lung metastases developed in MMTV-PyMT; Atgl-cKO mice (n = 8) and their WT littermates (MMTV-PyMT mice) (n = 9). Representative histological lung sections stained with H&E are shown, and arrowheads indicate metastatic nodules. Scale bars, 1 mm. n represents biologically independent animals. Data are mean ± s.e.m. and P values were determined by unpaired two-tailed t-test; ns, not significant.
Fig. 5
Fig. 5. Lung-infiltrating neutrophils transfer their stored lipid to metastatic tumor cells
a, Adjacent localization of early seeded 4T1-mCherry cells and neutrophils (Ly6G) in the lung (see Methods). Scale bars, 20 μm (representative of n = 3 mice). b, The cellular TG contents of 4T1-mCherry cells after mono-culture or co-culture with PB or lung neutrophils (see Methods). c, Measurement of the lipids in early lung-colonizing 4T1-mCherry cells in G-CSF-pretreated mice without and with anti-Ly6G-based neutrophil depletion (see Methods) (n = 5). d, The lipid transfer from BODIPY-loaded lung neutrophils to tumor cells in vivo as determined by flow cytometry (see Methods) (n = 4). e, 4T1 cells were fed with the un-separated conditioned media (CM), small-sized (<100 kDa) or large-sized (>100 kDa) CM portion prepared from BODIPY-loaded lung neutrophils. Then lipids incorporated into the tumor cells were detected 4 hours later. Scale bars, 20 μm. f, Protein and TG levels in the large-sized lung or PB-derived neutrophil CM portions (n = 6). g, Localization of the absorbed lipids from BODIPY-loaded lung neutrophils with lysosomes (Lysotracker) in 4T1 tumor cells. Scale bars, 5 μm. h, The effects of EIPA, genistein and chlorpromazine in blockage of lipid transport from lipid-laden lung neutrophils to tumor cells (see Methods). Scale bars, 20 μm. i, The impact of EIPA on the capacity of 4T1 cells to acquire lipids from lung neutrophils. j, 4T1 cells were co-cultured with lung neutrophil-derived vesicles and imaged by transmission electron microscopy (see Methods). Red arrowheads indicate the engulfment of the lipid-like vesicles, and yellow arrowheads indicate macropinosome-like structures. Scale bars, 0.5 μm. The lung and PB neutrophils throughout this figure were isolated from the pre-metastatic stage of 4T1 tumor-bearing mice. n represents biologically independent animals. Data are mean ± s.e.m. for c and f, and mean ± s.d. from 3 (b) or 4 (i) biologically independent cell cultures. For e, g, h and j, data are representative of 3 biologically independent experiments. P values were determined by one-way ANOVA with Tukey’s multiple comparisons test (b, c and i) or unpaired two-tailed t-test (f). ns, not significant.
Fig. 6
Fig. 6. Neutrophil-derived lipids enhance the proliferative capacity of metastatic tumor cells
a, Relative mRNA expression of the indicated genes in 4T1 cells upon a mono-culture or co-culture with PB or lung neutrophils. b, Oxygen consumption rates (OCR) of 4T1 cells, upon a mono-culture or co-culture with PB or lung neutrophils, were measured by Seahorse XFe96 Analyzer (left). The amount of OCR derived from fatty acid oxidation was quantified as the magnitude of the response to etomoxir treatment (right). c, Measurement of the proliferative capacities of 4T1-Luc cells without and with co-culture with PB or lung neutrophils (see Methods). d, Comparison of the pro-survival abilities of 4T1-Luc cells without and with co-culture with PB or lung neutrophils, when de novo lipogenesis was inhibited by cerulenin or C75 (see Methods). e, Comparison of the metastatic colonization potentials of 4T1-Luc cells without and without co-culture with PB or lung neutrophils (see Methods). Representative BLI images of the recipient mice and quantification of BLI signals within the lung areas are shown (n = 5). f, Detection of Ki67+ lung-colonizing 4T1-mCherry cells in control (high Neu) and neutrophil-depleted (Low Neu) 4T1-bearing mice (see Methods). Left: Representative microscopy images; Scale bars, 50 μm. Right: the percentages of Ki67+ cells in total mCherry+ 4T1 cells. Five pictures were chosen from each mouse lung section. n = 3 mice per group. Data are mean ± s.d. Neutrophils throughout this figure were isolated from the pre-metastatic stage of 4T1 tumor-bearing mice. Data are mean ± s.e.m. for e, and mean ± s.d. from 4 (a, c and d) or 6 (b) biologically independent cell cultures. P values were determined by one-way ANOVA with Tukey’s multiple comparisons test (a, b and e), two-way ANOVA with Sidak’s multiple comparisons test (c and d, mono-culture versus lung Neu co-culture) or unpaired two-tailed t-test (f). ns, not significant.
Fig. 7
Fig. 7. Blockage of macropinocytosis inhibits metastatic colonization in vivo
a, Transmission electron microscopy images of neutrophils from AT3-g-csf tumor-bearing WT and Atgl-cKO mice (representative of n = 4 mice). Arrowheads indicate lipid droplets. Scale bars, 0.5 μm. b, AT3-Luc cells, upon co-culture with PB or lung neutrophils isolated from AT3-g-csf tumor-bearing WT or Atgl-cKO mice, were intravenously injected into NSG mice (see Methods). Representative BLI images of the recipient mice and quantification of BLI signals within the lung areas are shown (n = 6). c, The impacts of host neutrophil changes in quantity and in their lipid-laden phenotype on the proliferation of lung-colonizing tumor cells, as measured by BrdU incorporation (see Methods) (n = 5). d-e, The effects of EIPA treatment on lung colonization by AT3 tumor cells (d) and on primary tumor growth (e) were determined following the experimental design as in Extended Data Fig. 5k (also see Methods). n = 9 (vehicle group) or 10 (EIPA treatment group). n represents biologically independent animals. Data are mean ± s.e.m. and P values were determined by one-way ANOVA with Tukey’s multiple comparisons test (b and c) or by unpaired two-tailed t-test (d and e). ns, not significant.

References

    1. Liu Y, Cao X. Characteristics and Significance of the Pre-metastatic Niche. Cancer cell 2016, 30(5): 668–681. - PubMed
    1. Peinado H, Zhang H, Matei IR, Costa-Silva B, Hoshino A, Rodrigues G, et al. Pre-metastatic niches: organ-specific homes for metastases. Nature reviews Cancer 2017, 17(5): 302–317. - PubMed
    1. Wculek SK, Malanchi I. Neutrophils support lung colonization of metastasis-initiating breast cancer cells. Nature 2015, 528(7582): 413–417. - PMC - PubMed
    1. Coffelt SB, Kersten K, Doornebal CW, Weiden J, Vrijland K, Hau CS, et al. IL-17-producing gammadelta T cells and neutrophils conspire to promote breast cancer metastasis. Nature 2015, 522(7556): 345–348. - PMC - PubMed
    1. Albrengues J, Shields MA, Ng D, Park CG, Ambrico A, Poindexter ME, et al. Neutrophil extracellular traps produced during inflammation awaken dormant cancer cells in mice. Science 2018, 361(6409). - PMC - PubMed

Methods-only references

    1. Breitkopf SB, Ricoult SJH, Yuan M, Xu Y, Peake DA, Manning BD, et al. A relative quantitative positive/negative ion switching method for untargeted lipidomics via high resolution LC-MS/MS from any biological source. Metabolomics 2017, 13(3). - PMC - PubMed

Publication types