. 2020 Oct;52(10):1067-1075.
doi: 10.1038/s41588-020-0686-2. Epub 2020 Sep 21.

Transcription imparts architecture, function and logic to enhancer units

Affiliations

Transcription imparts architecture, function and logic to enhancer units

Nathaniel D Tippens et al. Nat Genet. 2020 Oct.

Abstract

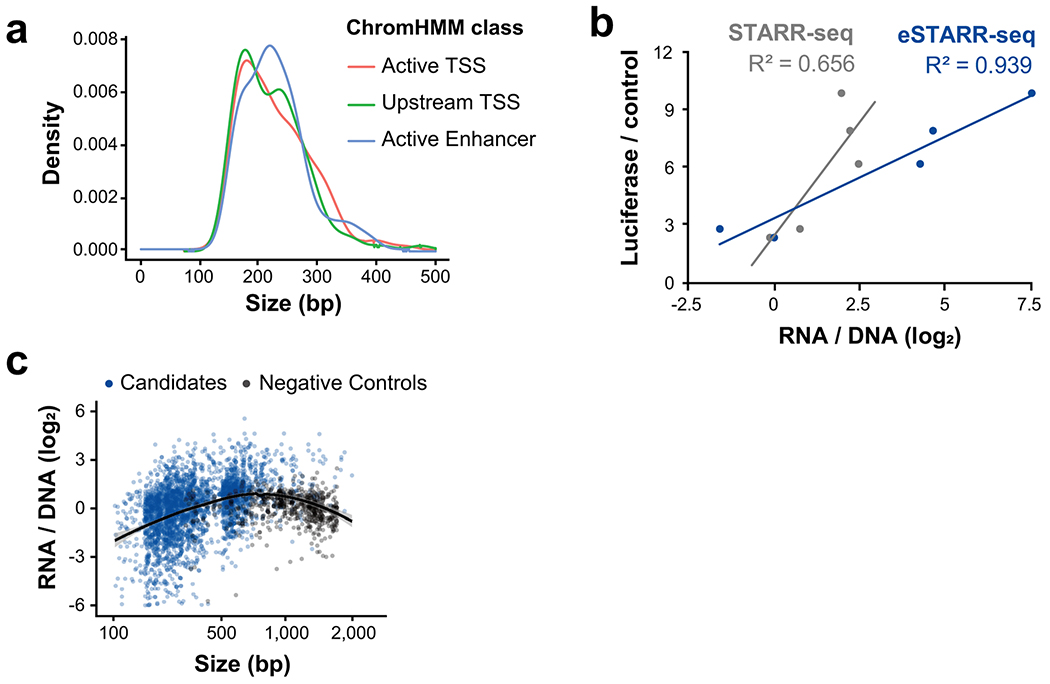
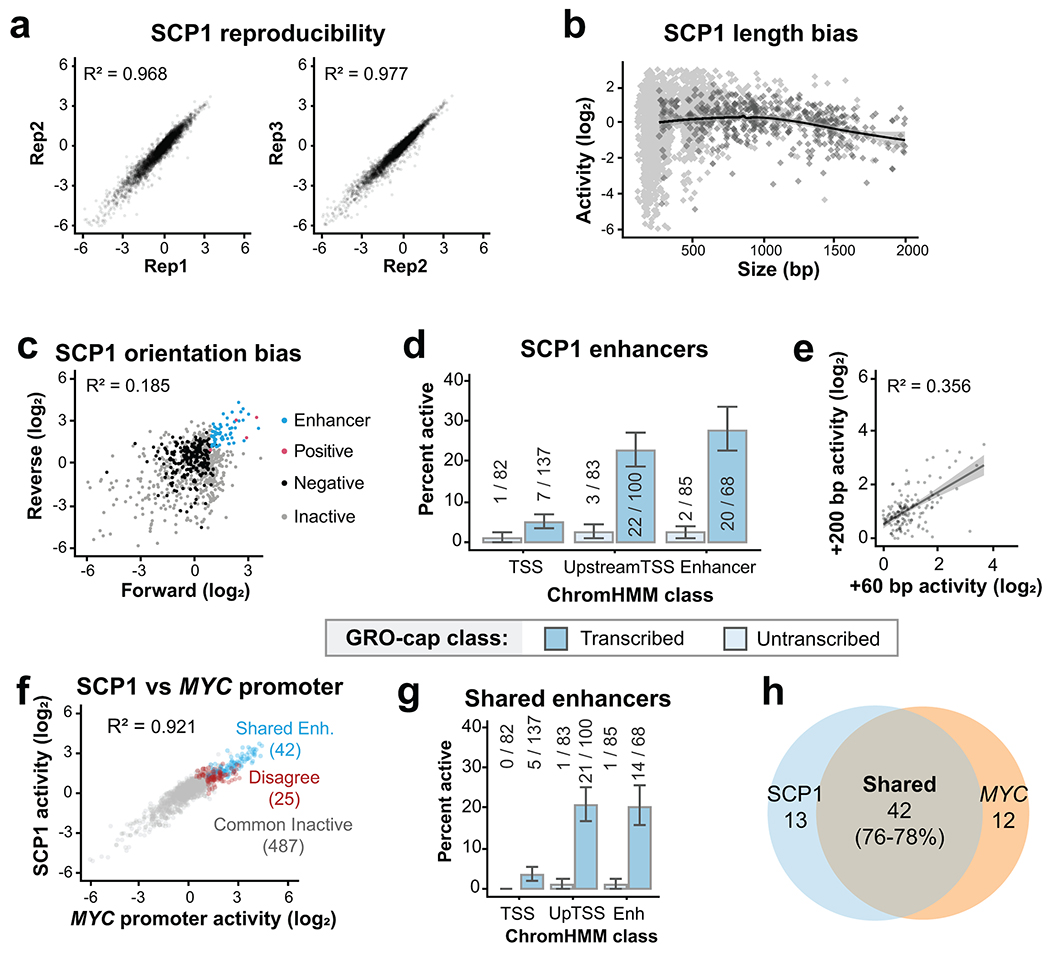
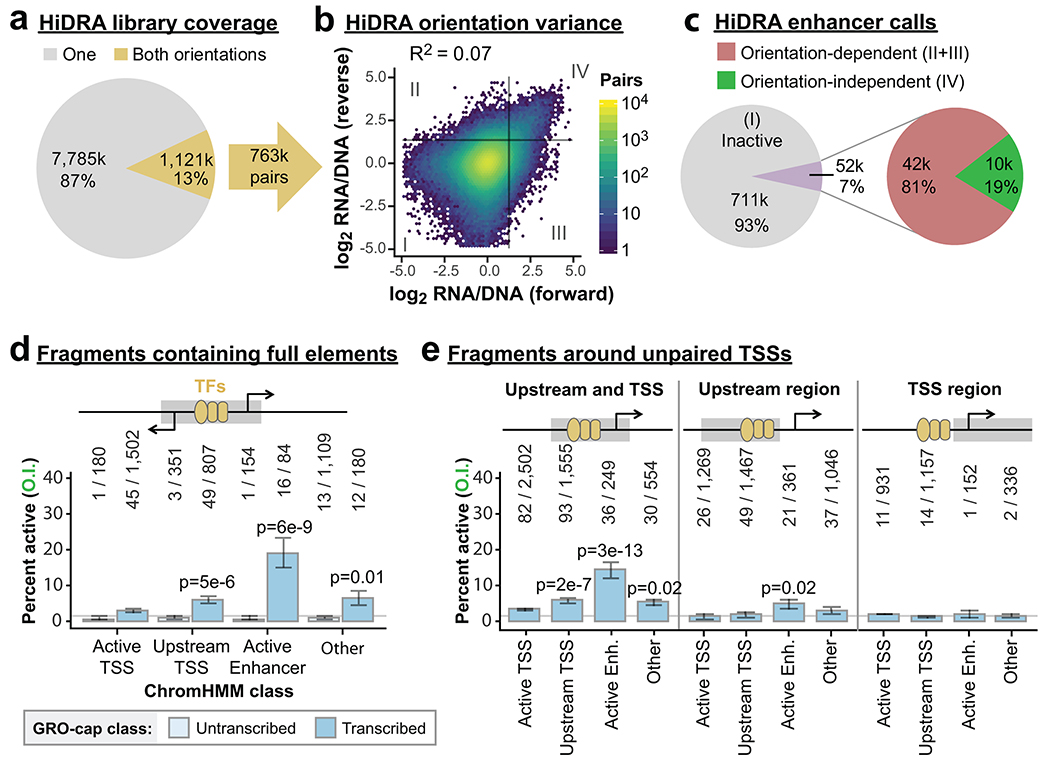
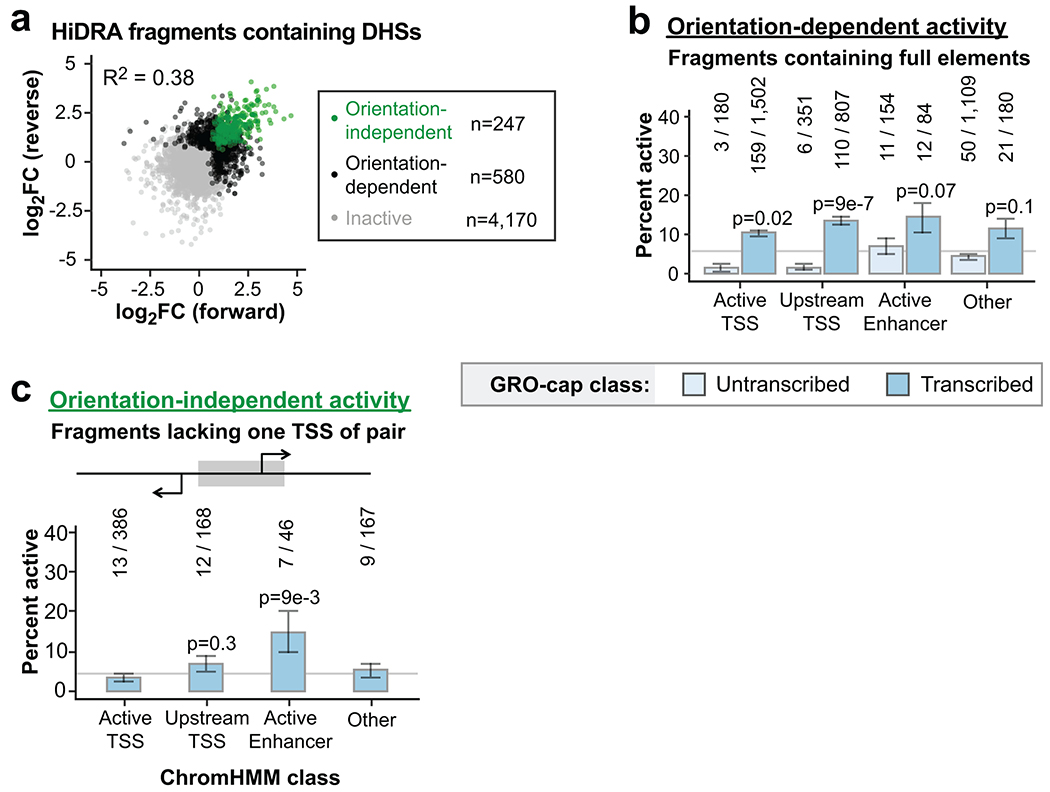
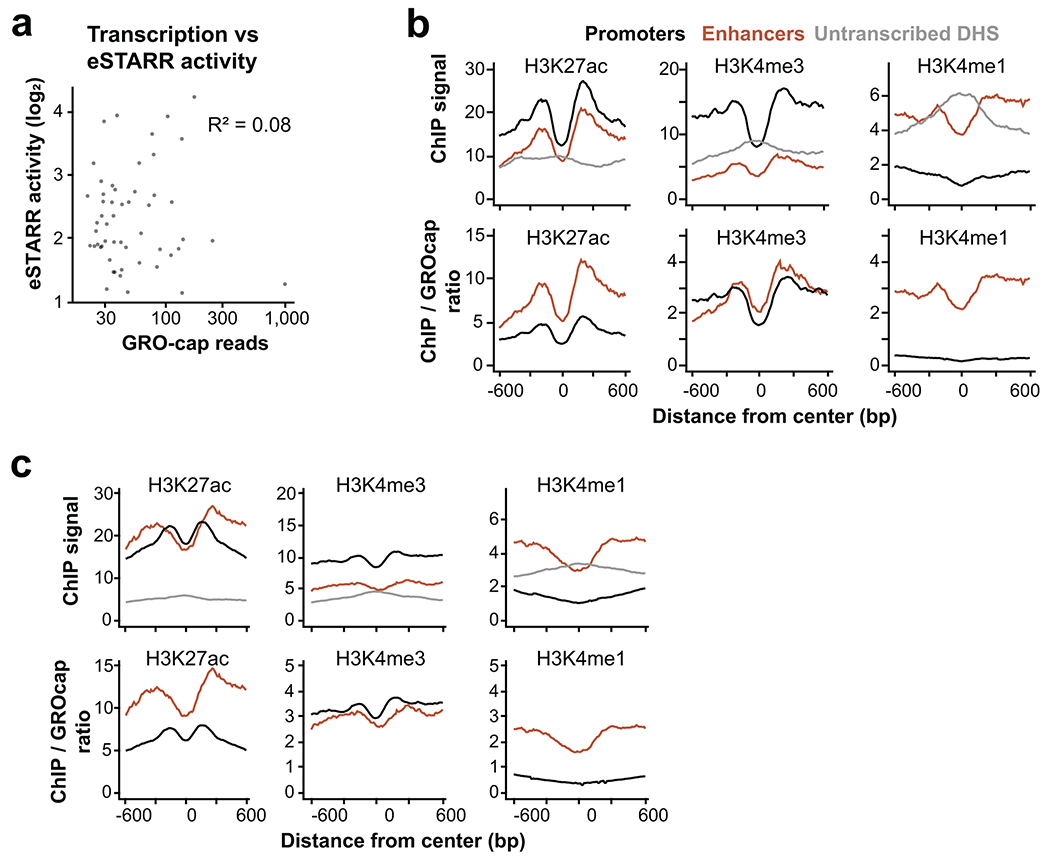
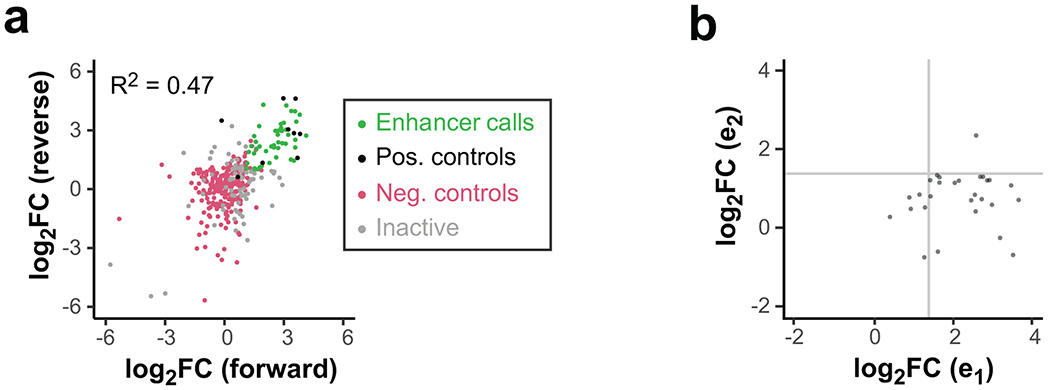
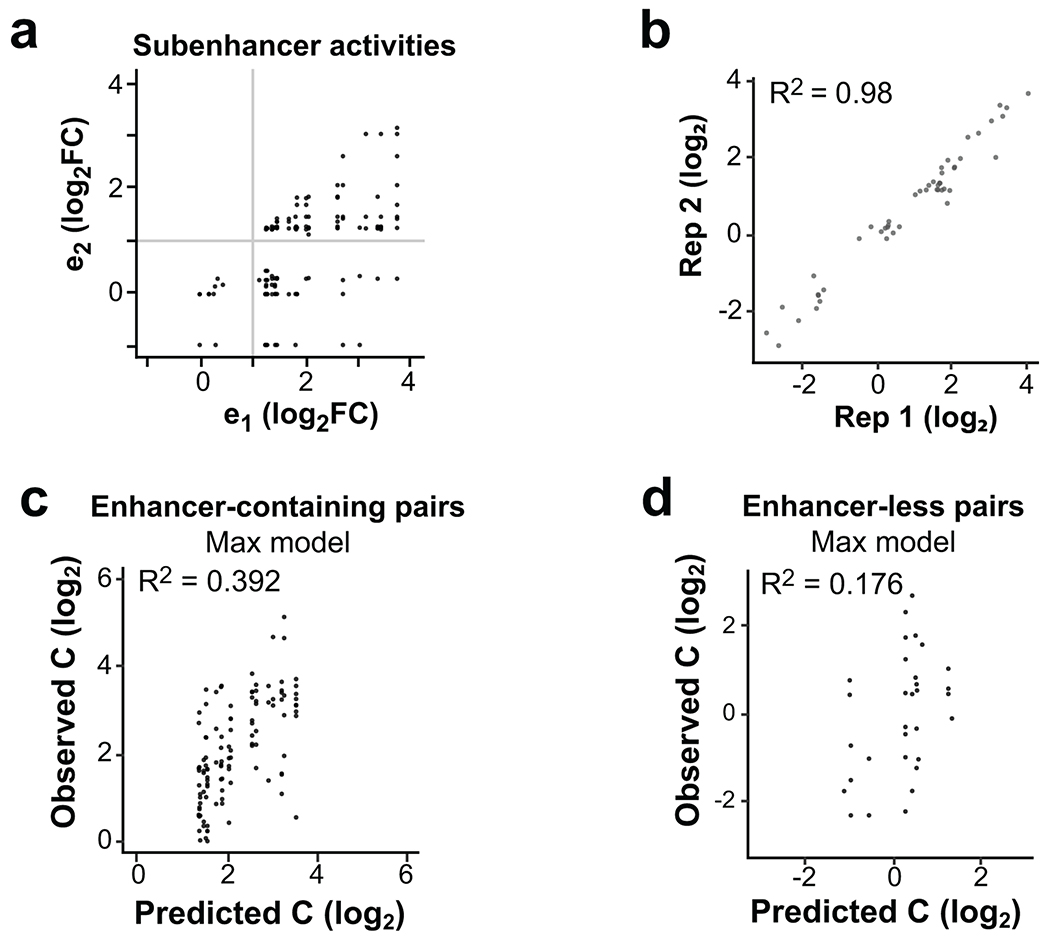
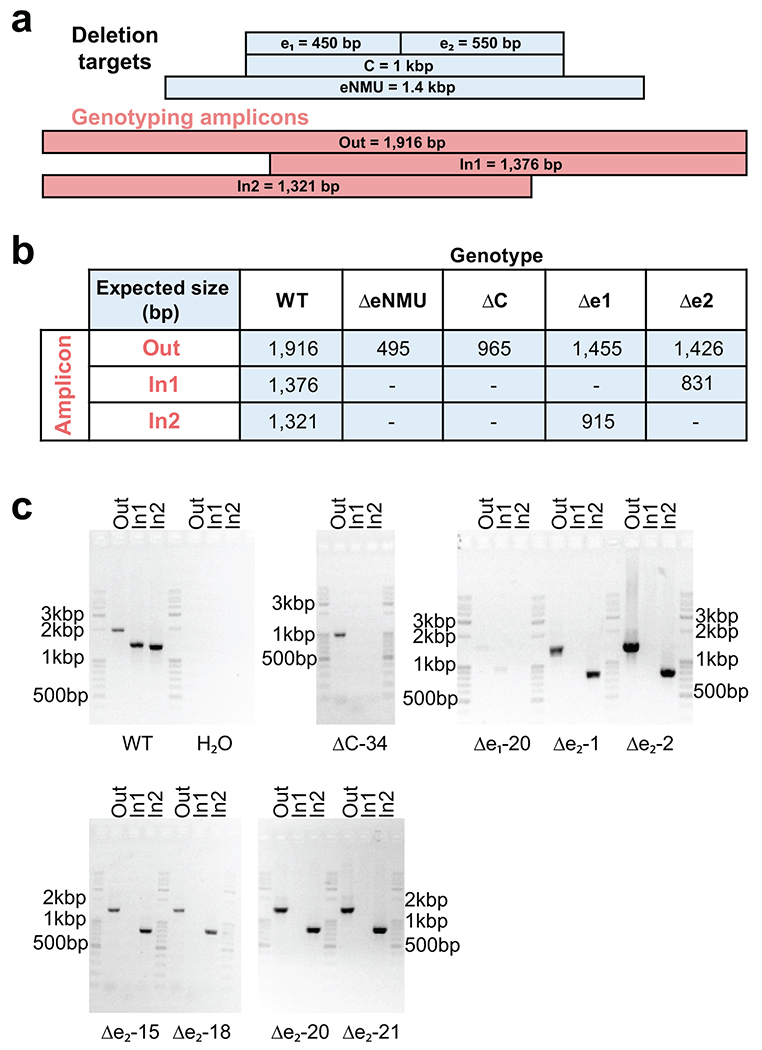
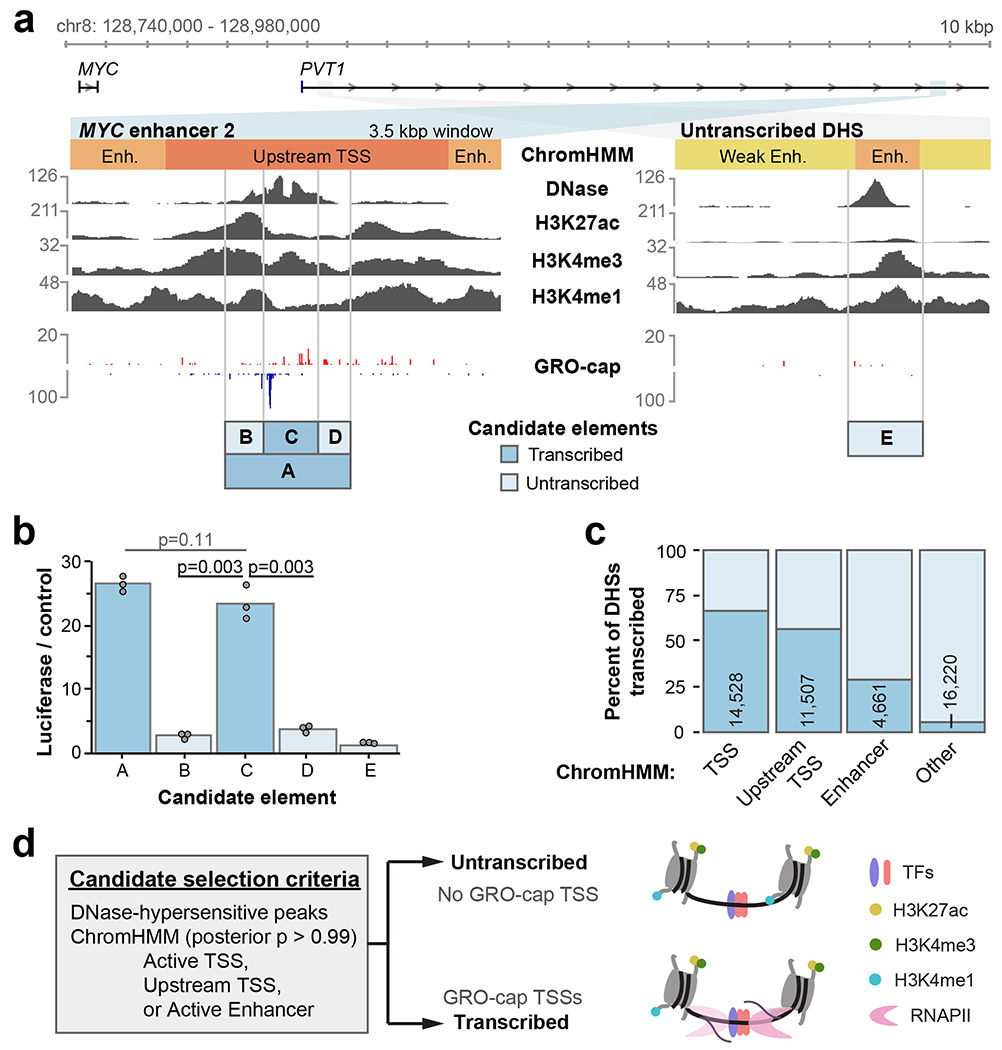
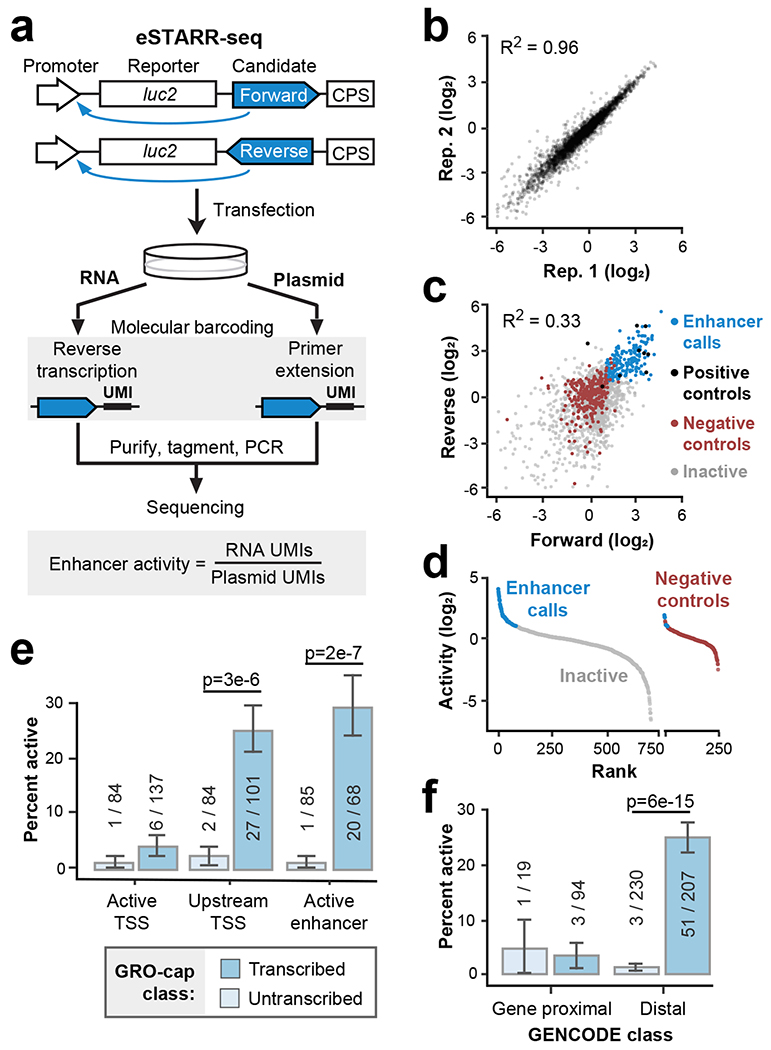
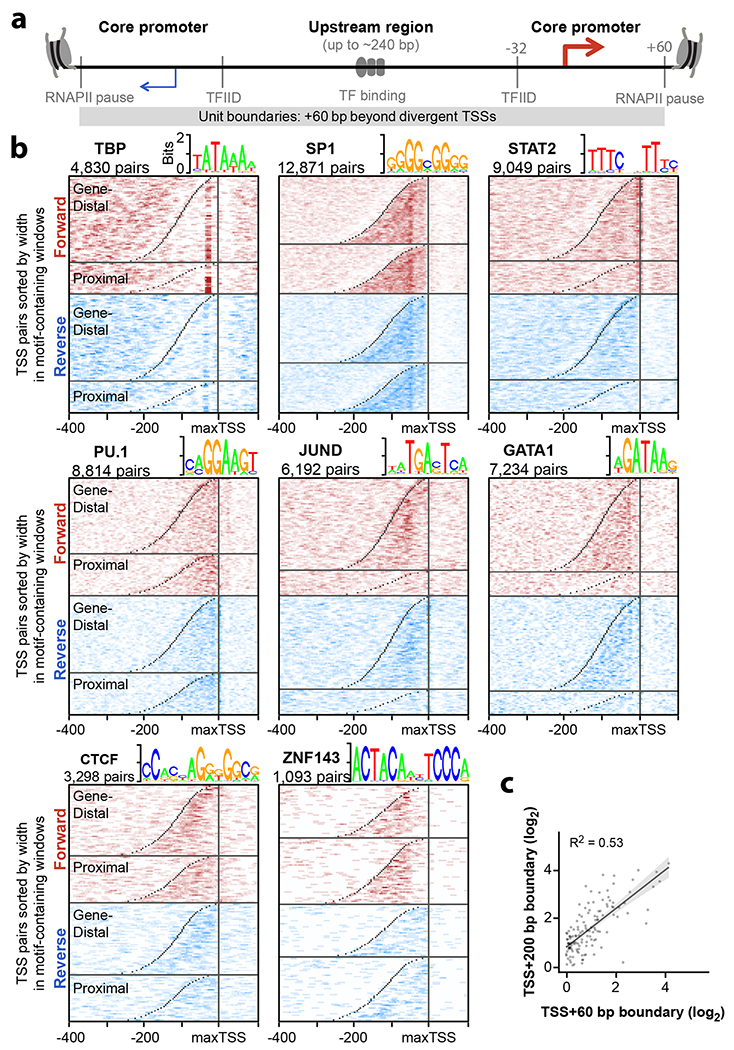
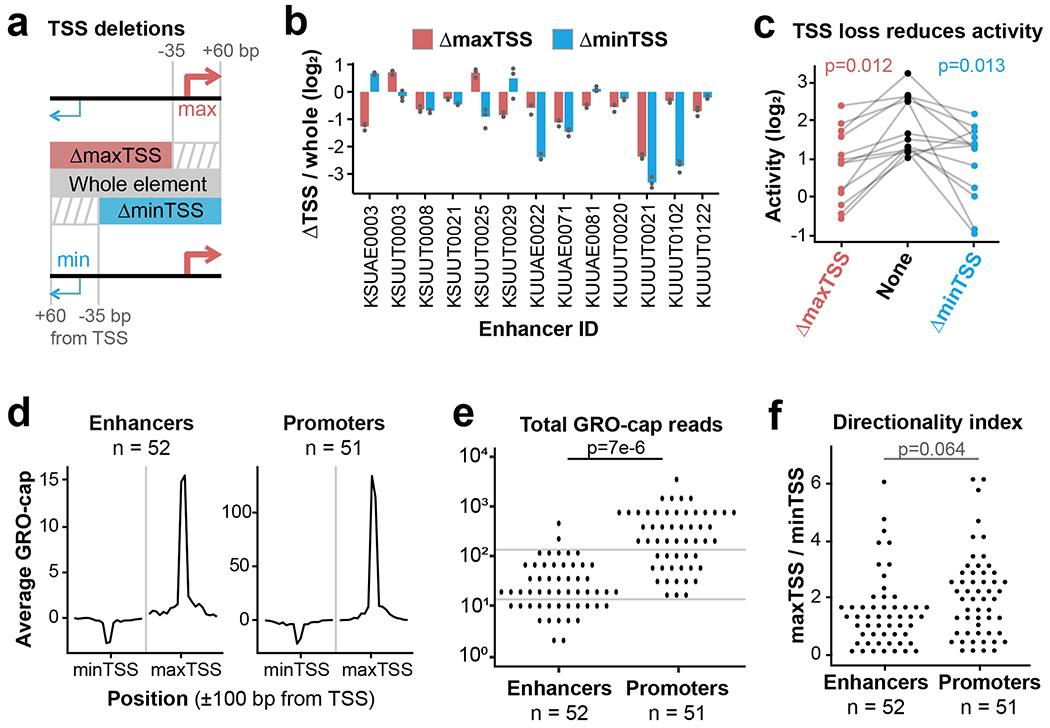
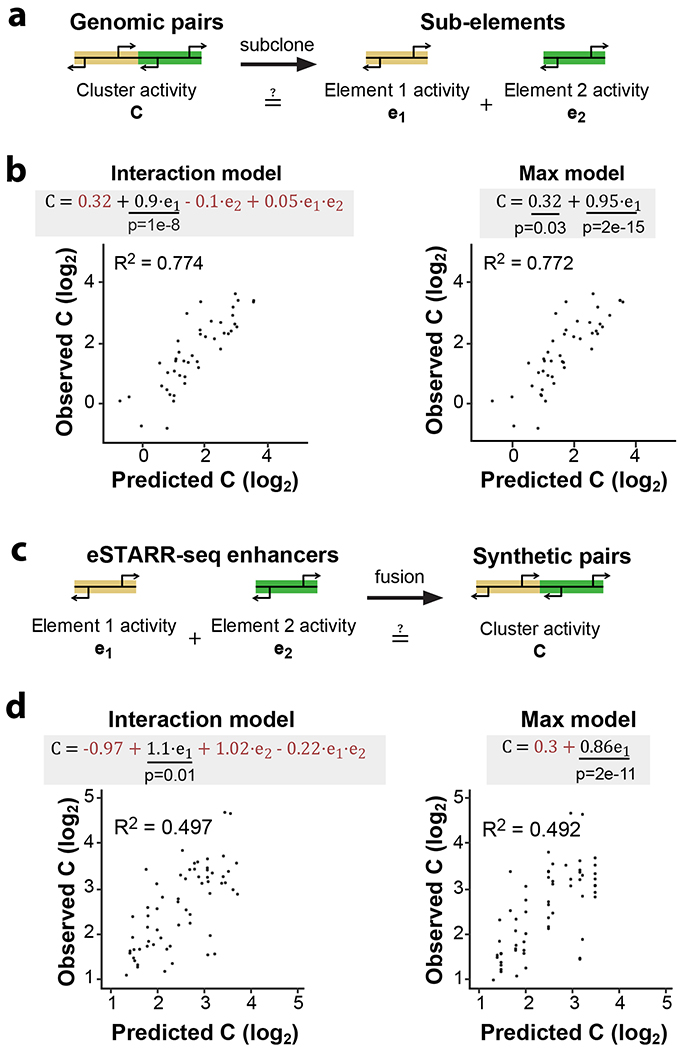
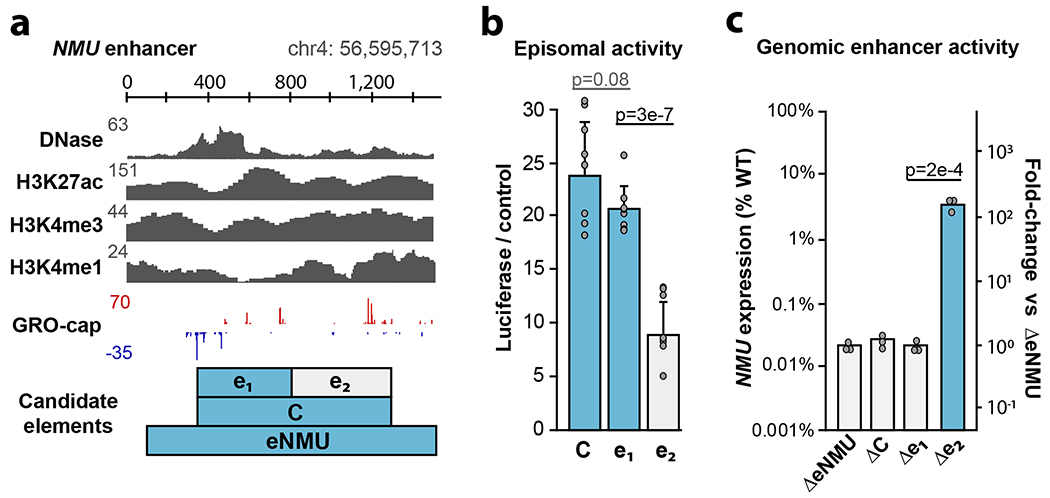
Distal enhancers play pivotal roles in development and disease yet remain one of the least understood regulatory elements. We used massively parallel reporter assays to perform functional comparisons of two leading enhancer models and find that gene-distal transcription start sites are robust predictors of active enhancers with higher resolution than histone modifications. We show that active enhancer units are precisely delineated by active transcription start sites, validate that these boundaries are sufficient for capturing enhancer function, and confirm that core promoter sequences are necessary for this activity. We assay adjacent enhancers and find that their joint activity is often driven by the stronger unit within the cluster. Finally, we validate these results through functional dissection of a distal enhancer cluster using CRISPR-Cas9 deletions. In summary, definition of high-resolution enhancer boundaries enables deconvolution of complex regulatory loci into modular units.


Conflict of interest statement

Competing interests

None.

Figures

Extended Data Fig. 1
Extended Data Fig. 1. Design and validation of eSTARR-seq and selected candidates.
a. Size distribution of candidates is shown by ChromHMM class. b. Correlation between luciferase, STARR-seq, and eSTARR-seq reporter activity in HeLa cells. Luciferase and STARR-seq data are from (Arnold et al., 2013). c. eSTARR-seq activity is shown relative to each elements’ size for both candidate elements (blue) and negative controls (gray). Line indicates a fitted loess curve estimate of size bias for eSTARR-seq and 95% confidence interval in gray.
Extended Data Fig. 2
Extended Data Fig. 2. Comparison with the SCP1 promoter.
a. Correlation between replicates using SCP1. b. eSTARR-seq activity vs element length using SCP1, averaged from n=3 transfection replicates. c. eSTARR-seq activity in forward vs reverse cloning orientations using SCP1 (averaged from n=3). d. Percent of elements from each ChromHMM class with significant enhancer activity for SCP1. Error bars indicate standard error calculated for a sample of binary trials, centered on the observed success rate. e. SCP1 eSTARR-seq activity of elements cloned using TSS+60 bp boundaries (x) or TSS+200 boundaries (y). Gray area shows 95% confidence interval of linear regression from n=93 elements. f. eSTARR-seq activity of MYC (x) vs SCP1 (y) as the promoter. Colors indicate enhancers shared by both promoters (blue), active with only one promoter (red), or inactive with both promoters (gray). g. Percent of elements from each ChromHMM class with significant enhancer activity for both MYC promoter and SCP1. Error bars indicate standard error calculated for a sample of binary trials, centered on the observed probability. h. Venn diagram showing overlap of the MYC promoter and SCP1 active enhancer sets.
Extended Data Fig. 3
Extended Data Fig. 3. Validation of strand bias and TSS function from HiDRA.
a. Pie chart indicating the fraction of HiDRA fragments tested in one (gray) or both (gold) orientations. Some fragments have pairings with more than one fragment in the opposing orientation, providing 763,000 distinct pairs. b. Comparison of HiDRA enhancer activities from opposing orientations of fragment pairs. Color indicates the number of pairs. Gray lines denote approximate statistical cut-off for active enhancers. Quadrants II and III denote orientation-dependent “enhancer” fragment pairs; quadrant IV fragments are active in both orientations. c. Pie chart indicating the percent of HiDRA fragment pairs classified as inactive, orientation-dependent, and orientation-independent. d-e. Bar charts indicating the percentage of orientation-independent enhancer calls from HiDRA fragments sample from DHSs within the indicated ChromHMM classes. d, fragments are further classified as untranscribed or transcribed (contains divergent GRO-cap TSSs). P-values are from two-sided Fisher’s exact test between indicated ratio and total enhancer ratio (140/4,367). e, fragments are sampled from different areas around unpaired GRO-cap TSSs (see cartoon and Methods). Raw fragment counts are shown above each bar. Gray line marks the average percent activity of all fragments. P-values are from two-sided Fisher’s exact test between indicated ratio and total enhancer ratio (402/11,579). All error bars indicate standard error calculated for a sample of binary trials, centered on the observed probability.
Extended Data Fig. 4
Extended Data Fig. 4. Orientation dependence in the HiDRA dataset.
a. Comparison of forward vs reverse cloning orientation for HiDRA fragments overlapping GM12878 DHS peaks. Data points are shown as log2 fold-change of RNA vs DNA read counts. Elements with significantly elevated activity in both orientations are called orientation-independent enhancers (green). Elements with significantly elevated activity in one orientation are called orientation-dependent (black). Remaining fragments are called inactive (gray). b-c. Percent of orientation-dependent (b) or - independent (c) fragments within each GRO-cap and ChromHMM class. Raw fragment counts are shown above each bar. Gray line marks the percent activity of all fragments judged by the same criteria. P-values are from two-sided Fisher’s exact test between indicated ratio and total enhancer ratio (372/4,367 for b, 41/767 for c). Error bars indicate standard error calculated for a sample of binary trials, centered on the observed probability.
Extended Data Fig. 5
Extended Data Fig. 5. Features of eSTARR-seq enhancers.
a. Scatterplot of activity vs GRO-cap reads from eSTARR enhancers in K562 cells. b. Metaplots of average H3K27ac, H3K4me3, and H3K4me1 ChIP-seq signal from different element classes defined in K562 cells. Promoters are defined as GRO-cap divergent TSSs within 500 bp of GENCODE gene start, whereas enhancers are defined as GRO-cap divergent TSSs with significant eSTARR activity. Below, ChIP-seq to GRO-cap signal ratio is shown within the window. c. Metaplots of average H3K27ac, H3K4me3, and H3K4me1 ChIP-seq signal from different element classes defined in GM12878 cells. Promoters are defined as GRO-cap divergent TSSs within 500 bp of GENCODE gene start, whereas enhancers are defined as GRO-cap divergent TSSs with significant HiDRA activity. Below, ChIP-seq to GRO-cap signal ratio is shown within the window. n=860 promoter DHS, 119 transcribed enhancer DHS, 1,100 untranscribed DHS.
Extended Data Fig. 6
Extended Data Fig. 6. Functional dissection of genomic TSS clusters.
a. Comparison of forward vs reverse cloning orientation for all tested TSS clusters. Data points are shown as log2 fold-change vs negative controls (magenta), averaged from three replicates. Positive controls (black) are known MYC or viral enhancers. Clusters with significantly elevated activity in both orientations are called enhancers (green). All other clusters are called inactive (gray). b. Comparison of sub-element activities within active enhancer clusters. The stronger sub-element is always chosen to be e1, and the weaker sub-element is e2. Gray lines indicate approximate significance cut-offs.
Extended Data Fig. 7
Extended Data Fig. 7. Design and evaluation of synthetic unit pairs.
a. Comparison of sub-element activities within synthetic enhancer clusters. The stronger sub-element is always chosen to be e1, and the weaker sub-element is e2. Gray lines indicate approximate significance cut-offs. b. Correlation between individual eSTARR-seq activities tested previously and re-tested as controls in the synthetic fusion screen (n=48 elements). c. Agreement between predicted and observed cluster activities (”C”) for enhancer-containing synthetic pairs. d. Agreement between predicted and observed cluster activities (”C”) for enhancer-less synthetic pairs.
Extended Data Fig. 8
Extended Data Fig. 8. Genotyping of Cas9 deletion clones.
a. Illustration of genotyping PCR amplicon design and size relative to elements targeted for deletion. b. Table listing expected amplicon sizes from various genotypes. “-” indicates that no amplification is expected. c. Gel images from K562 clonal lines used for qRT-PCR experiments in Figure 6. (eNMU clones were generated, genotyped and generously provided by the Shendure lab.) Genotyping PCRs were performed only once, but biological replication was achieved through independent clones.
Fig. 1.
Fig. 1.. Divergent transcription identifies enhancer boundaries in high resolution.
a. Features of two candidate regulatory elements in the MYC locus. Raw read counts are shown for each track, and the “Candidate elements” track indicates cloning boundaries used for luciferase assays of tested sequences. b. Luciferase reporter activity for the regions indicated in a (n = 3 luciferase reactions). P values are from one-sided t test. c. The percent of DHSs within each indicated ChromHMM class that are untranscribed (no GRO-cap TSS) vs. transcribed (containing GRO-cap TSS). Number of transcribed DHSs are indicated. d. A schematic of candidate element selection using DNase hypersensitivity, ChromHMM, and GRO-cap data. Molecular model illustrates DHSs sharing many features, with or without RNAPII transcription.
Fig. 2.
Fig. 2.. Transcription marks active eSTARR-seq enhancers.
a. Outline of element-STARR-seq (eSTARR-seq). Each candidate is cloned into the 3’UTR of a reporter gene in forward or reverse orientations. After transfection, RNA and plasmids are purified separately. Addition of unique molecular identifiers (UMIs) occurs during reverse transcription for RNA, or primer extension for plasmids. After sequencing, enhancer activity is estimated by the ratio of RNA to plasmid UMIs. b. eSTARR-seq is highly reproducible between biological replicates. c. Comparison of activity from forward vs. reverse cloning orientations. Data points are shown as log2 fold-change vs. negative controls. Positive controls are known MYC or viral enhancers (black). Negative controls are human open reading frames (ORFs, red). Elements with significantly elevated activity in both orientations are called enhancers (blue). Remaining candidates are called inactive (gray). d. Summary of enhancer calls from c after averaging forward and reverse activities. Empirical false-discovery rate is 2.4% (6/243 negative controls misidentified as enhancers). e-f. Within each ChromHMM (e) or distance (f) class, the percent of active enhancers identified by eSTARR-seq is indicated. Protein-coding gene annotations are from GENCODE. Error bars indicate standard error calculated for a sample of binary trials, centered on the observed success rate. P values are from two-sided Fisher’s exact test.
Fig. 3.
Fig. 3.. Enhancer unit boundaries reveal sequence architecture.
a. Illustration of a unified model for regulatory sequence architecture of promoters and enhancers. Core promoter motifs (TBP, SP1, STAT2) surround an upstream region containing TF motifs. We define core promoters as the region from Transcription Factor II D (TFIID) binding 32 bp upstream of each TSS, to the RNAPII pause sites at +60 bp from each TSS. b. Divergent TSS pairs were sorted by width and aligned to the max TSS. TSS pairs were also divided by GENCODE class (Gene-distal vs. -proximal). Heatmaps indicate TF motif densities from pairs containing at least one motif within −400 to +100 bp of the maxTSS. Motifs are shown in both forward (red) and reverse (blue) orientations relative to the max TSS. TSS positions are marked in gray. c. Comparison of enhancer activities for the same set of elements using TSS + 60 bp and TSS + 200 bp cloning boundaries. Overlay shows linear regression with 95% confidence interval shaded gray (n = 93 candidate element pairs).
Fig. 4.
Fig. 4.. Function and features of enhancer TSSs.
a. Boundary definitions for whole elements (gray box) and TSS deletions (red and blue boxes). Stripes indicate “deleted” regions. b. Change in eSTARR-seq activity after deleting either the maxTSS (red) or minTSS (blue; n = 3 transfections). c. Plot of element activities after TSS deletion (n = 13 enhancers). P values are from a one-sided paired t test. d. Average profiles of GRO-cap signal from eSTARR-called enhancers vs. promoters. Note 10-fold difference in y-axis scales. e-f. Dot plot of TSS signal and directionality index at enhancers vs. promoters. Gray lines emphasize substantial overlap between enhancer and promoter distributions. P values are from a one-sided t test.
Fig. 5.
Fig. 5.. Functional dissection of adjacent enhancers.
a. Dissection of genomic TSS clusters into individual sub-elements to quantify enhancer cooperativity. b. Two linear models were fit to eSTARR-seq measurements of full clusters (C) and individual enhancers within the cluster (e1 and e2). The interaction model includes both individual enhancers and an interaction term, while the max model only considers the stronger sub-element (chosen to be e1). Fitted equations are shown with significant covariates underlined and non-significant covariates colored red. Interaction model was linear regression with 42 degrees of freedom, F = 40.1. Max was linear regression with 44 degrees of freedom, F = 144. Comparing both models with one-way ANOVA, F = 1.93 and P = 0.158, indicating similar performance. c. Schematic illustrating fusion of active enhancer sequences into synthetic enhancer pairs. d. Fitting of same linear models as b to enhancer activities of individual elements and their synthetic fusion (as shown in c). Interaction model was linear regression with 62 degrees of freedom, F = 23. Max was linear regression with 64 degrees of freedom, F = 67. Comparing both models with one-way ANOVA, F = 0.997 and P = 0.375, indicating similar performance.
Fig. 6.
Fig. 6.. Dissection of the NMU enhancer.
a. Dissection of the TSS cluster within the NMU enhancer (”eNMU”). Cluster “C” contains two distinct candidate subelements: e1 and e2. The presence of e1 is indicated with blue throughout the figure. b. Normalized luciferase activity of the candidate cluster and subelements using the MYC promoter (n = 5 luciferase reactions). c. Quantification of NMU expression from the indicated homozygous Cas9 deletion clones (n = 3 PCR replicates). Representative ΔeNMU and Δe2 expression clones are shown from n = 5 clonal lines; ΔC and Δe1 are from n = 1 clonal line. All error bars indicate standard deviation centered on the mean. All P values are from two-sided t test.

References

    1. Serfling E, Jasin M & Schaffner W Enhancers and eukaryotic gene transcription. Trends in Genetics 1, 224–230 (1985).
    1. Arnold CD et al. Genome-wide quantitative enhancer activity maps identified by STARR-seq. Science 339, 1074–7 (2013). - PubMed
    1. Canver MC et al. BCL11A enhancer dissection by Cas9-mediated in situ saturating mutagenesis. Nature 527, 192–7 (2015). - PMC - PubMed
    1. Tuan D, Solomon W, Li Q & London IM The “beta-like-globin” gene domain in human erythroid cells. Proc Natl Acad Sci U S A 82, 6384–8 (1985). - PMC - PubMed
    1. Orkin SH Regulation of globin gene expression in erythroid cells. Eur J Biochem 231, 271–81 (1995). - PubMed

Methods-only references

    1. Wei X et al. A massively parallel pipeline to clone DNA variants and examine molecular phenotypes of human disease mutations. PLoS Genet 10, e1004819 (2014). - PMC - PubMed
    1. Arad U Modified Hirt procedure for rapid purification of extrachromosomal DNA from mammalian cells. Biotechniques 24, 760–2 (1998). - PubMed
    1. Picelli S et al. Tn5 transposase and tagmentation procedures for massively scaled sequencing projects. Genome Res 24, 2033–40 (2014). - PMC - PubMed
    1. Wang Z, Martins AL & Danko CG RTFBSDB: an integrated framework for transcription factor binding site analysis. Bioinformatics 32, 3024–6 (2016). - PMC - PubMed
    1. Chow RD et al. In vivo profiling of metastatic double knockouts through CRISPR-Cpf1 screens. Nat Methods 16, 405–408 (2019). - PMC - PubMed

Publication types

MeSH terms