. 2020 Nov;35(11):1007-1019.
doi: 10.1007/s10654-020-00680-x. Epub 2020 Sep 21.

National all-cause mortality during the COVID-19 pandemic: a Danish registry-based study

Affiliations

National all-cause mortality during the COVID-19 pandemic: a Danish registry-based study

Elisabeth Helen Anna Mills et al. Eur J Epidemiol. 2020 Nov.

Abstract

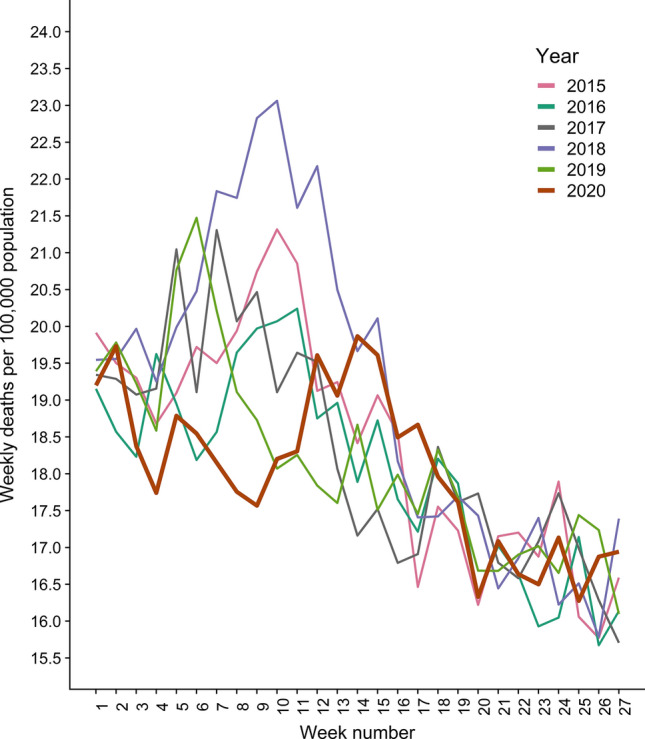
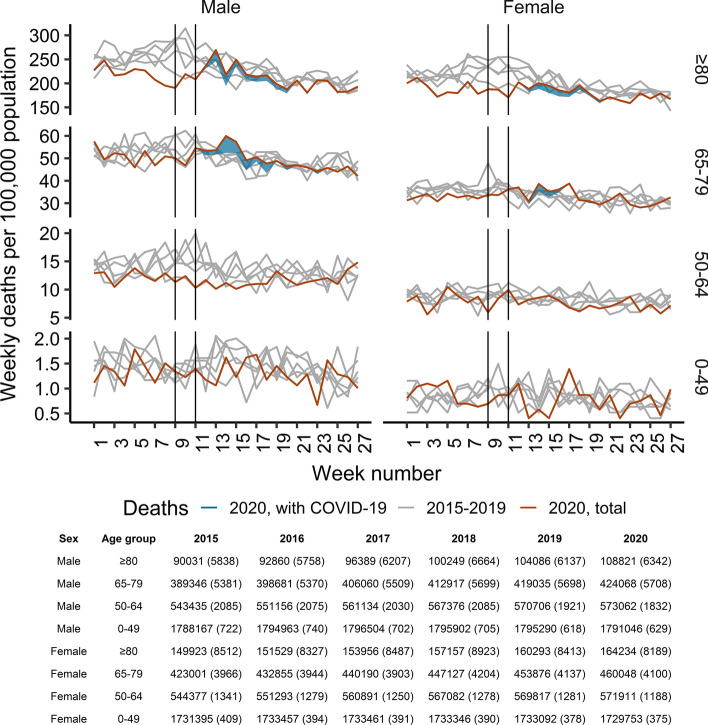
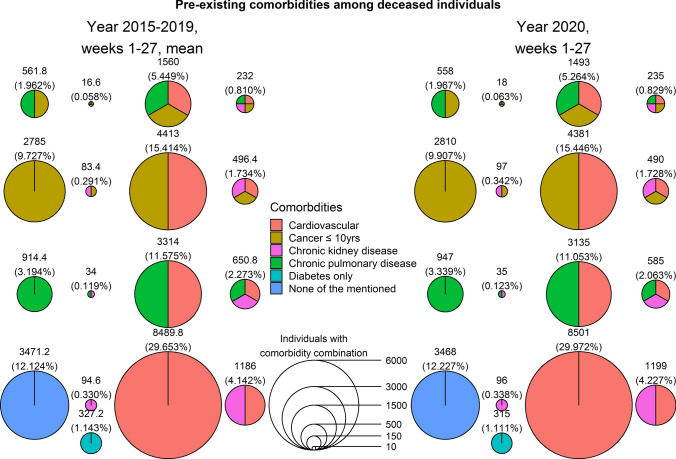
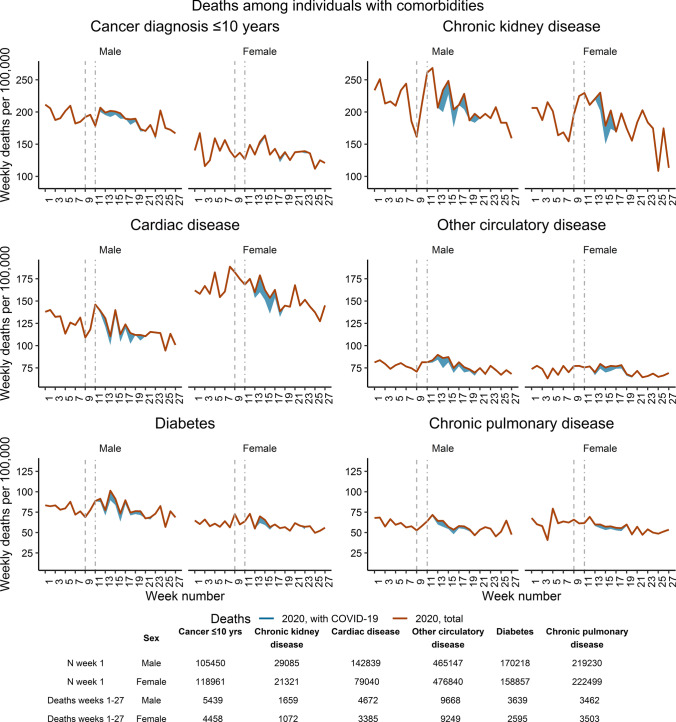
Denmark implemented early widespread social distancing to reduce pressure on the healthcare system from the coronavirus disease 2019 (COVID-19) pandemic, with the aims to reduce mortality. Unintended consequences might be delays in treatment for other diseases and subsequent mortality. We examined national all-cause mortality comparing weeks 1-27 in 2020 and 2015-2019. This registry-based study used Danish national registry data until 5 July 2020. We examined all-cause mortality rates among all deaths recorded from 2015 to 2020 and among chronic conditions (cardiovascular (cardiac & circulatory), chronic pulmonary, chronic kidney disease, cancer, and diabetes), comparing each week in 2020 to weeks in 2015-2019. In 2020, there were 28,363 deaths in weeks 1-27 (30 December 2019-5 July 2020), the mean deaths in 2015-2019 were 28,630 deaths (standard deviation 784). Compared to previous years, the mortality rate in weeks 3-10 of 2020 was low, peaking in week 14 (17.6 per 100,000 persons in week 9, 19.9 per 100,000 in week 14). Comorbidity prevalence among deceased individuals was similar in 2020 and 2015-2019: 71.1% of all deceased had a prior cardiovascular diagnosis, 30.0% of all deceased had a prior cardiac diagnosis. There were 493 deaths with COVID-19 in weeks 11-27, (59.8% male), and 75.1% had a prior cardiovascular diagnosis. Weekly mortality rates for pre-existing chronic conditions peaked in week 14, and then declined. During the COVID-19 pandemic, due to timely lockdown measures, the mortality rate in Denmark has not increased compared to the mortality rates in the same period during 2015-2019.

Keywords: Comorbidity; Covid-19; Epidemiology; Mortality; Population.


Conflict of interest statement

Dr. Schou reports to have received lecture grants from Novo, Bohringer, Novartis and Astra Zeneca outside the clinical study. Dr. Køber reports personal fees from Novartis, AstraZeneca and Boehringer for presentations at meetings, outside the submitted work. Dr. Torp-Pedersen reports grants for studies from Bayer and Novo Nordisk.

Figures

Fig. 1
Fig. 1
Death rates (all deaths per 100,000 population) for weeks 1–27, 2020 compared to 2015–2019. Years and week numbers according to the ISO 8601 standard (i.e. 3 days in 2014 included in week 1 of 2015)
Fig. 2
Fig. 2
Mortality rates, divided by sex and age groups, in weeks 1–27 in 2020 compared to years 2015–2019. Grey lines are individual years. Vertical lines at weeks 9 and 11 indicate the first coronavirus case and lockdown measures, respectively. Years and week numbers according to the ISO 8601 standard. (i.e. 3 days in 2014 included in week 1 of 2015). The blue shaded space represents deaths with COVID-19, only displayed for > 3 deaths per week. Note, different Y-axis scale for different age-groups. Table lists the population distribution of sex and age groups in week 1 of each year, deaths in parentheses
Fig. 3
Fig. 3
Combinations of pre-existing comorbidities in patients dead in weeks 1–27, 2020 compared to the average of years 2015–19. Each circle’s area represents the amount of people in this combination of conditions. Each person only appears once, in the circle corresponding to their combinations of comorbidities. Percentages are percentages of the total deaths (of the averages in 2015–2019) and of the total for 2020. The segmentation of the circles shows the amount of conditions in this combination, and the colours show the chronic conditions in question. Average number of deaths in 2015–2019:28,630.2, deaths in 2020: n = 28,363 deaths
Fig. 4
Fig. 4
Mortality rates in weeks 1–27 in for patients with pre-existing chronic conditions in. Incident cases only counted at the start of the next whole week. Vertical lines at weeks 9 and 11 indicate the first coronavirus case and lockdown measures, respectively. Week numbers according to the ISO 8601 standard (i.e. week 1 of 2020 starts on 30 December). The blue shaded space represents deaths with COVID-19, only displayed for > 3 deaths per week. Note, different sum than in Table 2, due to only counting incident cases in the following week. Also note different Y-axis scales for the rows

References

    1. Phua J, Weng L, Ling L, et al. Intensive care management of coronavirus disease 2019 (COVID-19): challenges and recommendations. Lancet Respir Med. 2020;8:506–517. doi: 10.1016/S2213-2600(20)30161-2. - DOI - PMC - PubMed
    1. Verelst F, Kuylen E, Beutels P. Indications for healthcare surge capacity in European countries facing an exponential increase in coronavirus disease (COVID-19) cases. Eurosurveillance. 2020;25:2000323. doi: 10.2807/1560-7917.ES.2020.25.13.2000323. - DOI - PMC - PubMed
    1. Onder G, Rezza G, Brusaferro S. Case-Fatality Rate and Characteristics of Patients Dying in Relation to COVID-19 in Italy. JAMA. 2020;323(18):1775–1776. doi: 10.1001/jama.2020.4683. - DOI - PubMed
    1. Tam C-CF, Cheung K-S, Lam S, et al. Impact of Coronavirus Disease 2019 (COVID-19) Outbreak on ST-Segment–Elevation Myocardial Infarction Care in Hong Kong. China. Circ Cardiovasc Qual Outcomes. 2020;13(4):e006631. doi: 10.1161/CIRCOUTCOMES.120.006631. - DOI - PMC - PubMed
    1. Rosenbaum L. The Untold Toll—The Pandemic’s Effects on Patients without Covid-19. N Engl J Med. 2020 doi: 10.1056/NEJMms2009984. - DOI - PubMed