

Quaternary Structure Changes for PrPSc Predate PrPC Downregulation and Neuronal Death During Progression of Experimental Scrapie Disease
- PMID: 32959170
- PMCID: PMC7695655
- DOI: 10.1007/s12035-020-02112-z
Quaternary Structure Changes for PrPSc Predate PrPC Downregulation and Neuronal Death During Progression of Experimental Scrapie Disease
Abstract
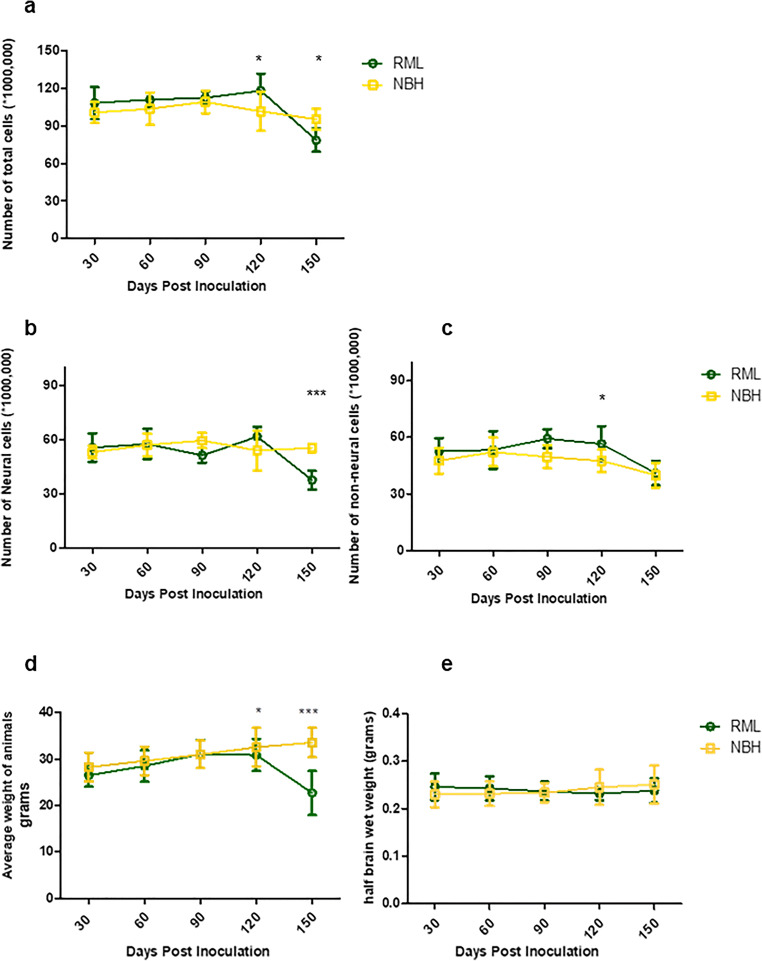
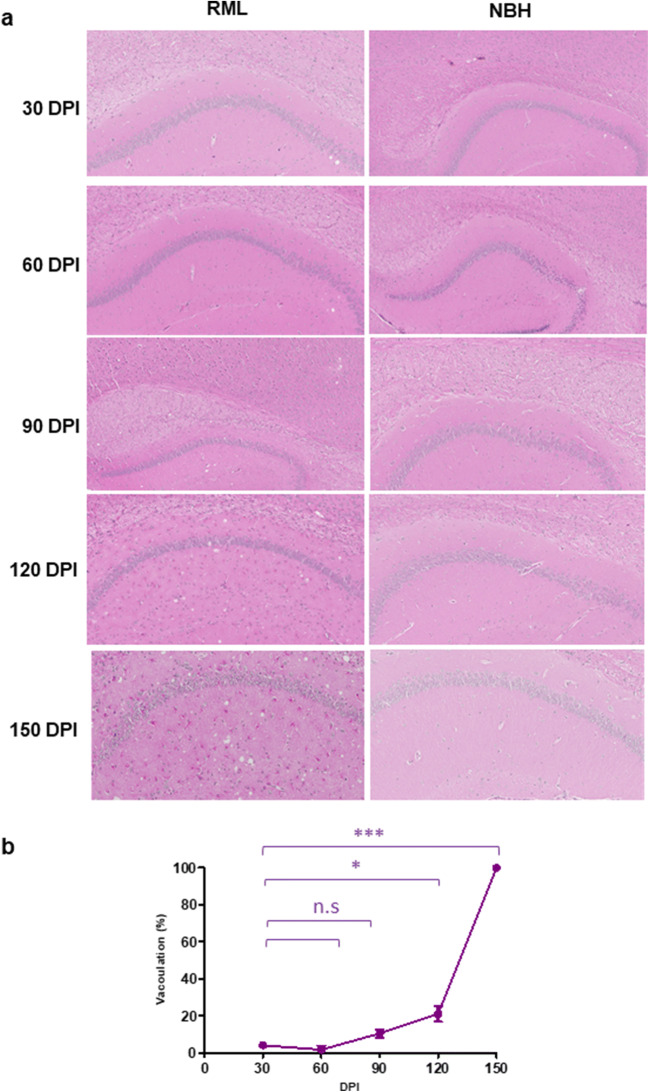
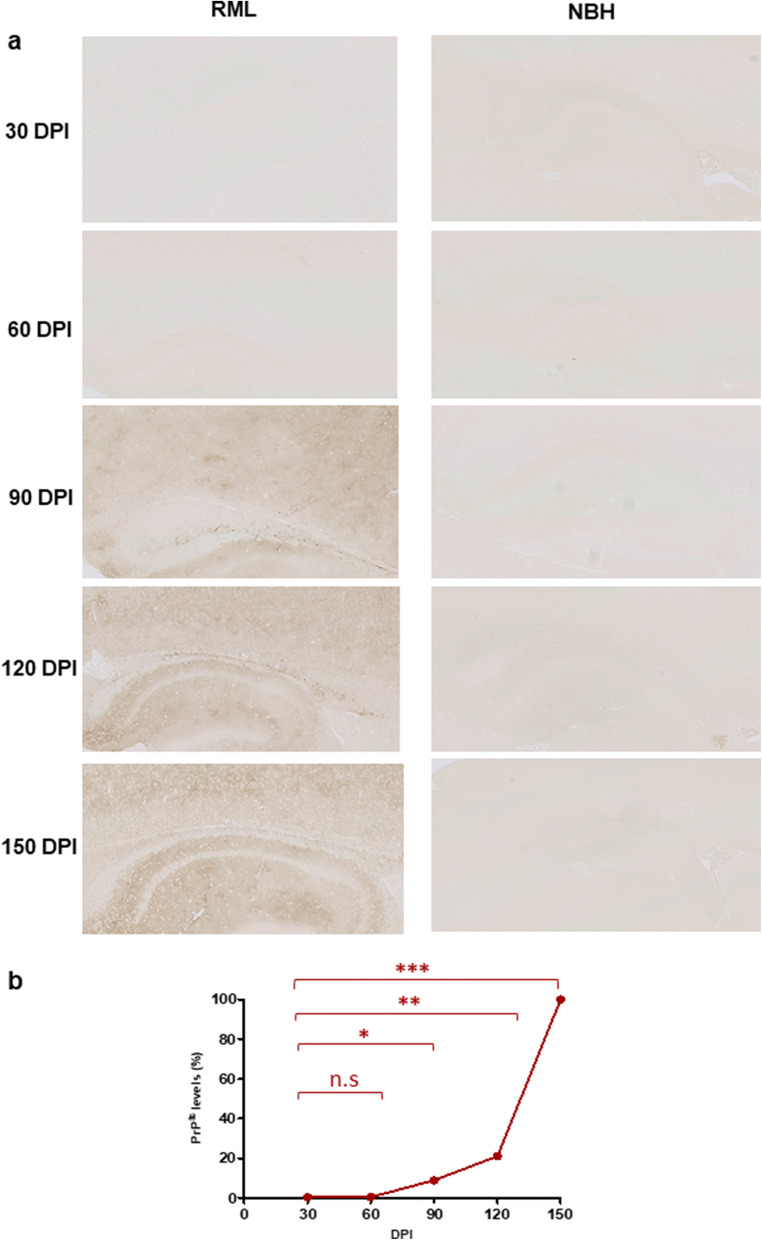
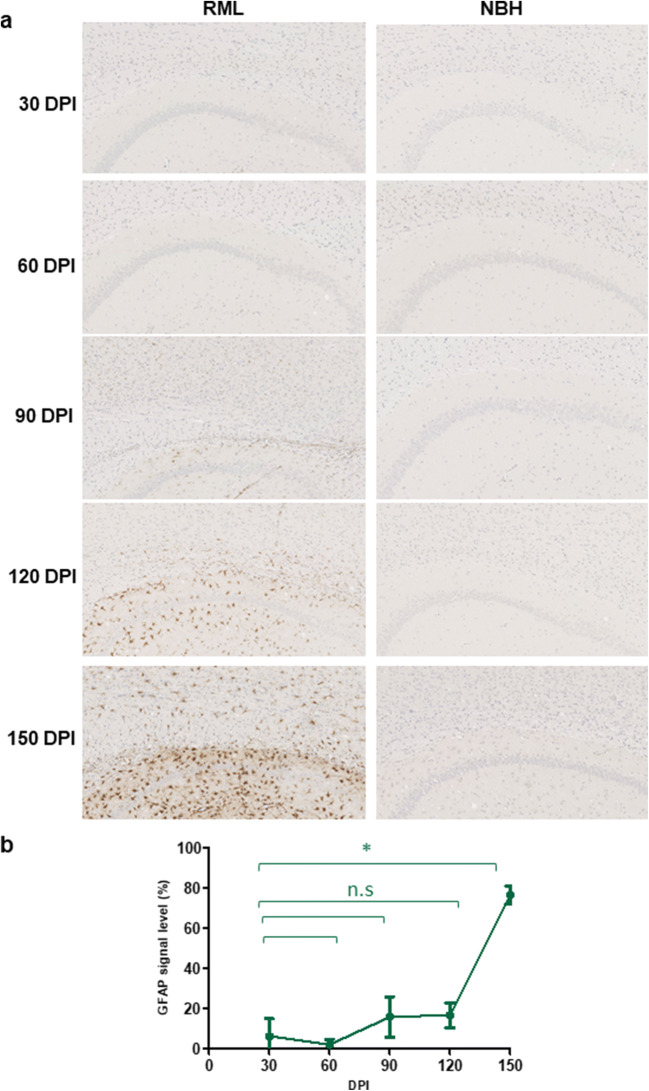
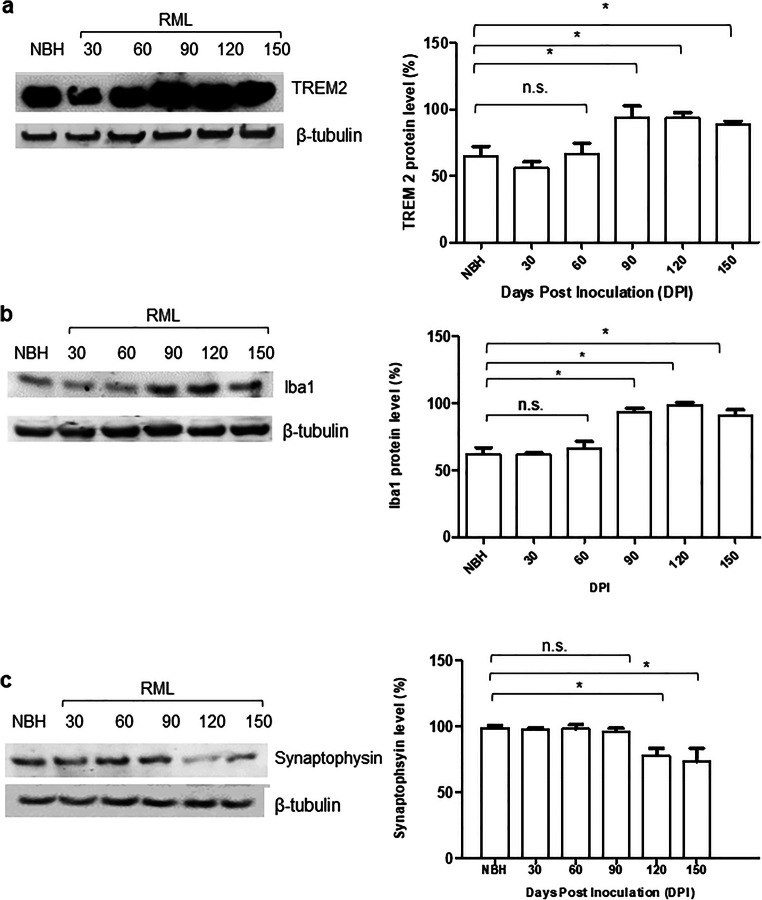
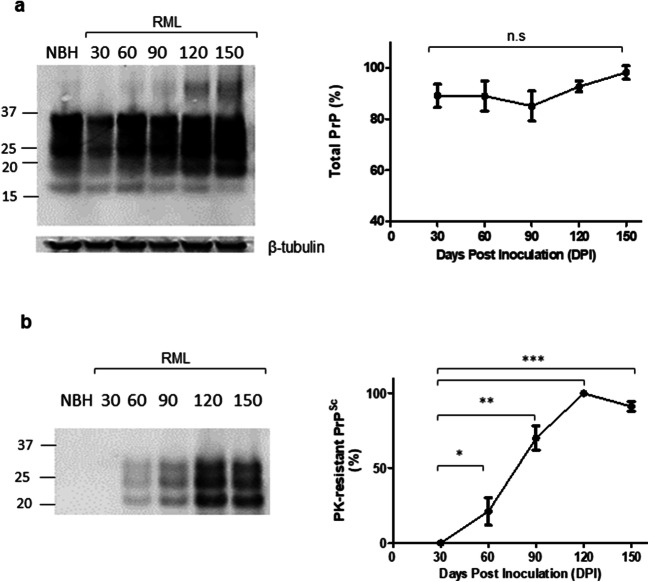
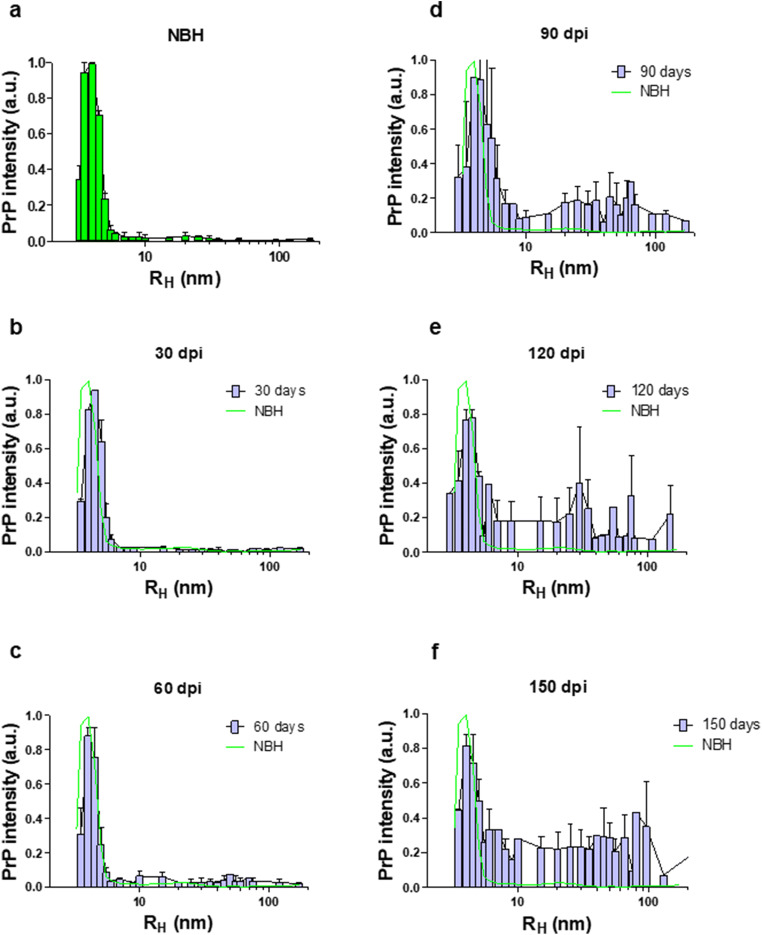
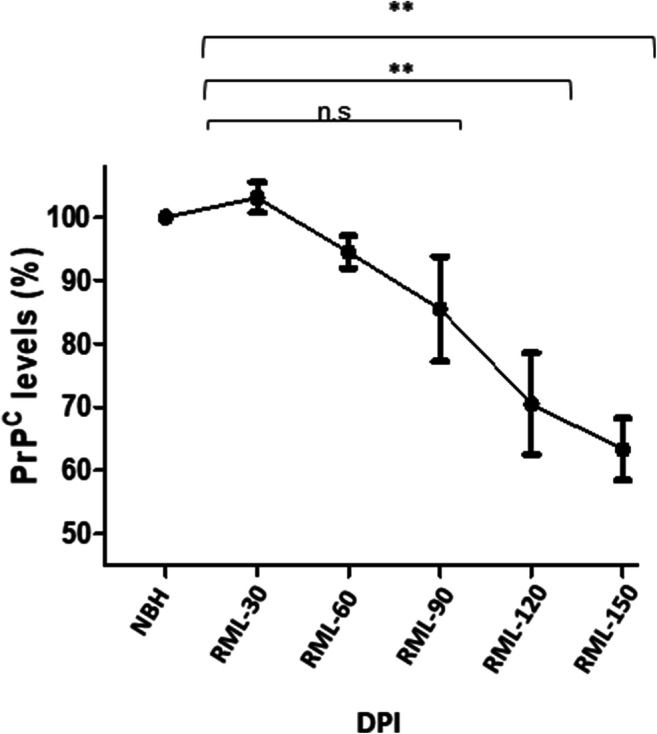
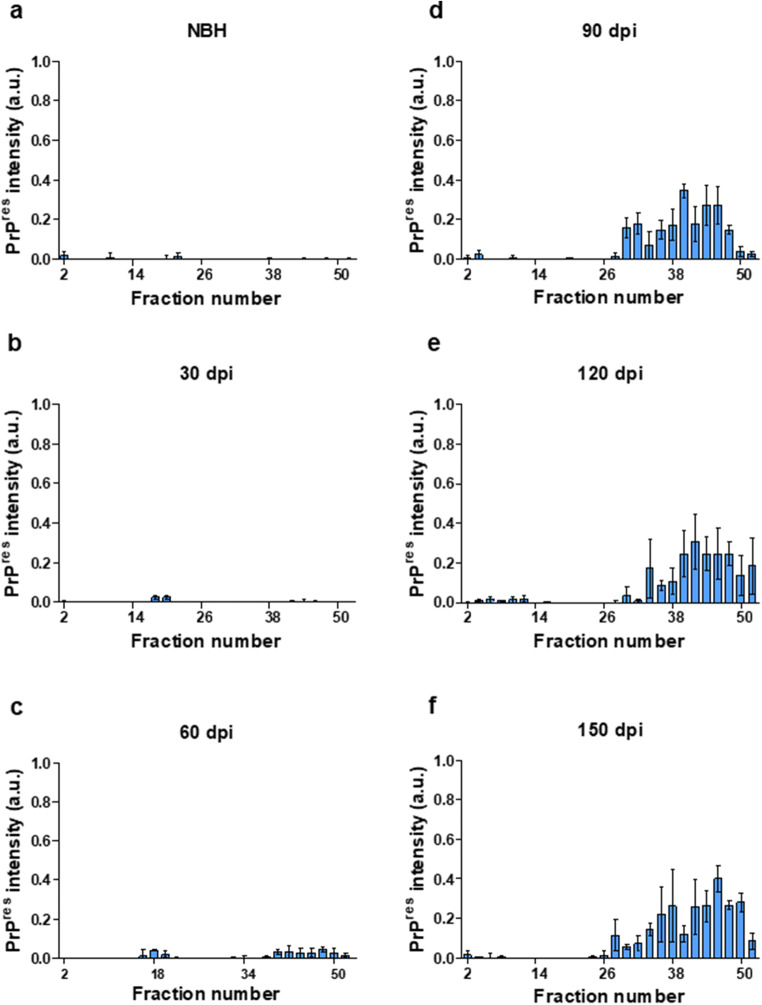
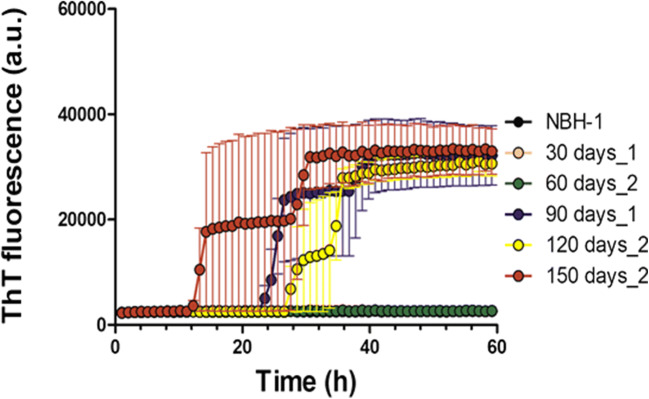
Prion diseases are fatal neurodegenerative diseases in mammals with the unique characteristics of misfolding and aggregation of the cellular prion protein (PrPC) to the scrapie prion (PrPSc). Although neuroinflammation and neuronal loss feature within the disease process, the details of PrPC/PrPSc molecular transition to generate different aggregated species, and the correlation between each species and sequence of cellular events in disease pathogenesis are not fully understood. In this study, using mice inoculated with the RML isolate of mouse-adapted scrapie as a model, we applied asymmetric flow field-flow fractionation to monitor PrPC and PrPSc particle sizes and we also measured seeding activity and resistance to proteases. For cellular analysis in brain tissue, we measured inflammatory markers and synaptic damage, and used the isotropic fractionator to measure neuronal loss; these techniques were applied at different timepoints in a cross-sectional study of disease progression. Our analyses align with previous reports defining significant decreases in PrPC levels at pre-clinical stages of the disease and demonstrate that these decreases become significant before neuronal loss. We also identified the earliest PrPSc assemblies at a timepoint equivalent to 40% elapsed time for the disease incubation period; we propose that these assemblies, mostly composed of proteinase K (PK)-sensitive species, play an important role in triggering disease pathogenesis. Lastly, we show that the PK-resistant assemblies of PrPSc that appear at timepoints close to the terminal stage have similar biophysical characteristics, and hence that preparative use of PK-digestion selects for this specific subpopulation. In sum, our data argue that qualitative, as well as quantitative, changes in PrP conformers occur at the midpoint of subclinical phase; these changes affect quaternary structure and may occur at the threshold where adaptive responses become inadequate to deal with pathogenic processes.
Keywords: Asymmetric flow field-flow fractionation; Neuronal loss; PrP assemblies; PrPC downregulation; Prion disease; RML.
Conflict of interest statement
The authors declare that they have no conflicts of interest.
Figures
Similar articles
-
Pressure-assisted dissociation and degradation of "proteinase K-resistant" fibrils prepared by seeding with scrapie-infected hamster prion protein.Prion. 2014;8(4):314-8. doi: 10.4161/pri.32081. Prion. 2014. PMID: 25482603 Free PMC article.
-
Strain-Dependent Prion Infection in Mice Expressing Prion Protein with Deletion of Central Residues 91-106.Int J Mol Sci. 2020 Oct 1;21(19):7260. doi: 10.3390/ijms21197260. Int J Mol Sci. 2020. PMID: 33019549 Free PMC article.
-
Modulation of proteinase K-resistant prion protein in cells and infectious brain homogenate by redox iron: implications for prion replication and disease pathogenesis.Mol Biol Cell. 2007 Sep;18(9):3302-12. doi: 10.1091/mbc.e07-04-0317. Epub 2007 Jun 13. Mol Biol Cell. 2007. PMID: 17567949 Free PMC article.
-
Prion diseases and emerging prion diseases.Curr Med Chem. 2008;15(9):912-6. doi: 10.2174/092986708783955437. Curr Med Chem. 2008. PMID: 18473798 Review.
-
Proteinase K and the structure of PrPSc: The good, the bad and the ugly.Virus Res. 2015 Sep 2;207:120-6. doi: 10.1016/j.virusres.2015.03.008. Epub 2015 Mar 24. Virus Res. 2015. PMID: 25816779 Review.
Cited by
-
Structural and electronic analysis of the octarepeat region of prion protein with four Cu2+ by polarizable MD and QM/MM simulations.Phys Chem Chem Phys. 2021 Oct 6;23(38):21568-21578. doi: 10.1039/d1cp03187b. Phys Chem Chem Phys. 2021. PMID: 34550129 Free PMC article.
-
Propagation of PrPSc in mice reveals impact of aggregate composition on prion disease pathogenesis.Commun Biol. 2023 Nov 14;6(1):1162. doi: 10.1038/s42003-023-05541-3. Commun Biol. 2023. PMID: 37964018 Free PMC article.
-
Creutzfeldt-Jakob disease and other prion diseases.Nat Rev Dis Primers. 2024 Feb 29;10(1):14. doi: 10.1038/s41572-024-00497-y. Nat Rev Dis Primers. 2024. PMID: 38424082 Review.
-
Asymmetric-flow field-flow fractionation of prions reveals a strain-specific continuum of quaternary structures with protease resistance developing at a hydrodynamic radius of 15 nm.PLoS Pathog. 2021 Jun 28;17(6):e1009703. doi: 10.1371/journal.ppat.1009703. eCollection 2021 Jun. PLoS Pathog. 2021. PMID: 34181702 Free PMC article.
-
Prion-like strain effects in tauopathies.Cell Tissue Res. 2023 Apr;392(1):179-199. doi: 10.1007/s00441-022-03620-1. Epub 2022 Apr 23. Cell Tissue Res. 2023. PMID: 35460367 Free PMC article. Review.
References
-
- Bolton DC, McKinley MP, Prusiner SB. Identification of a protein that purifies with the scrapie prion. Science. 1982;218(4579):1309–1311. - PubMed
-
- Prusiner SB. Molecular biology of prion diseases. Science. 1991;252(5012):1515–1522. - PubMed
-
- Dickinson A. The scrapie replication-site hypotheses and its implications for pathogenesis. Slow transmissible diseases of the nervous system. 1979;2:13–31.
MeSH terms
Substances
Grants and funding
LinkOut - more resources
Full Text Sources
Research Materials
