

With great inequality comes great responsibility: the role of government spending on population health in the presence of changing income distributions
- PMID: 32959327
- PMCID: PMC7910388
- DOI: 10.17269/s41997-020-00407-1
With great inequality comes great responsibility: the role of government spending on population health in the presence of changing income distributions
Abstract
Objectives: To determine the association between provincial government health and social spending and population health outcomes in Canada, separately for men and women, and account for the potential role of income inequality in modifying the association.
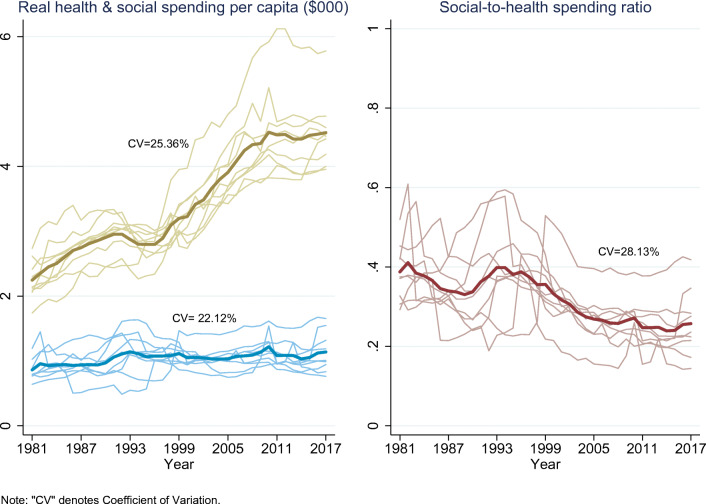
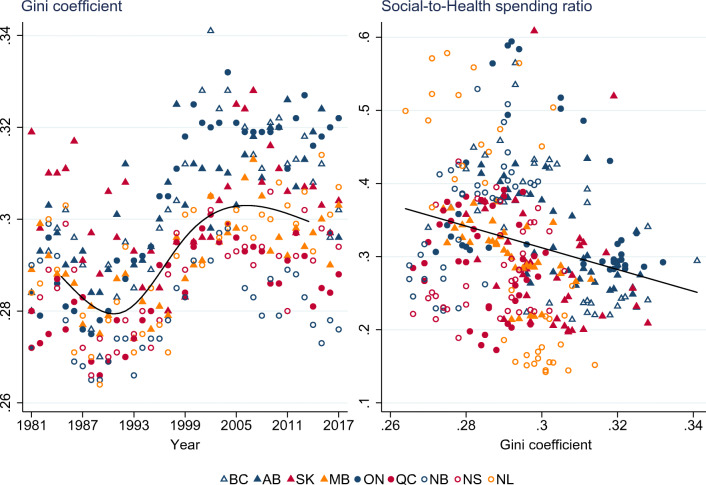
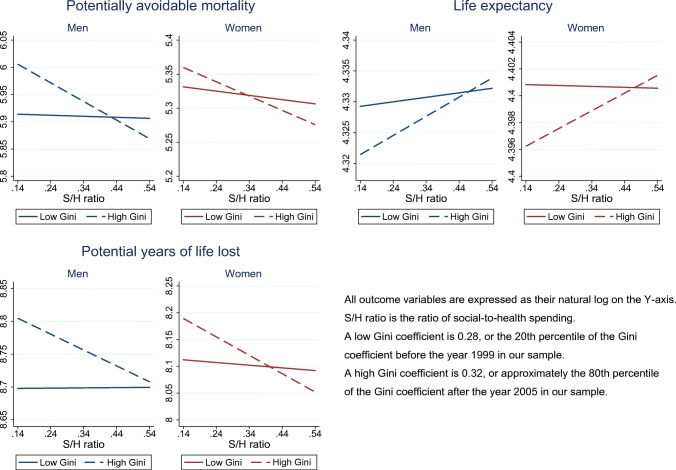
Methods: We used data for nine Canadian provinces, 1981 to 2017. Health outcomes and demographic data are from Statistics Canada; provincial spending data are from provincial public accounts. We model the ratio of social-to-health spending ("the ratio") on potentially avoidable mortality (PAM), life expectancy (LE), potential years of life lost (PYLL), infant mortality, and low birth weight baby incidence. We interact the ratio with the Gini coefficient to allow for income inequality modification.
Results: When the Gini coefficient is equal to its average (0.294), the ratio is associated with desirable health outcomes for adult men and women. For example, among women, a 1% increase in the ratio is associated with a 0.04% decrease in PAM, a 0.05% decrease in PYLL, and a 0.002% increase in LE. When the Gini coefficient is 0.02 higher than average, the relationship between the ratio and outcomes is twice as strong as when the Gini is at its average, other than for PAM for women. Infant-related outcomes do not have a statistically significant association with the ratio.
Conclusion: Overall, outcomes for men and women have similar associations with the ratio. Inequality increases the return to social spending, implying that those who benefit the most from social spending reap higher benefits during periods of higher inequality.
RéSUMé: OBJECTIFS: Déterminer l’association entre les dépenses sociales et de santé du gouvernement provincial et les conditions de santé de la population du Canada, séparément pour hommes et femmes, et expliquer le role que l’inégalité salariale pourrait jouer dans la modification de cette association. MéTHODES: Nous avons utilisé les données pour neuf provinces canadiennes, de 1981 à 2017. Les conditions de santé et les données démographiques parviennent de Statistiques Canada, les données sur les dépenses provinciales parviennent de comptes publiques provinciaux. Nous avons modélisé le rapport de dépenses social-à-santé (« le rapport ») sur la mortalité potentiellement évitable (MPE), l’espérance de vie (EV), les années de vie potentielles perdues (AVPP), la mortalité d’enfant et l’incidence d’un poids à la naissance faible. Nous interagissons le rapport avec le coefficient de Gini pour permettre la modification d’inégalité salariale. RéSULTATS: Quand le coefficient de Gini est égal à sa moyenne (0,294), le rapport est associé avec des conditions de santé désirables pour hommes et femmes adultes. Par example, en femmes, une augmentation de 1 % dans le rapport est associé avec une réduction de 0,04 % en MPE, une réduction de 0,05 % en AVPP, et une augmentation de 0,002 % en EV. Quand le coefficient de Gini est 0,02 plus haut que la moyenne, la relation entre le rapport et les résultats est deux fois plus fort que quand le Gini est à sa moyenne, à part la MPE en femmes. Les résultats liés aux nouveau-nés n’ont pas une association statistique significative avec le rapport. CONCLUSION: Globalement, les résultats pour hommes et femmes ont des associations semblables avec le rapport. L’inégalité augmente le retour aux dépenses sociales, insinuant que ceux et celles qui profitent le plus de dépenses sociales récoltent plus de bénéfices pendant des périodes de plus grande inégalité.
Keywords: Canada; Health expenditures; Population health; Social determinants of health.
Conflict of interest statement
The authors declare that they have no conflict of interest.
Figures
Similar articles
-
Effect of provincial spending on social services and health care on health outcomes in Canada: an observational longitudinal study.CMAJ. 2018 Jan 22;190(3):E66-E71. doi: 10.1503/cmaj.170132. CMAJ. 2018. PMID: 29358200 Free PMC article.
-
The politics of preventable deaths: local spending, income inequality, and premature mortality in US cities.J Epidemiol Community Health. 2004 Mar;58(3):175-9. doi: 10.1136/jech.2003.008672. J Epidemiol Community Health. 2004. PMID: 14966226 Free PMC article.
-
Public and private pharmaceutical spending as determinants of health outcomes in Canada.Health Econ. 2005 Feb;14(2):107-16. doi: 10.1002/hec.922. Health Econ. 2005. PMID: 15386658
-
The Health Effects of Income Inequality: Averages and Disparities.Annu Rev Public Health. 2016;37:413-30. doi: 10.1146/annurev-publhealth-032315-021606. Epub 2016 Jan 6. Annu Rev Public Health. 2016. PMID: 26735427 Review.
-
Population health in an era of rising income inequality: USA, 1980-2015.Lancet. 2017 Apr 8;389(10077):1475-1490. doi: 10.1016/S0140-6736(17)30571-8. Lancet. 2017. PMID: 28402829 Review.
Cited by
-
Effect of the COVID-19 pandemic on the socioeconomic composition of emergency department presentations.Can J Public Health. 2022 Dec;113(6):878-886. doi: 10.17269/s41997-022-00684-y. Epub 2022 Aug 15. Can J Public Health. 2022. PMID: 35969354 Free PMC article.
-
Transitioning to a guaranteed annual income and the impact on activities of daily living in older adults: Evidence from public pensions in Canada using the CLSA.Can J Public Health. 2024 Dec;115(6):903-912. doi: 10.17269/s41997-024-00875-9. Epub 2024 Apr 22. Can J Public Health. 2024. PMID: 38647638 Free PMC article.
-
Chasing cancer: does the social-to-medical spending ratio relate to cancer incidence and mortality in Canadian provinces? A retrospective cohort study.BMJ Public Health. 2024 Jul 12;2(1):e000858. doi: 10.1136/bmjph-2023-000858. eCollection 2024 Jun. BMJ Public Health. 2024. PMID: 40018099 Free PMC article.
-
Income inequality and life expectancy in Canada: New evidence from province-level panel regression, 1996-2019.Can J Public Health. 2025 May 21. doi: 10.17269/s41997-025-01024-6. Online ahead of print. Can J Public Health. 2025. PMID: 40399604
References
-
- Beach CM. Changing income inequality: a distributional paradigm for Canada. Canadian Journal of Economics/Revue Canadienne d’économique. 2016;49(4):1229–1292. doi: 10.1111/caje.12248. - DOI
-
- Bor, J., Cohen, G. H., & Galea, S. (2017). Population health in an era of rising income inequality: USA, 1980–2015. In The Lancet (Vol. 389, Issue 10077, pp. 1475–1490). Lancet Publishing group. 10.1016/S0140-6736(17)30571-8. - PubMed
MeSH terms
LinkOut - more resources
Full Text Sources
Medical
Miscellaneous
