Observational Study
. 2020 Dec;35(12):3549-3555.
doi: 10.1007/s11606-020-06208-z. Epub 2020 Sep 21.

Association Between Pain, Blood Pressure, and Medication Intensification in Primary Care: an Observational Study

Affiliations
Observational Study

Association Between Pain, Blood Pressure, and Medication Intensification in Primary Care: an Observational Study

Elizabeth R Pfoh et al. J Gen Intern Med. 2020 Dec.

Abstract

Background: Treating hypertension is important but physicians often do not intensify blood pressure (BP) treatment in the setting of pain.

Objective: To identify whether reporting pain is associated with (1) elevated BP at the same visit, (2) medication intensification, and (3) elevated BP at the subsequent visit.

Design: Retrospective cohort SETTING: Integrated health system PARTICIPANTS: Adults seen in primary care EXPOSURE: Pain status based on numerical scale: mild (1-3), moderate (4-6), or severe (≥ 7).

Main measures: We defined elevated BP as ≥ 140/80 mmHg and medication intensification as increasing the dose or adding a new antihypertensive medication. Multilevel regression models were used to find the association between pain and (1) elevated BP at the index visit; (2) medication intensification at the index visit; and (3) elevated BP at the subsequent visit. Models adjusted for demographics, chronic conditions, and clustering within physician. In the third model, we adjusted for initial systolic BP as well.

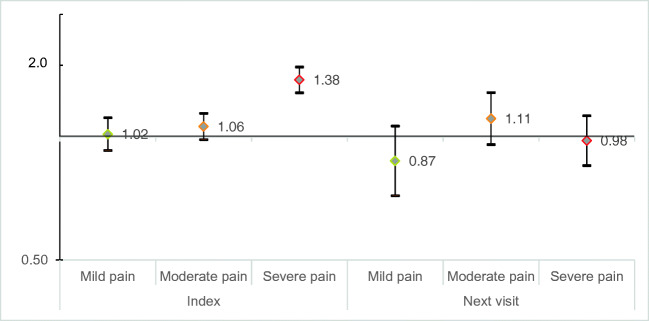
Key results: Our population included 56,322 patients; 3155 (6%) reported mild pain, 5050 (9%) reported moderate pain, and 4647 (8%) reported severe pain at the index visit. Compared with no pain, the adjusted odds ratios of elevated BP were 1.38 (95% CI: 1.28-1.48) for severe pain, 1.06 (95% CI: 0.99-1.14) for moderate pain, and 1.02 (95% CI: 0.93-1.12) for mild pain. Adjusted odds ratios of medication intensification at the index visit were 0.65 (95% CI: 0.54-0.80) for mild pain, 0.61 (95% CI: 0.52-0.72) for moderate pain, and 0.55 (95% CI: 0.47-0.64) for severe pain. Among patients with elevated BP at the index visit, reporting pain at the index visit was not associated with elevated BP at the subsequent visit.

Conclusions: When patients reported pain, physicians were less likely to intensify antihypertensive treatment; nevertheless, patients reporting pain were not more likely to have elevated BP at the subsequent visit.

Keywords: hypertension; medications; pain; primary care; quality of care.


Conflict of interest statement

Dr. Pfoh’s time is supported in part by a National Institute of Health Loan Repayment Grant from the National Heart, Lung, and Blood Institute. All authors report that they have no relevant conflicts of interest to disclose.

Figures

Figure 1
Figure 1
Adjusted odds ratio of elevated systolic blood pressure versus non-elevated blood pressure at the index visit and subsequent visit by pain status. We used logistic regressions to find the association between report of pain at the index visit and odds of elevated blood pressure versus non-elevated blood pressure. All models were adjusted for age, sex, race, marriage, insurance status, number of chronic conditions, and within-physician clustering. The model that evaluated odds of elevated blood pressure at the subsequent visit also included the patient’s baseline systolic blood pressure recorded at the index visit. At the index visit, when comparing mild pain to no pain the AOR: 1.02; 95% CI: 0.93–1.12, p = 0.73; comparing moderate to no pain: AOR: 1.06, 95% CI: 0.99–1.14, p = 0.11; comparing severe pain to no pain: AOR: 1.38, 95% CI: 1.28–1.48, p < 0.001. The sample size was 56,231. At the subsequent visit: comparing mild pain to no pain: AOR: 0.87, 95% CI: 0.71–1.06, p = 0.17; comparing moderate to no pain: AOR: 1.11, 95% CI: 0.95–1.28, p = 0.20; comparing severe pain to no pain: AOR: 0.98; 95% CI: 0.84–1.12, p = 0.70. This sample was restricted to individuals who had elevated blood pressure at the index visit and had a subsequent visit within 180 days (n = 9084 people).
Figure 2
Figure 2
Percentage of patients being prescribed an antihypertensive medication between 0 and 180 days after having an elevated systolic blood pressure. Using a Kruskal–Wallis equality-of-populations rank test, there was a significant difference between reported severity of pain and prescription for an antihypertensive medication at the index date (p < 0.01) and between days 31 and 90 (p < 0.03) but not between days 1 and 30 (p = 0.56) or 91 and 180 (p = 0.29). Catagory percentages may differ slightly from the total percentage due to rounding.
Figure 3
Figure 3
Adjusted average number of days to the subsequent visit by pain status for patients with elevated blood pressure at the index visit. We used linear regressions to find the association between report of pain at the index visit and average number of days until the subsequent visit for patients with elevated blood pressure at the index visit. The regression model was adjusted for age, sex, race, marriage, insurance status, number of chronic conditions, and systolic blood pressure at the index visit. Predictive margins are shown. It took 67 (95% CI: 65–68) days for patients in no pain to have their next visit; 64 (95% CI: 60–69) days for patients in mild pain to have their next visit; 61 (95% CI: 58–64) days for patients in moderate pain to have their next visit; and 57 (95% CI: 54–60) days for patients in severe pain. There was no significant difference in time to next visit for patients in mild pain compared with no pain (p = 0.33) but there was a difference comparing moderate pain and severe pain to no pain (p < 0.01). This sample was restricted to individuals who had elevated blood pressure at the index visit and had a subsequent visit within 180 days (n = 9084 people).

References

    1. The US Burden of Disease Collaborators. Mokdad AH, Ballestros K, et al. The State of US Health, 1990-2016: Burden of Diseases, Injuries, and Risk Factors Among US States. JAMA. 2018;319(14):1444. doi: 10.1001/jama.2018.0158. - DOI - PMC - PubMed
    1. Muntner P, Carey RM, Gidding S, et al. Potential US Population Impact of the 2017 ACC/AHA High Blood Pressure Guideline. Circulation. 2018;137(2):109–118. doi: 10.1161/CIRCULATIONAHA.117.032582. - DOI - PMC - PubMed
    1. Bruehl S, Chung OY, Jirjis JN, Biridepalli S. Prevalence of Clinical Hypertension in Patients With Chronic Pain Compared to Nonpain General Medical Patients. Clin J Pain. 2005;21(2):147–153. doi: 10.1097/00002508-200503000-00006. - DOI - PubMed
    1. Burton AR, Fazalbhoy A, Macefield VG. Sympathetic Responses to Noxious Stimulation of Muscle and Skin. Front Neurol. 2016;7. doi:10.3389/fneur.2016.00109 - PMC - PubMed
    1. Bruehl S, Chung OY. Interactions between the cardiovascular and pain regulatory systems: an updated review of mechanisms and possible alterations in chronic pain. Neurosci Biobehav Rev. 2004;28(4):395–414. doi: 10.1016/j.neubiorev.2004.06.004. - DOI - PubMed

Publication types

Substances