Integrated quantitative susceptibility and R2 * mapping for evaluation of liver fibrosis: An ex vivo feasibility study
- PMID: 32959425
- PMCID: PMC7768551
- DOI: 10.1002/nbm.4412
Integrated quantitative susceptibility and R2 * mapping for evaluation of liver fibrosis: An ex vivo feasibility study
Abstract
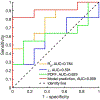
To develop a method for noninvasive evaluation of liver fibrosis, we investigated the differential sensitivities of quantitative susceptibility mapping (QSM) and R2 * mapping using corrections for the effects of liver iron. Liver fibrosis is characterized by excessive accumulation of collagen and other extracellular matrix proteins. While collagen increases R2 * relaxation, measures of R2 * for fibrosis are confounded by liver iron, which may be present in the liver over a wide range of concentrations. The diamagnetic collagen contribution to susceptibility values measured by QSM is much less than the contribution of highly paramagnetic iron. In 19 ex vivo liver explants with and without fibrosis, QSM (χ), R2 * and proton density fat fraction (PDFF) maps were constructed from multiecho gradient-recalled echo (mGRE) sequence acquisition at 3 T. Median parameter values were recorded and differences between the MRI parameters in nonfibrotic vs. advanced fibrotic/cirrhotic samples were evaluated using Mann-Whitney U tests and receiver operating characteristic analyses. Logistic regression with stepwise feature selection was employed to evaluate the utility of combined MRI measurements for detection of fibrosis. Median R2 * increased in fibrotic vs. nonfibrotic liver samples (P = .041), while differences in χ and PDFF were nonsignificant (P = .545 and P = .395, respectively). Logistic regression identified the combination of χ and R2 * significant for fibrosis detection (logit [prediction] = -8.45 + 0.23 R2 * - 28.8 χ). For this classifier, a highly significant difference between nonfibrotic vs. advanced fibrotic/cirrhotic samples was observed (P = .002). The model exhibited an AUC of 0.909 (P = .003) for detection of advanced fibrosis/cirrhosis, which was substantially higher compared with AUCs of the individual parameters (AUC 0.591-0.784). An integrated QSM and R2 * analysis of mGRE 3 T imaging data is promising for noninvasive diagnostic assessment of liver fibrosis.
Keywords: liver fibrosis; magnetic resonance imaging; quantitative susceptibility mapping.
© 2020 John Wiley & Sons, Ltd.
Figures


Similar articles
-
Quantitative Susceptibility Mapping versus R2*-based Histogram Analysis for Evaluating Liver Fibrosis: Preliminary Results.Magn Reson Med Sci. 2022 Oct 1;21(4):609-622. doi: 10.2463/mrms.mp.2020-0175. Epub 2021 Nov 11. Magn Reson Med Sci. 2022. PMID: 34483224 Free PMC article.
-
Quantitative susceptibility mapping (QSM) minimizes interference from cellular pathology in R2* estimation of liver iron concentration.J Magn Reson Imaging. 2018 Oct;48(4):1069-1079. doi: 10.1002/jmri.26019. Epub 2018 Mar 22. J Magn Reson Imaging. 2018. PMID: 29566449 Free PMC article.
-
Quantitative susceptibility mapping in combination with water-fat separation for simultaneous liver iron and fat fraction quantification.Eur Radiol. 2018 Aug;28(8):3494-3504. doi: 10.1007/s00330-017-5263-4. Epub 2018 Feb 22. Eur Radiol. 2018. PMID: 29470640 Free PMC article.
-
Magnetic resonance quantitative susceptibility mapping in the evaluation of hepatic fibrosis in chronic liver disease: a feasibility study.Quant Imaging Med Surg. 2021 Apr;11(4):1170-1183. doi: 10.21037/qims-20-720. Quant Imaging Med Surg. 2021. PMID: 33816158 Free PMC article.
-
The Combination of MR Elastography and Proton Density Fat Fraction Improves Diagnosis of Nonalcoholic Steatohepatitis.J Magn Reson Imaging. 2022 Aug;56(2):368-379. doi: 10.1002/jmri.28040. Epub 2021 Dec 25. J Magn Reson Imaging. 2022. PMID: 34953171
Cited by
-
Quantitative Susceptibility Mapping versus R2*-based Histogram Analysis for Evaluating Liver Fibrosis: Preliminary Results.Magn Reson Med Sci. 2022 Oct 1;21(4):609-622. doi: 10.2463/mrms.mp.2020-0175. Epub 2021 Nov 11. Magn Reson Med Sci. 2022. PMID: 34483224 Free PMC article.
-
A dedicated phantom for exploring the interplay of fat and paramagnetic substances in quantitative susceptibility mapping.MAGMA. 2025 Jun 2. doi: 10.1007/s10334-025-01261-3. Online ahead of print. MAGMA. 2025. PMID: 40455356
-
Weizmannia coagulans BC99 Attenuates Oxidative Stress Induced by Acute Alcoholic Liver Injury via Nrf2/SKN-1 Pathway and Liver Metabolism Regulation.Antioxidants (Basel). 2025 Jan 20;14(1):117. doi: 10.3390/antiox14010117. Antioxidants (Basel). 2025. PMID: 39857451 Free PMC article.
-
QSM Throughout the Body.J Magn Reson Imaging. 2023 Jun;57(6):1621-1640. doi: 10.1002/jmri.28624. Epub 2023 Feb 7. J Magn Reson Imaging. 2023. PMID: 36748806 Free PMC article. Review.
-
Toward a realistic in silico abdominal phantom for QSM.Magn Reson Med. 2023 Jun;89(6):2402-2418. doi: 10.1002/mrm.29597. Epub 2023 Jan 25. Magn Reson Med. 2023. PMID: 36695213 Free PMC article.
References
-
- Friedman SL. Liver fibrosis -- from bench to bedside. Journal of hepatology. 2003;38 Suppl 1:S38–53. - PubMed
-
- Schuppan D, Ashfaq-Khan M, Yang AT, Kim YO. Liver fibrosis: Direct antifibrotic agents and targeted therapies. Matrix biology: journal of the International Society for Matrix Biology. 2018;68-69:435–451. - PubMed
-
- Everett RJ, Stirrat CG, Semple SI, Newby DE, Dweck MR, Mirsadraee S. Assessment of myocardial fibrosis with T1 mapping MRI. Clin Radiol. 2016;71 (8):768–778. - PubMed
-
- Allkemper T, Sagmeister F, Cicinnati V, et al. Evaluation of fibrotic liver disease with whole-liver Tiρ MR imaging: a feasibility study at 1.5 T. Radiology. 2014;271(2):408–415. - PubMed
Publication types
MeSH terms
Substances
Grants and funding
LinkOut - more resources
Full Text Sources
Medical

