A Nomogram Based on Aspartate Aminotransferase/Alanine Aminotransferase (AST/ALT) Ratio to Predict Prognosis After Surgery in Gastric Cancer Patients
- PMID: 32959672
- PMCID: PMC7513419
- DOI: 10.1177/1073274820954458
A Nomogram Based on Aspartate Aminotransferase/Alanine Aminotransferase (AST/ALT) Ratio to Predict Prognosis After Surgery in Gastric Cancer Patients
Abstract
Introduction: Using the TMN classification alone to predict survival in patients with gastric cancer has certain limitations, we conducted this study was to develop an effective nomogram based on aspartate aminotransferase/alanine aminotransferase (AST/ALT) ratio to predict overall survival (OS) in surgically treated gastric cancer.
Methods: we retrospectively analyzed 190 cases of gastric cancer and used Cox regression analysis to identify the significant prognostic factors for OS in patients with resectable gastric cancer. The predictive accuracy of nomogram was assessed using a calibration plot, concordance index (C-index) and decision curve. This was then compared with a traditional TNM staging system. Based on the total points (TPS) by nomogram, we further divided patients into different risk groups.
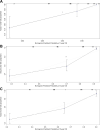
Results: multivariate analysis of the entire cohort revealed that independent risk factors for survival were age, clinical stage and AST/ALT ratio, which were entered then into the nomogram. The calibration curve for the probability of OS showed that the nomogram-based predictions were in good agreement with actual observations. Additionally, the C-index of the established nomogram for predicting OS had a superior discrimination power compared to the TNM staging system [0.794 (95% CI: 0.749-0.839) vs 0.730 (95% CI: 0.688-0.772), p < 0.05]. Decision curve also demonstrated that the nomogram was better than the TNM staging system. Based on TPS of the nomogram, we further subdivided the study cohort into 3 groups including low risk (TPS ≤ 158), middle risk (158 < TPS ≤ 188) and high risk (TPS > 188) categories. The differences in OS rate were significant among the groups.
Conclusion: the established nomogram is associated with a more accurate prognostic prediction for individual patients with resectable gastric cancer.
Keywords: AST/ALT ratio; classifier; gastric cancer; nomogram; prognosis.
Conflict of interest statement
Figures


Similar articles
-
Prognostic nomogram for patients with Nasopharyngeal Carcinoma incorporating hematological biomarkers and clinical characteristics.Int J Biol Sci. 2018 Apr 5;14(5):549-556. doi: 10.7150/ijbs.24374. eCollection 2018. Int J Biol Sci. 2018. PMID: 29805306 Free PMC article.
-
Elevated Preoperative Serum Alanine Aminotransferase/Aspartate Aminotransferase (ALT/AST) Ratio Is Associated with Better Prognosis in Patients Undergoing Curative Treatment for Gastric Adenocarcinoma.Int J Mol Sci. 2016 Jun 9;17(6):911. doi: 10.3390/ijms17060911. Int J Mol Sci. 2016. PMID: 27294917 Free PMC article.
-
The log odds of negative lymph nodes/T stage: a new prognostic and predictive tool for resected gastric cancer patients.J Cancer Res Clin Oncol. 2021 Aug;147(8):2259-2269. doi: 10.1007/s00432-021-03654-y. Epub 2021 May 18. J Cancer Res Clin Oncol. 2021. PMID: 34003367 Free PMC article.
-
[Effect of preoperative serum alanine aminotransferase and asparagine aminotransferase ratio on prognosis of patients with gastric cancer].Zhonghua Wei Chang Wai Ke Za Zhi. 2020 Jan 25;23(1):65-70. doi: 10.3760/cma.j.issn.1671-0274.2020.01.011. Zhonghua Wei Chang Wai Ke Za Zhi. 2020. PMID: 31958933 Chinese.
-
Application and progress of nomograms in gastric cancer.Front Med (Lausanne). 2025 Jan 29;12:1510742. doi: 10.3389/fmed.2025.1510742. eCollection 2025. Front Med (Lausanne). 2025. PMID: 39944483 Free PMC article. Review.
Cited by
-
Association between aspartate aminotransferase to alanine aminotransferase ratio and the risk of diabetes in Chinese prediabetic population: A retrospective cohort study.Front Public Health. 2023 Jan 4;10:1045141. doi: 10.3389/fpubh.2022.1045141. eCollection 2022. Front Public Health. 2023. PMID: 36684872 Free PMC article.
-
A Prognostic Nomogram and Heat Map to Predict Survival in Stage II/III Gastric Cancer Patients After Curative Gastrectomy Followed by Adjuvant Chemotherapy.Cancer Manag Res. 2022 Jan 25;14:287-301. doi: 10.2147/CMAR.S348890. eCollection 2022. Cancer Manag Res. 2022. PMID: 35115828 Free PMC article.
-
A New Nomogram for Predicting 30-Day In-Hospital Mortality Rate of Acute Cholangitis Patients in the Intensive Care Unit.Emerg Med Int. 2023 Aug 10;2023:9961438. doi: 10.1155/2023/9961438. eCollection 2023. Emerg Med Int. 2023. PMID: 37599814 Free PMC article.
-
Risk factors for liver dysfunction and their clinical importance after gastric cancer surgery.Sci Rep. 2024 Apr 6;14(1):8076. doi: 10.1038/s41598-024-58644-0. Sci Rep. 2024. PMID: 38580718 Free PMC article.
-
Association between De-Ritis ratio (AST/ALT) and mortality in patients with chronic kidney disease: a retrospective cohort study.Sci Rep. 2025 Mar 20;15(1):9649. doi: 10.1038/s41598-025-93184-1. Sci Rep. 2025. PMID: 40113904 Free PMC article.
References
-
- Siegel RL, Miller KD, Jemal A. Cancer statistics, 2016. CA Cancer J Clin. 2016;66(1):7–30. - PubMed
-
- Noh SH, Park SR, Yang HK, et al. Adjuvant capecitabine plus oxaliplatin for gastric cancer after D2 gastrectomy (CLASSIC): 5-year follow-up of an open-label, randomised phase 3 trial. Lancet Oncol. 2014;15(12):1389–1396. - PubMed
-
- Sasako M, Sakuramoto S, Katai H, et al. Five-year outcomes of a randomized phase III trial comparing adjuvant chemotherapy with S-1 versus surgery alone in stage II or III gastric cancer. J Clin Oncol. 2011;29(33):4387–4393. - PubMed
MeSH terms
Substances
LinkOut - more resources
Full Text Sources
Medical

