Spectral clustering of risk score trajectories stratifies sepsis patients by clinical outcome and interventions received
- PMID: 32959779
- PMCID: PMC7508552
- DOI: 10.7554/eLife.58142
Spectral clustering of risk score trajectories stratifies sepsis patients by clinical outcome and interventions received
Abstract
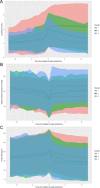
Sepsis is not a monolithic disease, but a loose collection of symptoms with diverse outcomes. Thus, stratification and subtyping of sepsis patients is of great importance. We examine the temporal evolution of patient state using our previously-published method for computing risk of transition from sepsis into septic shock. Risk trajectories diverge into four clusters following early prediction of septic shock, stratifying by outcome: the highest-risk and lowest-risk groups have a 76.5% and 10.4% prevalence of septic shock, and 43% and 18% mortality, respectively. These clusters differ also in treatments received and median time to shock onset. Analyses reveal the existence of a rapid (30-60 min) transition in risk at the time of threshold crossing. We hypothesize that this transition occurs as a result of the failure of compensatory biological systems to cope with infection, resulting in a bifurcation of low to high risk. Such a collapse, we believe, represents the true onset of septic shock. Thus, this rapid elevation in risk represents a potential new data-driven definition of septic shock.
Keywords: computational biology; none; sepsis; septic shock; stratification; systems biology.
© 2020, Liu et al.
Conflict of interest statement
RL, JG, JF, MB, RW No competing interests declared
Figures


Similar articles
-
Prediction of Impending Septic Shock in Children With Sepsis.Crit Care Explor. 2021 Jun 15;3(6):e0442. doi: 10.1097/CCE.0000000000000442. eCollection 2021 Jun. Crit Care Explor. 2021. PMID: 34151278 Free PMC article.
-
Resuscitation bundle compliance in severe sepsis and septic shock: improves survival, is better late than never.J Intensive Care Med. 2011 Sep-Oct;26(5):304-13. doi: 10.1177/0885066610392499. Epub 2011 Jan 10. J Intensive Care Med. 2011. PMID: 21220270
-
Early identification and management of patients with severe sepsis and septic shock in the emergency department.Emerg Med Clin North Am. 2014 Nov;32(4):759-76. doi: 10.1016/j.emc.2014.07.002. Epub 2014 Sep 3. Emerg Med Clin North Am. 2014. PMID: 25441033
-
Clinical outcome after a totally implantable venous access port-related infection in cancer patients: a prospective study and review of the literature.Medicine (Baltimore). 2012 Nov;91(6):309-318. doi: 10.1097/MD.0b013e318275ffe1. Medicine (Baltimore). 2012. PMID: 23117849 Review.
-
The Effect of Early Goal-Directed Therapy on Outcome in Adult Severe Sepsis and Septic Shock Patients: A Meta-Analysis of Randomized Clinical Trials.Anesth Analg. 2016 Aug;123(2):371-81. doi: 10.1213/ANE.0000000000001278. Anesth Analg. 2016. PMID: 27049857 Free PMC article. Review.
Cited by
-
Individualized resuscitation strategy for septic shock formalized by finite mixture modeling and dynamic treatment regimen.Crit Care. 2021 Jul 12;25(1):243. doi: 10.1186/s13054-021-03682-7. Crit Care. 2021. PMID: 34253228 Free PMC article.
-
Targeting the host response in sepsis: current approaches and future evidence.Crit Care. 2023 Dec 6;27(1):478. doi: 10.1186/s13054-023-04762-6. Crit Care. 2023. PMID: 38057824 Free PMC article. Review.
-
Cluster analysis driven by unsupervised latent feature learning of medications to identify novel pharmacophenotypes of critically ill patients.Sci Rep. 2023 Sep 20;13(1):15562. doi: 10.1038/s41598-023-42657-2. Sci Rep. 2023. PMID: 37730817 Free PMC article.
-
A common data model for the standardization of intensive care unit medication features.JAMIA Open. 2024 May 2;7(2):ooae033. doi: 10.1093/jamiaopen/ooae033. eCollection 2024 Jul. JAMIA Open. 2024. PMID: 38699649 Free PMC article.
-
Pharmacophenotype identification of intensive care unit medications using unsupervised cluster analysis of the ICURx common data model.Crit Care. 2023 May 2;27(1):167. doi: 10.1186/s13054-023-04437-2. Crit Care. 2023. PMID: 37131200 Free PMC article.
References
Publication types
MeSH terms
Grants and funding
LinkOut - more resources
Full Text Sources
Medical

