Nervonic acid limits weight gain in a mouse model of diet-induced obesity
- PMID: 32959931
- PMCID: PMC8183615
- DOI: 10.1096/fj.202000525R
Nervonic acid limits weight gain in a mouse model of diet-induced obesity
Abstract
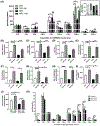
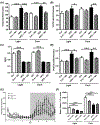
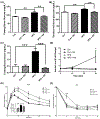
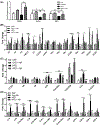
Lipid perturbations contribute to detrimental outcomes in obesity. We previously demonstrated that nervonic acid, a C24:1 ω-9 fatty acid, predominantly acylated to sphingolipids, including ceramides, are selectively reduced in a mouse model of obesity. It is currently unknown if deficiency of nervonic acid-sphingolipid metabolites contribute to complications of obesity. Mice were fed a standard diet, a high fat diet, or these diets supplemented isocalorically with nervonic acid. The primary objective was to determine if dietary nervonic acid content alters the metabolic phenotype in mice fed a high fat diet. Furthermore, we investigated if nervonic acid alters markers of impaired fatty acid oxidation in the liver. We observed that a nervonic acid-enriched isocaloric diet reduced weight gain and adiposity in mice fed a high fat diet. The nervonic acid enrichment led to increased C24:1-ceramides and improved several metabolic parameters including blood glucose levels, and insulin and glucose tolerance. Mechanistically, nervonic acid supplementation increased PPARα and PGC1α expression and improved the acylcarnitine profile in liver. These alterations indicate improved energy metabolism through increased β-oxidation of fatty acids. Taken together, increasing dietary nervonic acid improves metabolic parameters in mice fed a high fat diet. Strategies that prevent deficiency of, or restore, nervonic acid may represent an effective strategy to treat obesity and obesity-related complications.
Keywords: ceramide; fatty acid oxidation; obesity; omega-9; sphingolipids.
© 2020 Federation of American Societies for Experimental Biology.
Conflict of interest statement
CONFLICT OF INTEREST
The authors declare no conflict of interest.
Figures


Similar articles
-
The role of C16:0 ceramide in the development of obesity and type 2 diabetes: CerS6 inhibition as a novel therapeutic approach.Mol Metab. 2019 Mar;21:36-50. doi: 10.1016/j.molmet.2018.12.008. Epub 2019 Jan 2. Mol Metab. 2019. PMID: 30655217 Free PMC article.
-
Supplementation of a high-fat diet with chlorogenic acid is associated with insulin resistance and hepatic lipid accumulation in mice.J Agric Food Chem. 2013 May 8;61(18):4371-8. doi: 10.1021/jf400920x. Epub 2013 Apr 26. J Agric Food Chem. 2013. PMID: 23586419
-
Agaricus bisporus supplementation reduces high-fat diet-induced body weight gain and fatty liver development.J Physiol Biochem. 2018 Nov;74(4):635-646. doi: 10.1007/s13105-018-0649-6. Epub 2018 Oct 4. J Physiol Biochem. 2018. PMID: 30288689
-
Nervonic acid and its sphingolipids: Biological functions and potential food applications.Crit Rev Food Sci Nutr. 2024;64(24):8766-8785. doi: 10.1080/10408398.2023.2203753. Epub 2023 Apr 28. Crit Rev Food Sci Nutr. 2024. PMID: 37114919 Review.
-
Cancer depends on fatty acids for ATP production: A possible link between cancer and obesity.Semin Cancer Biol. 2022 Nov;86(Pt 2):347-357. doi: 10.1016/j.semcancer.2022.07.005. Epub 2022 Jul 19. Semin Cancer Biol. 2022. PMID: 35868515 Review.
Cited by
-
Flammulina velutipes Mycorrhizae Attenuate High Fat Diet-Induced Lipid Disorder, Oxidative Stress and Inflammation in the Liver and Perirenal Adipose Tissue of Mice.Nutrients. 2022 Sep 16;14(18):3830. doi: 10.3390/nu14183830. Nutrients. 2022. PMID: 36145203 Free PMC article.
-
A Review of Nervonic Acid Production in Plants: Prospects for the Genetic Engineering of High Nervonic Acid Cultivars Plants.Front Plant Sci. 2021 Mar 5;12:626625. doi: 10.3389/fpls.2021.626625. eCollection 2021. Front Plant Sci. 2021. PMID: 33747006 Free PMC article. Review.
-
Metabolomics Analysis on Obesity-Related Obstructive Sleep Apnea After Weight Loss Management: A Preliminary Study.Front Endocrinol (Lausanne). 2022 Jan 3;12:761547. doi: 10.3389/fendo.2021.761547. eCollection 2021. Front Endocrinol (Lausanne). 2022. PMID: 35046891 Free PMC article.
-
High-level production of nervonic acid in the oleaginous yeast Yarrowia lipolytica by systematic metabolic engineering.Commun Biol. 2023 Nov 7;6(1):1125. doi: 10.1038/s42003-023-05502-w. Commun Biol. 2023. PMID: 37935958 Free PMC article.
-
Contribution of specific ceramides to obesity-associated metabolic diseases.Cell Mol Life Sci. 2022 Jul 5;79(8):395. doi: 10.1007/s00018-022-04401-3. Cell Mol Life Sci. 2022. PMID: 35789435 Free PMC article. Review.
References
-
- Hammad SS, Jones PJ. Dietary fatty acid composition modulates obesity and interacts with obesity-related genes. Lipids. 2017;52:803–822. - PubMed
-
- Palomer X, Pizarro-Delgado J, Barroso E, Vazquez-Carrera M. Palmitic and oleic acid: the Yin and Yang of fatty acids in type 2 diabetes mellitus. TEM. 2018;29:178–190. - PubMed
-
- Meikle PJ, Summers SA. Sphingolipids and phospholipids in insulin resistance and related metabolic disorders. Nature Rev Endocrinol. 2017;13:79–91. - PubMed
Publication types
MeSH terms
Substances
Grants and funding
LinkOut - more resources
Full Text Sources
Medical

