. 2020 Oct 9;48(18):10428-10440.
doi: 10.1093/nar/gkaa771.

Influenza A virus co-opts ERI1 exonuclease bound to histone mRNA to promote viral transcription

Affiliations

Influenza A virus co-opts ERI1 exonuclease bound to histone mRNA to promote viral transcription

Marion Declercq et al. Nucleic Acids Res. .

Abstract

Cellular exonucleases involved in the processes that regulate RNA stability and quality control have been shown to restrict or to promote the multiplication cycle of numerous RNA viruses. Influenza A viruses are major human pathogens that are responsible for seasonal epidemics, but the interplay between viral proteins and cellular exonucleases has never been specifically studied. Here, using a stringent interactomics screening strategy and an siRNA-silencing approach, we identified eight cellular factors among a set of 75 cellular proteins carrying exo(ribo)nuclease activities or involved in RNA decay processes that support influenza A virus multiplication. We show that the exoribonuclease ERI1 interacts with the PB2, PB1 and NP components of the viral ribonucleoproteins and is required for viral mRNA transcription. More specifically, we demonstrate that the protein-protein interaction is RNA dependent and that both the RNA binding and exonuclease activities of ERI1 are required to promote influenza A virus transcription. Finally, we provide evidence that during infection, the SLBP protein and histone mRNAs co-purify with vRNPs alongside ERI1, indicating that ERI1 is most probably recruited when it is present in the histone pre-mRNA processing complex in the nucleus.


Figures

Figure 1.
Figure 1.
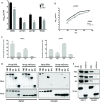
Systematic screening of the ExoRDec library. (A) Interaction network of validated PPIs after NLR retesting. Viral proteins are indicated in black circles, factors of the ExoRDec library in grey boxes. Redundant targeting (i.e. cellular protein targeted by three or more viral proteins) is depicted with blue boxes. Edges that were only found with viral protein of pH1N1 are indicated with dashed lines. (B) KEGG pathways enrichment analysis. The ExoRDec library and associated proteome was divided in two clusters, i.e. non-targeted (−) and targeted (+) by viral proteins. Each bar corresponds to a KEGG pathway found to be statistically significant (P-value < 0.05) in each cluster. The length of the bar represents the proportion of genes belonging to the pathway that are present in the cluster with respect to the whole pathway. The number associated to each bar corresponds to the total number of genes present in the cluster for the given pathway. Enrichment analysis was carried out using the ClueGO plug-in of Cytoscape as described in the methods section.
Figure 2.
Figure 2.
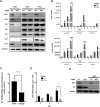
IAV multiplication is impaired in ERI1-depleted cells and ERI1 interacts with viral proteins. (A, B) A549 cells were treated with control (black) or single ERI1 siRNA (gray, ERI1#1) and infected with the following viruses at the indicated moi in pfu/cell: A/WSN/33(H1N1) (WSN, moi 10−4); A/Paris/650/2004(H1N1) (sH1N1, moi 10−3); A/Bretagne/7608/2009(H1N1pdm09) (pH1N1, moi 10−4), A/Centre/1003/2012(H3N2) (H3N2, moi 10−3). At 24 hpi (A), or at several time points post-infection (18, 24, 36, 48, 72 hpi) (B), viral titers were determined by plaque assay on MDCK-SIAT cells. The results are expressed as the mean ± SEM of triplicates and the significance was tested with a multiple t test, using the Holm-Sidak method, in GraphPad Prism software (*P < 0.05, **P < 0.01, ***P < 0.001). (C) Interaction of ERI1 with sH1N1 and pH1N1 viral proteins was tested by applying the NLR (normalized luminescence ratio) method that takes into account the background noise of interaction of the Gluc1 or Gluc2 fusion partners. Positive threshold values, calculated as in (38), are represented by hatched bars. The results are expressed as the mean ± SEM of triplicates. (D) HEK-293T cells were co-transfected with Strep-ERI1 or Strep-mCherry (as a control), and Gluc1-PB2-WSN, -PB1-WSN, -PA-WSN, -NP-WSN or –M1-WSN. At 24 hpt, Strep tagged proteins were purified with sepharose Strep-Tactin beads. PA, found as a non-interacting partner of ERI1 in our GPCA screen was used as a control of non-specific interaction. Strep-tagged eluates were analyzed by immunoblot to detect Strep and Gluc1 tagged proteins. Results representative of three independent experiments are shown. (E) HEK-293T cells were co-transfected with Strep-ERI1 or Strep-mCherry (as a control) along with untagged PB2, PB1 and PA. At 24 hpt, Strep tagged proteins were purified with sepharose Strep-Tactin beads. Strep-tagged eluates were analyzed by immunoblot to detect Strep and the viral proteins. Results representative of three independent experiments are shown.
Figure 3.
Figure 3.
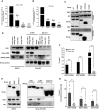
ERI1 silencing alters viral life cycle. (A) A549 cells were treated with non-targeting (NT) or ERI1 siRNAs and infected 48hpt with WSN at an moi of 3 pfu/cell. Total cell extracts were prepared at the indicated times post-infection and analyzed by immunoblot using antibodies directed against the indicated proteins. Results representative of three independent experiments are shown. (B, D, E) A549 cells treated with non-targeting (NT, black bars) or ERI1 (gray bars) siRNAs were infected with WSN at an moi of 3 pfu/cell in the absence (B) or presence (D, E) of cycloheximide (CHX) (100μg/ml) that blocks translation. Total RNAs were extracted at the indicated time points post infection and the levels of NP or NA mRNAs, vRNAs and cRNAs were determined by strand specific RT-qPCRs. The results are expressed as the mean ± SEM determined in three independent experiments. The significance was tested by two-way ANOVA with Sidak's multiple correction test in GraphPad Prism Software (****P < 0.0001; *P < 0.05). (C) HEK-293T cells were transfected with Strep-ERI1 or Strep-empty (as a control) and infected with WSN at an moi of 3 pfu/cell. At 3 hpi total RNAs were extracted and the levels of NP mRNAs and vRNAs were determined by strand specific RT-qPCRs. The results are expressed as the mean ratios of mRNA/vRNA ± SEM normalized to empty control, determined in three independent experiments. The significance was tested with an unpaired t-test using GraphPad Prism Software (*P < 0.05). (E) Total extracts from infected cells treated with non-targeting (NT) or ERI1 siRNAs, and treated with CHX or not, were prepared at 6hpi and analyzed by immunoblot using antibodies directed against the indicated proteins. No viral protein was detectable at 6hpi upon CHX treatment demonstrating that CHX effectively blocked de novo translation.
Figure 4.
Figure 4.
RNA binding and exonuclease activities of ERI1 are both required for IAV cycle. (A) Schematic organization of ERI1. The N-terminal part contains the ‘SAF-box, Acinus and PIAS’ (SAP) domain while the C-terminal part carries the exonuclease activity. (B, C) HEK-293T cells were transfected with Strep-ERI1, Strep-ERI1 mutants (R105A, ΔSAP, D134A+E136A, i.e. ‘no DE’) or Strep-mCherry (as a control) and infected with WSN at an moi of 3 pfu/cell. At 3hpi total RNAs were extracted and the levels of NP mRNAs and vRNAs were determined by strand specific RT-qPCRs (B), or analyzed by immunoblot to assess protein expression levels (C). The results are expressed as the mean ratios of mRNA/vRNA ± SEM normalized to empty control, in three independent experiments. The significance was tested by one-way ANOVA with Holm-Sidak's multiple comparisons test using GraphPad Prism Software ****P < 0.0001). (D, E) HEK-293T cells were infected with WSN at an moi of 3 pfu/cell. At 3 hpi, ERI1 protein (D) or at 6 hpi, PB2 protein (E) was purified using anti-ERI1 antibodies (α-ERI1) (D) or anti-PB2 antibodies (α-PB2) (E) or control immunoglobulins (Ctrl IgG). Inputs and α-ERI1, α-PB2 and Ctrl IgG eluates were analyzed by immunoblot to detect ERI1, PB2 and/or NP. Results representative of two (D) and three (E) independent experiments are shown. (F) HEK-293T cells were transfected with Strep-ERI1 or Step-mCherry and infected 24hpt with WSN at an moi of 3 pfu/cell. At 6hpi, Strep-tagged proteins were purified with sepharose Strep-Tactin beads. Inputs and strep eluates were analyzed by immunoblot to detect PB2, PB1, PA and Strep. Results representative of three independent experiments are shown. (G) HEK-293T cells were transfected with Strep-ERI1 or Strep-empty and infected with WSN (3 pfu/cell). At 6hpi, Strep-tagged proteins were purified with sepharose Strep-Tactin beads. Complexes bound to the beads were incubated with RNase A (+ RNase) or Rnasin (– RNase) for 1 h. Inputs and Strep-tagged eluates were analyzed by immunoblot to detect ERI1, PB2 and NP. Results representative of three independent experiments are shown. (H) The levels of NP vRNAs (black bars) and mRNAs (grey bars) co-purified with Strep-ERI1 as described in (B) are expressed as the mean ± SEM of three independent experiments. The background level of detection in Strep-empty eluates was 9.9 × 10² and 6 × 10³ copies for NP vRNAs and NP mRNAs, respectively. (I) Viral RNAs co-purified with Strep-ERI1 and Strep-empty (as a control) were expressed as a ratio of the viral RNA quantified in the input. Significance was tested by two-way ANOVA with Sidak's multiple comparisons test using GraphPad Prism Software ****P < 0.0001).
Figure 5.
Figure 5.
ERI1 is co-purified with histone mRNA and SLBP in infected cells. (A–C) HEK-293T cells were transfected with Strep-ERI1 wild-type (wt), Strep-ERI1 R105A mutant, Strep-ERI1 ΔSAP mutant or with Strep-mCherry or Strep-empty (as a control), and infected with WSN (3pfu/cell). At 6hpi, Strep-tagged proteins were purified with sepharose Strep-Tactin beads. The levels of HIST1H2AB mRNA (A) and NP mRNAs (B) co-purified with Strep-pulled proteins are expressed as the mean ± SEM of three independent experiments. Statistical significance was assessed by one-way ANOVA test with Dunnett's multiple comparison test (****P < 0.0001). (C) Inputs and Strep-pulled eluates were analyzed by immunoblot with the indicated antibodies. (D) HEK-293T cells were co-transfected with Strep-ERI1 and 3XFlag-SLBP, or transfected with either Strep-ERI1 or 3XFlag-SLBP, and infected with WSN (moi = 3 pfu/cell). At 6 hpi, PB2 proteins were purified using anti PB2 antibodies (or control immunoglobulins IgG ctrl). Inputs and eluates were analyzed by immunoblot using Strep-Tactin or antibodies directed against 3X-Flag or PB2 to respectively detect Strep-ERI1, 3XFlag-SLBP and PB2. (E) HEK-293T cells were transfected with Strep-ERI1, Strep-SLBP or Strep-mCherry and infected with WSN (moi = 3pfu/cell). At 6hpi, Strep tagged proteins were purified with sepharose Strep-Tactin beads. Complexes bound to the beads were incubated with RNase A (+) or Rnasin (−) for 1h. Inputs and eluates were analyzed by immunoblot to detect Strep, PB2 and NP. Results representative of three independent experiments are shown. (F) HEK-293T cells were infected with WSN at an moi of 3 pfu/cell. At 6hpi, PB2 proteins were purified using anti-PB2 antibodies. Levels of HIST1H2AB, HIST1H2BG and HIST1H3B mRNA co-purified with PB2 (black) or with control IgG (gray) were quantified using RT-qPCRs. The results are expressed as the mean ± SEM of triplicates and the significance was tested with a multiple t test, using the Holm-Sidak method, in GraphPad Prism software (*** P < 0.001, **** P < 0.0001). (G) HEK-293T cells were treated with NT (dark grey) or ERI1 (light gray) siRNAs. At 48hpt, cells were infected with WSN (moi = 3 pfu/cell). At 6hpi, PB2 proteins were purified using anti-PB2 antibodies. Levels of HIST1H2AB, HIST1H2BG and HIST1H3B mRNA co-purified with PB2 in NT and ERI1 siRNA treated cells were quantified using RT-qPCRs. The results are expressed as the mean ± SEM of triplicates.

Similar articles

Cited by

References

    1. Łabno A., Tomecki R., Dziembowski A.. Cytoplasmic RNA decay pathways - enzymes and mechanisms. Biochim. Biophys. Acta - Mol. Cell Res. 2016; 1863:3125–3147. - PubMed
    1. Mugridge J.S., Coller J., Gross J.D.. Structural and molecular mechanisms for the control of eukaryotic 5′–3′ mRNA decay. Nat. Struct. Mol. Biol. 2018; 25:1077–1085. - PubMed
    1. Gaglia M.M., Glaunsinger B.A.. Viruses and the cellular RNA decay machinery. Wiley Interdiscip. Rev. RNA. 2010; 1:47–59. - PMC - PubMed
    1. Molleston J.M., Cherry S.. Attacked from all Sides: RNA decay in antiviral defense. Viruses. 2017; 9:2. - PMC - PubMed
    1. Abernathy E., Glaunsinger B.. Emerging roles for RNA degradation in viral replication and antiviral defense. Virology. 2015; 479–480:600–608. - PMC - PubMed

Publication types

MeSH terms