

Patient Trajectories Among Persons Hospitalized for COVID-19 : A Cohort Study
- PMID: 32960645
- PMCID: PMC7530643
- DOI: 10.7326/M20-3905
Patient Trajectories Among Persons Hospitalized for COVID-19 : A Cohort Study
Erratum in
-
Correction: Patient Trajectories Among Persons Hospitalized for COVID-19.Ann Intern Med. 2021 Jan;174(1):144. doi: 10.7326/L20-1322. Epub 2020 Nov 10. Ann Intern Med. 2021. PMID: 33166225 No abstract available.
Abstract
Background: Risk factors for progression of coronavirus disease 2019 (COVID-19) to severe disease or death are underexplored in U.S. cohorts.
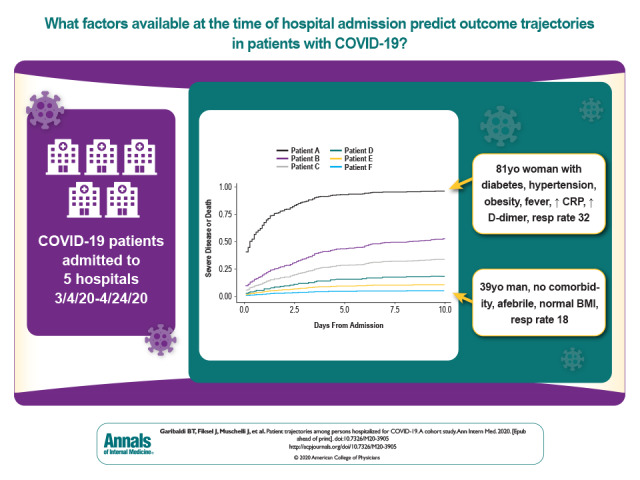
Objective: To determine the factors on hospital admission that are predictive of severe disease or death from COVID-19.
Design: Retrospective cohort analysis.
Setting: Five hospitals in the Maryland and Washington, DC, area.
Patients: 832 consecutive COVID-19 admissions from 4 March to 24 April 2020, with follow-up through 27 June 2020.
Measurements: Patient trajectories and outcomes, categorized by using the World Health Organization COVID-19 disease severity scale. Primary outcomes were death and a composite of severe disease or death.
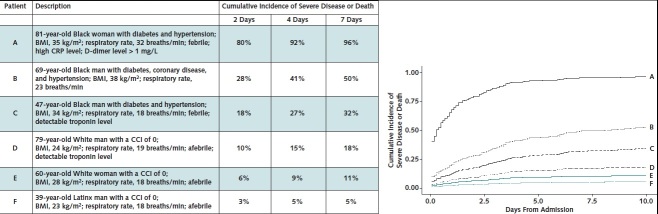
Results: Median patient age was 64 years (range, 1 to 108 years); 47% were women, 40% were Black, 16% were Latinx, and 21% were nursing home residents. Among all patients, 131 (16%) died and 694 (83%) were discharged (523 [63%] had mild to moderate disease and 171 [20%] had severe disease). Of deaths, 66 (50%) were nursing home residents. Of 787 patients admitted with mild to moderate disease, 302 (38%) progressed to severe disease or death: 181 (60%) by day 2 and 238 (79%) by day 4. Patients had markedly different probabilities of disease progression on the basis of age, nursing home residence, comorbid conditions, obesity, respiratory symptoms, respiratory rate, fever, absolute lymphocyte count, hypoalbuminemia, troponin level, and C-reactive protein level and the interactions among these factors. Using only factors present on admission, a model to predict in-hospital disease progression had an area under the curve of 0.85, 0.79, and 0.79 at days 2, 4, and 7, respectively.
Limitation: The study was done in a single health care system.
Conclusion: A combination of demographic and clinical variables is strongly associated with severe COVID-19 disease or death and their early onset. The COVID-19 Inpatient Risk Calculator (CIRC), using factors present on admission, can inform clinical and resource allocation decisions.
Primary funding source: Hopkins inHealth and COVID-19 Administrative Supplement for the HHS Region 3 Treatment Center from the Office of the Assistant Secretary for Preparedness and Response.
Conflict of interest statement
Figures
References
-
- Center for Systems Science and Engineering, Johns Hopkins University. COVID-19 Dashboard by the Center for Systems Science and Engineering (CSSE) at Johns Hopkins University (JHU). Accessed at https://coronavirus.jhu.edu/map.htmlon 1 September 2020.
-
- Richardson S, Hirsch JS, Narasimhan M, et al; the Northwell COVID-19 Research Consortium. Presenting characteristics, comorbidities, and outcomes among 5700 patients hospitalized with COVID-19 in the New York City area. JAMA. 2020;323:2052-2059. [PMID: 32320003] doi:10.1001/jama.2020.6775 - PMC - PubMed
-
- Onder G, Rezza G, Brusaferro S. Case-fatality rate and characteristics of patients dying in relation to COVID-19 in Italy. JAMA. 2020;323:1775-1776. [PMID: 32203977] doi:10.1001/jama.2020.4683 - PubMed
MeSH terms
Grants and funding
LinkOut - more resources
Full Text Sources
Other Literature Sources
Medical
Research Materials
Miscellaneous