. 2020 Dec;40(1_suppl):S117-S133.
doi: 10.1177/0271678X20953913. Epub 2020 Sep 22.

Longitudinal monitoring of microglial/macrophage activation in ischemic rat brain using Iba-1-specific nanoparticle-enhanced magnetic resonance imaging

Affiliations

Longitudinal monitoring of microglial/macrophage activation in ischemic rat brain using Iba-1-specific nanoparticle-enhanced magnetic resonance imaging

Laurel O Sillerud et al. J Cereb Blood Flow Metab. 2020 Dec.

Abstract

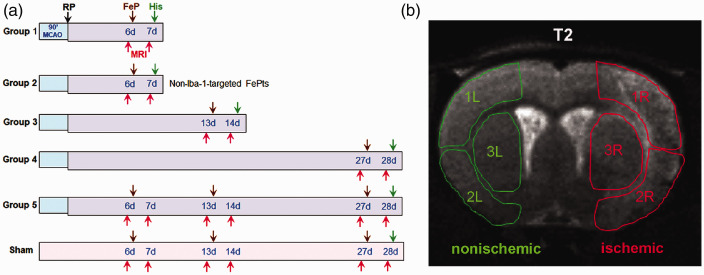
Microglial/macrophage activation plays a dual role in response to brain injury after a stroke, promoting early neuroinflammation and benefit for neurovascular recovery. Therefore, the dynamics of stroke-induced cerebral microglial/macrophage activation are of substantial interest. This study used novel anti-Iba-1-targeted superparamagnetic iron-platinum (FePt) nanoparticles in conjunction with magnetic resonance imaging (MRI) to measure the spatiotemporal changes of the microglial/macrophage activation in living rat brain for four weeks post-stroke. Ischemic lesion areas were identified and measured using T2-weighted MR images. After injection of the FePt-nanoparticles, T2*-weighted MR images showed that the nanoparticles were seen solely in brain regions that coincided with areas of active microglia/macrophages detected by post-mortem immunohistochemistry. Good agreement in morphological and distributive dynamic changes was also observed between the Fe+-cells and the Iba-1+-microglia/macrophages. The spatiotemporal changes of nanoparticle detected by T2*-weighted images paralleled the changes of microglial/macrophage activation and phenotypes measured by post-mortem immunohistochemistry over the four weeks post-stroke. Maximum microglial/macrophage activation occurred seven days post-stroke for both measures, and the diminished activation found after two weeks continued to four weeks. Our results suggest that nanoparticle-enhanced MRI may constitute a novel approach for monitoring the dynamic development of neuroinflammation in living animals during the progression and treatment of stroke.

Keywords: Iba-1-antibody-conjugated superparamagnetic iron–platinum nanoparticles; Ischemic stroke; magnetic resonance imaging; microglial/macrophage activation; neuroinflammation.


Conflict of interest statement

Declaration of conflicting interests: The author(s) declared no potential conflicts of interest with respect to the research, authorship, and/or publication of this article.

Figures

Figure 1.
Figure 1.
Summary of the rat experimental groups and regions of interest (ROI) used for MRI image intensity measurements. (a) An outline of the experimental protocol showing the timing of the MRI scans, the injections of the SM80s, and the post-mortem histological analysis at various reperfusion (RP) times after MCAO. Groups 1, 3, and 4 received one injection of Iba-1-targeted SM80s (Iba-1-SM80s) and one MRI scan at one, two, and four weeks, respectively. Group 5 received three injections of Iba-1-targeted SM80s and three MRI scans at one, two, and four weeks. Group 2 received one injection of non-Iba-1-targeted, control SM80s (SM80s) and one MRI scan at one week Sham rats received three injections of Iba-1-SM80s and three MRI scans at one, two, and four weeks. The time of various procedures is indicated as MCAO: a 90 min middle cerebral artery occlusion; RP (↓): the time at which reperfusion was begun. FePt (↓): nanoparticle injection time-point. MRI (↓): MRI scan time-point. His (↓): post-mortem histological analysis time-point. (b) A representative slice from T2-weighted image of a Group 1 rat brain taken seven days after MCAO/RP showing the ROIs used for the measurement of the signal intensities in the ipsilateral and contralateral portions of the brain. Within each hemisphere, three regions, including the cortex (1, 2) and striatum (3), were measured. MCAO was performed on the right hemisphere (R, ischemic), while the left hemisphere served as a nonischemic (L, nonischemic) control region. Note the hyperintensity of the right cortex compared with the left due to edema.
Figure 2.
Figure 2.
Active microglia shown by MRI and histological analysis in the brain of a rat (Group 1) at one week after MCAO/RP. (a) MR T2w and T2*w images taken before (pre-injection) of Iba1-SM80s. The anatomic T2w image shows the lesion as a right-sided hyperintense region. A T2*w gradient-recalled echo image of the same slice. (b) MR T2w and T2*w images taken 24 h post-injection (after-injection) of Iba1-SM80s. A T2w image of the brain of this rat showing the same right-sided hyperintense region. A T2*w image showing the location of the magnetic nanoparticles as punctate hypointensities. (c) Intensity profile of the T2*w MR image from (b) (right) taken along the indicated white line in the T2*w post-injection image. Note that the intensity is lower in the ischemic hemisphere (arrow) compared to the nonischemic one. (d) A post-mortem formalin-fixed brain slice from the same rat shows that the lesion area in the ischemic hemisphere (arrow) coincides with that seen in the T2w image in (a) (left). (e) A brain section immunofluorescently stained for Iba-1 (green) shows that the distribution of active microglia in the ischemic hemisphere of this brain matched the areas of hyperintensity seen in the T2w image (a) (left). (f) The distribution of Fe+-microglia determined using Perl’s Prussian Blue staining in the non-ischemic hemisphere and in the ischemic hemisphere of the same brain as in (a). Note that Fe+-microglia only appear in the brain tissue from the ischemic region. Scale bars = 100 µm. CTX: cortex; Str: striatum; V: vessel.
Figure 3.
Figure 3.
MR imaging and histological analysis show that Iba1-SM80s produce specific imaging changes compared with control, non-Iba1-targeted-SM80s (SM80s) in ischemic hemispheres at one week after MCAO/RP. (a) T2w and T2*w MR images of the brains from rats injected with either Iba1-SM80s (Group 1) or SM80s (Group 2). T2w images (top row) show that the spatial extant and size of the cortical and striatal edema in the infarcted regions was similar in both groups. The arrow indicates the ischemic hemisphere. The pre-injection T2*w MR images (middle row) show a smooth cortex and striatum. The post-injection T2*w MR images (bottom row) show the SM80s as punctate hypointense regions in only the image from the rat injected with Iba1-SM80s (bottom, left), while no such effect is seen when control SM80s were used (bottom, right). (b) The effect of magnetic nanoparticle injection on the quantitative contrast of the T2*w MR images in rat brains obtained pre- and after nanoparticle injections. The intensities of the three lesion regions of interest (in the ischemic hemisphere) and those of the three contralateral of interest (in the nonischemic hemisphere) (see Figure 1(b)) were measured and used to compute the Right (R)/Left (L) contrast as C = (Ri – Li)/Li, i ∈ {1,2,3}. This contrast decreased significantly (p = 0.001) after the injection of the Iba1-SM80s (b, left), while no significant contrast change was observed after the injection of the control SM80s (b, right; p = 0.16). (c) Contrast (Ca) of T2*w MR image obtained after injections with either Iba1-SM80s or SM80s. There was a significant difference (p = 0.02) in contrast obtained after injection of the Iba1-SM80s compared with the control SM80s. (d) Quantitative contrast changes (ΔC) between T2*w MR images obtained in rat brains before (Cp) and after-injection (Ca) with either Iba1-SM80s or control SM80s. Sham rats were injected with Iba1-SM80s and there was no contrast change, ΔC = 0.009. The brains from Group 1 rats injected with Iba1-SM80s showed a significantly different negative contrast change of ΔC = –0.087. Injection of control SM80s into rats produced only a slightly negative ΔC = –0.036. n = 6 rats in the sham group, n = 11 in the Iba1-SM80s group, and n = 10 in the control SM80s group. (e) Perl’s Prussian Blue staining for Fe+-microglial cells in the rat brains injected with control SM80s. No Fe+-cells were seen in the cortex (CTX), while only a few were observed in the area of the striatum (Str) in the ischemic hemisphere. Scale bars = 50 µm. **p < 0.01 vs. sham and SM80s groups. #p < 0.05 vs. sham group.
Figure 4.
Figure 4.
A comparison of MR images obtained after single vs. multiple injections of the Iba-1-SM80s shows that image intensity perturbations decay within a few days so that the nanoparticles did not accumulate in the brain tissue. (a) T2w and T2*w MR images of the sham rat brains obtained 24 h after the injection of Iba1-SM80s at one, two, and four weeks (W). These animals received three injections of Iba1-SM80s. (b) T2w and T2*w MR images of the brains of Group 5 rats obtained 24 h after the injection of Iba1-SM80s at one, two, and four weeks after MCAO/RP. These animals received three injections of Iba1-SM80s. Substantial punctate hypointensities in the T2*w images were found in the whole ischemic area at one week, which were also seen in the regions surrounding the core infarct areas (bright high intensity) at two and four weeks. (c) T2w and T2*w MR images obtained 24 h after-injection of Iba1-SM80s into rats at one week (Group 1), two weeks (Group 3), and four weeks (Group 4) after MCAO/RP. These animals received single injection of Iba1-SM80s at one, two, and four weeks, respectively. Here, the hypointensities in the T2*w images were similar to that observed in (b). (d) Perl’s Prussian Blue staining for Fe+-microglia in the sham or in the MCAO/RP rats from (a) and (b) at four weeks, after receiving three injections. Photos were taken from the cortex (CTX) and striatum (Str) areas shown as arrowheads in (a) and (b). Scale bars = 100 µm. Note the lack of significant blue staining in the tissue from sham rats, which is in contrast to the residual blue staining seen in the fourth week MCAP/RP group. (e) Quantitative contrast (Ca) in the T2w MR images of the rat brains taken 24 h after either single or multiple injections of Iba-1-SM80s at one, two, and four weeks after MCAO/RP. m: multiple-injection groups (sham group and Group 5); s: single-injection groups (Groups 1, 3, and 4). *p < 0.01 vs. 1-injection MCAO/RP groups at one week (1 W), ***p < 0.001 vs. 1-injection and 2-injecton MCAO/RP groups at two weeks (2 W), ****p < 0.0001 vs. 1-injection and 3-injection MCAO/RP groups at four weeks (4 W). (f) Comparison of the contrast changes (ΔC = Ca – Cp) of T2*w MR images between rats with three serial injections and rats with a single injection, at one, two, and four weeks after MCAO/RP. **p < 0.01 vs. 1-injection MCAO/RP group at one week, *p < 0.05 vs. 1-injection and 2-injecton MCAO/RP groups at two weeks. n = 6 in 3-injection sham group; n = 11, 9, and 10 in 1-injection MCAO/RP groups; n = 8 in 3-injection MCAO/RP group.
Figure 5.
Figure 5.
Longitudinal monitoring of microglial activation with T2w and T2*w MR imaging and immunohistochemistry. (a) The changes of the distribution of the hypointense regions in the T2*w images reflected the distribution of active microglia/macrophages by Iba-1 staining in the same ischemic hemispheres over four weeks after MCAO/RP. The left column of T2*w MR images shows the appearance of the rat brain 24 h after Iba-1-SM80 injections in sham rats and rats subjected to MCAO/RP for one, two, and four weeks. In the right column, the brains from the same animals were removed after MRI and stained for Iba-1 to reveal the location and density of activated microglia. (b) Iba-1 and Perl’s Prussian Blue staining on adjacent sections of each rat from (a). The changes of morphology and density of Fe+-cells in the ischemic hemispheres reflected the changes of active microglia/macrophages stained by Iba-1. Note that the marked right-sided edema-related hyperintensities in the T2*w images at two and four weeks were observed by histology as fluid-filled voids, due to cell death and tissue atrophy in the core infarcts. Scale bar = 50 µm. The inserts show higher magnification views of the microglia/macrophages stained for Iba-1 and Perl’s Prussian Blue. (c) The time dependence of the quantitative contrast (Ca) and contrast change (ΔC) in T2w MR images from sham or MCAO/RP rat brains following both single and three injections of Iba1-SM80s at weeks 1, 2, and 4 after MCAO/RP. Left: The T2w contrast after injection (Ca) in the MCAO/RP groups was significantly increased compared to the sham group at all time points due to edema formation. There was no significant difference of T2w Ca values between the Iba-1-SM80s rats and the control SM80s rats at one week. *p < 0.05 vs. 1 W/RP of rats with Iba1-SM80s or control SM80s; ****p < 0.0001 vs. 2 W and 4 W of sham rats. Right: The contrast change values (ΔC = Ca – Cp) showed no significant difference between the MCAO/RP groups and the sham rats at one, two, and four weeks, suggesting that the nanoparticle injection did not interfere the edema-related hyperintensities in T2w images. (d) The time dependence of the quantitative contrast (Ca) and the contrast changes (ΔC) in T2*w MR images obtained from sham or MCAO/RP rats following both single and three injections of Iba1-SM80s at weeks 1, 2, and 4 after MCAO/RP. Left: The quantitative contrast (Ca) measured in T2*w MR images was independent of time for the sham rats. A significant difference was seen in the 1 W/RP group injected with Iba1-SM80s compared to the sham, control SM80s, 2 and 4 weeks MCAO/RP groups. *p < 0.05 vs. 1 W of sham and 1 W/RP of control SM80s groups, ##p < 0.01 vs. 2 W/RP and 4 W/RP of rats with Iba1-SM80s. Injection of control SM80s at one week did not produce significant different contrast from the sham group. Right: The most significantly negative ΔC value was seen in the T2*w images at one week for the MCAO/RP rats injected with Iba1-SM80s; this value decreased at two and four weeks. ***p < 0.001 and **p < 0.01 vs. MCAO/RP groups at one week or two weeks. #p < 0.05 vs. sham group. ##p <0.01 vs. control SM80s group. n = 6 in sham group; n = 19 in MCAO/RP group at one week; n = 17 in MCAO/RP group at two weeks; n = 18 in MCAO/RP group at four week; and n = 10 in control SM80s group at one week. (e) Quantification of Iba-1 fluorescence (FL) intensity in the ischemic hemispheres at weeks 1, 2, and 4 after MCAO/RP. ****p < 0.0001 vs. vs. sham and 4 W/RP groups; ***p, 0.001 vs. sham group; *p < 0.05 vs. 1 W/RP group. n = 4 in sham group; n = 6 in MCAO/RP groups at one, two, and four weeks. (f) The number of Fe+-cells in the ischemic hemispheres at weeks 1, 2, and 4 after MCAO/RP. ****p < 0.0001 vs. sham group; ***p < 0.001 vs. 4 W/RP group; and *p < 0.05 vs. 2 W/RP group; #p < 0.05 vs. sham group. n = 4 in sham group; n = 6 in MCAO/RP groups at one, two, and four weeks. (g) Pearson’s correlation between the T2*w ΔC values and the mean density of Iba-1 immunofluorescence for the various time points. Correlations: R2 = 0.4213, p = 0.1556, in the sham group; R2 = 0.6344, p = 0.0025, in the 1 W/RP group; R2 = 0.8112, p = 0.0028, in the 2 W/RP group; R2 = 0.0255, p = 0.2465, in the 4 W/RP group. n = 4 in sham group; n = 6 in MCAO/RP groups at one, two, and four weeks.
Figure 6.
Figure 6.
Three-dimensional (3D) mapping of the Iba-1-SM80s within the brain parenchyma (a). T2*w MR images of the brain of a Group 1 rat injected with Iba-1-SM80s seven days after MCAO/RP. The arrows show the ischemia produced by MCAO. Images were obtained from sixteen slices whose locations in the brain ranged from ∼ Bregma +1.70 to –7.64 mm. (b) The Z-score distribution of the Iba1-SM80s in three-dimensions within the brain where the location corresponded to the punctate regions of low signal intensity and the radius and color of the plotted spheres corresponded to the Z-score (See Supplementary Methods for details of the mapping used in Mathematica). Shown are three different views of the same data set, but individually rotated for clarity. Note that the Iba1-SM80s cluster in the region of the infarct and nowhere else within the brain.
Figure 7.
Figure 7.
Inflammatory cytokines expressed by active microglia/macrophage in the infarct (inf) areas bordering with the peri-infarct (peri-inf) areas at one, two, and four weeks (W) after stroke and reperfusion. (a) Double immunostaining shows the expression of YM1 in active microglia (OX-42). DAPI was used to show the nuclei. Scale bar = 50 μm. Statistical Li’s ICQ values for colocalization of YM1 with OX-42 in sham and ischemic hemispheres. *p < 0.05 vs. two weeks, **p < 0.01 vs four weeks. (b) Double immunostaining shows expression of TNF-α and IL-1β in active microglia (Iba-1). Statistical Li’s ICQ values demonstrate the quantification of colocalization of TNF-α and IL-1β with Iba-1 in sham and ischemic hemispheres. TNF-α: **p < 0.05 vs. two weeks, ****p < 0.0001 vs. one  week, ***p < 0.001 vs. one week. IL-1β: **p < 0.01 vs. two and four weeks, ***p < 0.001 vs. one week. (c) Double immunostaining shows expression of TGF-β and IL-10 in active microglia (Iba-1). Statistical Li’s ICQ values demonstrate the quantification of colocalization of TGF-β and IL-10 with Iba-1 in sham and ischemic hemispheres. TGF-β: **p < 0.01 vs. two week, ***p < 0.001 vs. four weeks; ##p < 0.01 vs. two weeks, ### p < 0.001 vs. 4 weeks. IL-10: *P <0.05 vs. 2 and 4 weeks, ***p <0.001 vs. two and four weeks. n = 3 in sham groups, n = 6 in groups of one, two, four weeks reperfusion (RP).

Similar articles

Cited by

References

    1. Yong HYF, Rawji KS, Ghorbani S, et al. The benefits of neuroinflammation for the repair of the injured central nervous system. Cell Mol Immunol 2019; 16: 540–546. - PMC - PubMed
    1. Ceulemans AG, Zgavc T, Kooijman R, et al. The dual role of the neuroinflammatory response after ischemic stroke: modulatory effects of hypothermia. J Neuroinflammation 2010; 7: 74. - PMC - PubMed
    1. Bai Q, Xue M, Yong VW. Microglia and macrophage phenotypes in intracerebral haemorrhage injury: therapeutic opportunities. Brain 2020; 143:1297–1314. - PubMed
    1. Schwartz M, Deczkowska A. Neurological disease as a failure of brain-immune crosstalk: the multiple faces of neuroinflammation. Trends Immunol 2016; 37: 668–679. - PubMed
    1. Jin WN, Shi SX, Li Z, et al. Depletion of microglia exacerbates postischemic inflammation and brain injury. J Cereb Blood Flow Metab 2017; 37: 2224–2236. - PMC - PubMed

Publication types