Suitability of resampled multispectral datasets for mapping flowering plants in the Kenyan savannah
- PMID: 32960879
- PMCID: PMC7508412
- DOI: 10.1371/journal.pone.0232313
Suitability of resampled multispectral datasets for mapping flowering plants in the Kenyan savannah
Abstract
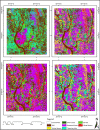
Pollination services and honeybee health in general are important in the African savannahs particularly to farmers who often rely on honeybee products as a supplementary source of income. Therefore, it is imperative to understand the floral cycle, abundance and spatial distribution of melliferous plants in the African savannah landscapes. Furthermore, placement of apiaries in the landscapes could benefit from information on spatiotemporal patterns of flowering plants, by optimising honeybees' foraging behaviours, which could improve apiary productivity. This study sought to assess the suitability of simulated multispectral data for mapping melliferous (flowering) plants in the African savannahs. Bi-temporal AISA Eagle hyperspectral images, resampled to four sensors (i.e. WorldView-2, RapidEye, Spot-6 and Sentinel-2) spatial and spectral resolutions, and a 10-cm ultra-high spatial resolution aerial imagery coinciding with onset and peak flowering periods were used in this study. Ground reference data was collected at the time of imagery capture. The advanced machine learning random forest (RF) classifier was used to map the flowering plants at a landscape scale and a classification accuracy validated using 30% independent test samples. The results showed that 93.33%, 69.43%, 67.52% and 82.18% accuracies could be achieved using WorldView-2, RapidEye, Spot-6 and Sentinel-2 data sets respectively, at the peak flowering period. Our study provides a basis for the development of operational and cost-effective approaches for mapping flowering plants in an African semiarid agroecological landscape. Specifically, such mapping approaches are valuable in providing timely and reliable advisory tools for guiding the implementation of beekeeping systems at a landscape scale.
Conflict of interest statement
The authors have declared that no competing interests exist.
Figures


Similar articles
-
Perceptions of the local beekeepers on the diversity and flowering phenology of the melliferous flora in the community of Xmabén, Hopelchén, Campeche, Mexico.J Ethnobiol Ethnomed. 2019 Mar 8;15(1):16. doi: 10.1186/s13002-019-0296-1. J Ethnobiol Ethnomed. 2019. PMID: 30849998 Free PMC article.
-
Scale-Dependent Waylaying Effect of Pollinators and Pollination of Mass-Flowering Plants.Neotrop Entomol. 2019 Oct;48(5):717-728. doi: 10.1007/s13744-019-00688-3. Epub 2019 May 6. Neotrop Entomol. 2019. PMID: 31062186
-
Exploring the utility of Sentinel-2 MSI and Landsat 8 OLI in burned area mapping for a heterogenous savannah landscape.PLoS One. 2020 May 27;15(5):e0232962. doi: 10.1371/journal.pone.0232962. eCollection 2020. PLoS One. 2020. PMID: 32459824 Free PMC article.
-
Toward the protection of bees and pollination under global change: present and future perspectives in a challenging applied science.Curr Opin Insect Sci. 2019 Oct;35:123-131. doi: 10.1016/j.cois.2019.07.008. Epub 2019 Jul 26. Curr Opin Insect Sci. 2019. PMID: 31473587 Review.
-
Time is honey: circadian clocks of bees and flowers and how their interactions may influence ecological communities.Philos Trans R Soc Lond B Biol Sci. 2017 Nov 19;372(1734):20160256. doi: 10.1098/rstb.2016.0256. Philos Trans R Soc Lond B Biol Sci. 2017. PMID: 28993499 Free PMC article. Review.
Cited by
-
Space and Time Dynamics of Honeybee (Apis mellifera L.)-Melliferous Resource Interactions Within a Foraging Area: A Case Study in the Banja Luka Region (Bosnia & Herzegovina).Biology (Basel). 2025 Apr 15;14(4):422. doi: 10.3390/biology14040422. Biology (Basel). 2025. PMID: 40282287 Free PMC article.
References
-
- Makori DM, Fombong AT, Abdel-Rahman EM, Nkoba K, Ongus J, Irungu J, et al. Predicting Spatial Distribution of Key Honeybee Pests in Kenya Using Remotely Sensed and Bioclimatic Variables: Key Honeybee Pests Distribution Models. ISPRS Int J Geo-Inf. 2017. February 28;6(3):66.
-
- Raina SK, Kioko E, Zethner O, Wren S. Forest Habitat Conservation in Africa Using Commercially Important Insects. Annu Rev Entomol. 2011;56(1):465–85. - PubMed
-
- Kiatoko N, Raina SK, Muli E, Mueke J. Enhancement of fruit quality in Capsicum annum through pollination by Hypotrigona gribodoi in Kakamega, Western Kenya. Entomol Sci. 2014. January 1;17(1):106–10.
-
- Warui MW, Gikungu M, Bosselmann AS, Hansted L. Pollination of Acacia woodlands and honey production by honey bees in Kitui, Kenya. Future Food J Food Agric Soc. 2018. December 12;6(1):40–50.
Publication types
MeSH terms
LinkOut - more resources
Full Text Sources

