. 2020 Sep 22;16(9):e1009043.
doi: 10.1371/journal.pgen.1009043. eCollection 2020 Sep.

AMP1 and CYP78A5/7 act through a common pathway to govern cell fate maintenance in Arabidopsis thaliana

Affiliations

AMP1 and CYP78A5/7 act through a common pathway to govern cell fate maintenance in Arabidopsis thaliana

Olena Poretska et al. PLoS Genet. .

Abstract

Higher plants can continuously form new organs by the sustained activity of pluripotent stem cells. These stem cells are embedded in meristems, where they produce descendants, which undergo cell proliferation and differentiation programs in a spatiotemporally-controlled manner. Under certain conditions, pluripotency can be reestablished in descending cells and this reversion in cell fate appears to be actively suppressed by the existing stem cell pool. Mutation of the putative carboxypeptidase ALTERED MERISTEM PROGRAM1 (AMP1) in Arabidopsis causes defects in the suppression of pluripotency in cells normally programmed for differentiation, giving rise to unique hypertrophic phenotypes during embryogenesis as well as in the shoot apical meristem. A role of AMP1 in the miRNA-dependent control of translation has recently been established, however, how this activity is connected to its developmental functions is not resolved. Here we identify members of the cytochrome P450 clade CYP78A to act in parallel with AMP1 to control cell fate in Arabidopsis. Mutation of CYP78A5 and its close homolog CYP78A7 in a cyp78a5,7 double mutant caused suspensor-to-embryo conversion and ectopic stem cell pool formation in the shoot meristem, phenotypes characteristic for amp1. The tissues affected in the mutants showed pronounced expression levels of AMP1 and CYP78A5 in wild type. A comparison of mutant transcriptomic responses revealed an intriguing degree of overlap and highlighted alterations in protein lipidation processes. Moreover, we also found elevated protein levels of selected miRNA targets in cyp78a5,7. Based on comprehensive genetic interaction studies we propose a model in which both enzyme classes act on a common downstream process to sustain cell fate decisions in the early embryo and the shoot apical meristem.


Conflict of interest statement

The authors have declared that no competing interests exist.

Figures

Fig 1
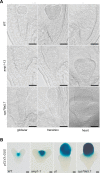
Fig 1. Comparison of AMP1 and CYP78A5 expression domains in the embryo.
(A) pAMP1::AMP1-GFP and pKLU::YFP fluorescence in embryos at the indicated developmental stages. (B) Activity of the CYP78A5-specific pKLU::GUS reporter in embryos at the globular, transition, heart and torpedo stage. (C) pKLU::YFP fluorescence in a torpedo stage embryo. Three consecutive sagittal optical sections through a cotyledon primordium and the adjacent shoot meristem. (D) RNA in situ hybridization using a GFP-specific anti-sense (left) and sense (right) probe in pAMP::AMP1-GFP torpedo stage embryos. (E) RNA in situ hybridization using an AMP1-specific anti-sense (left) and sense (right) probe in pAMP::AMP1-GFP torpedo stage embryos. Size bars represent 10 μm (A) and 50 μm (B, C, D and F).
Fig 2
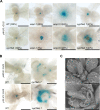
Fig 2. Comparison of AMP1 and CYP78A5 expression domains in the vegetative shoot.
(A) RNA in situ hybridization with longitudinal (left, middle) and transversal (right) shoot sections of 7-day-old pAMP1::AMP1-GFP seedlings using a GFP-specific sense (upper panel) and anti-sense probe (lower panel). (B) Whole mount RNA in situ hybridization with shoots of 7-day-old pAMP1::AMP1-GFP seedlings using a GFP-specific sense (upper panel) and anti-sense probe (lower panel). In the left images the first pair of true leaves were removed. (C) pKLU::GUS activity in shoots of 7-day-old wild-type seedlings. The black arrowhead marks the tip of the shoot meristem area. (D) pKLU::YFP fluorescence in shoots of 6-day-old wild-type seedlings. Images were taken at different angles to the shoot axis; left image: coronal plane, the black arrowhead marks the tip of the shoot meristem area; two images in the middle: transversal plane; right image: sagittal plane. Size bars represent 100 μm (A, B and C) and 50 μm (D).
Fig 3
Fig 3. cyp78a5,7 mutants show a suspensor to embryo conversion phenotype.
(A) Wild-type (upper panel), amp1-13 (middle panel) and cyp78a5,7 (lower panel) embryos at the indicated developmental stages. (B) pCLV3::GUS activity in embryos of the indicated genotypes at the late heart stage. Size bars represent 20 μm.
Fig 4
Fig 4. cyp78a5,7 plants show amp1-related shoot defects.
(A) Shoot phenotypes of wild-type, cyp78a5, amp1-1, amp1-13 and cyp78a5,7 plants at 7 DAG. (B) Scanning electron micrographs of shoot apices of 7-day-old wild-type, cyp78a5, amp1-1, amp1-13 and cyp78a5,7 plants. (C) Quantification of rosette leaf number in seedlings of the indicated genotypes at 7 DAG. (means ± SE of the mean; n ≥ 30). Different letters over the error bars indicate significant differences (P < 0.05; one-way ANOVA followed by Tukey’s multiple comparison tests). (D) Quantification of a SAM surface area of 7-day-old plants; (means ± SE of the mean; n ≥ 4). Different letters over the error bars indicate significant differences (P < 0.05; one-way ANOVA followed by Tukey’s multiple comparison tests). Size bars represent 500 μm (A) and 100 μm (B).
Fig 5
Fig 5. cyp78a5,7 forms ectopic shoot stem cell pools similar to amp1.
(A) pWUS::GUS activity in shoots of the indicated genotypes at 7 DAG. The frequencies of shown GUS-staining patterns are stated. (B) pWUS::GUS and pCLV3::GUS activities in shoots of wild type and cyp78a5,7 at 10 DAG. (C) Scanning electron micrographs of shoot apices of 7-day-old amp1-13 and cyp78a5,7 plants showing the presence of a central leaf-like structure with radial polarity (black asterisk marks the tip of the structure). Leaf primordia were partially to visualize meristematic structures. Size bars represent 500 μm (A,B and C).
Fig 6
Fig 6. Comparative analysis of cyp78a5,7 and amp1-13 transcriptomic responses.
A) Venn diagram showing the number of genes that were differently regulated in cyp78a5,7 and amp1-13 seedlings in comparison with Col-0. B) Graphical representation of the overlapping portion of differentially regulated genes in amp1-13 and cyp78a5,7. (C) Heat map of genes differently regulated in cyp78a5,7 and amp1-13 (2339 DEGs). The heat map was produced by clustering the normalized values using the hierarchical clustering algorithm implemented in Gene Cluster (Euclidean distance and Average linkage). The results were visualized using TreeView3. (D) Graph showing the fractions of hormone-specific marker genes differently regulated in cyp78a5,7 and amp1-13. (E) GO term enrichment analysis of genes differently regulated in cyp78a5,7 and amp1-13 (2339 DEGs).
Fig 7
Fig 7. Seedling phenotypes of amp1, lamp1, cyp78a5 and cyp78a7 mutant combinations.
(A) Shoot phenotypes of indicated genotypes at 14 DAG (except for the quadruple mutant, which was pictured at 12 DAG). A close-up of the quadruple mutant is presented in the upper right corner. (B) Scanning electron micrographs from shoot apices of the indicated genotypes at 7 DAG. In cyp78a5,7 and amp1 lamp1 some of the leaf primordia were removed for better visibility of the meristem structure. Arrowheads mark the callus-like invaginations in the quadruple mutant. (C) Quantification of rosette leaf number in the indicated genotypes at 10 DAG (means ± SE of the mean; n ≥ 35). Different letters over the error bars indicate significant differences (P < 0.05; one-way ANOVA followed by Tukey’s multiple comparison tests). Size bars represent 1 mm (A) and 250 μm (B).
Fig 8
Fig 8. Adult shoot phenotypes of amp1, lamp1, cyp78a5 and cyp78a7 mutant combinations.
(A) Shoot phenotypes of indicated genotypes at 63 DAG. (B) Quantification of rosette leaf number at 63 DAG (means ± SE of the mean; n ≥ 4). Different letters over the error bars indicate significant differences (P < 0.05; one-way ANOVA followed by Tukey’s multiple comparison tests). (C) Comparison of calculated additive and observed fold increase in leaf number in the indicated double mutants compared to wild type based on the data shown in (B). Calculated additive increase: putative fold change, if the leaf number increases of the parental mutants are added up. Observed increase: the fold increase in leaf number in a double mutant in comparison to wild type.
Fig 9
Fig 9. CYP78A5 overexpression suppresses amp1 shoot phenotypes.
(A) Seedling shoot phenotypes of indicated genotypes at 10 DAG. (B) Scanning electron micrographs of shoot meristems from 10-day-old plants of indicated genotypes. (C) Quantification of rosette leaf number in the indicated genotypes at 10 DAG. (means ± SE of the mean; n ≥ 10). Different letters over the error bars indicate significant differences (P < 0.05; one-way ANOVA followed by Tukey’s multiple comparison tests). (D) Graph showing leaf numbers of CYP78A5 over-expressing lines normalized against the respective non-transgenic parental genotypes. Size bars represent 1 mm (A) and 50 μm (B).
Fig 10
Fig 10. AMP1 overexpression does not rescue cyp78a5,7-related shoot phenotypes.
(A) Seedling shoot phenotypes of wild type and 35S::AMP1 at 15 DAG (upper panel) and scanning electron micrographs of their shoot apical meristems at 7 DAG (lower panel). (B) Quantification of rosette leaf number in wild type and 35S::AMP1 at the indicated time points (means ± SE of the mean; n ≥ 10). (C) AMP1 expression analysis in the indicated genotypes by sqRT-PCR. Normalization of cDNA was performed with UBQ5-specific primers. (D) Seedling leaf phenotype of the indicated genotypes at 8 DAG. (E) Seedling shoot phenotypes of indicated genotypes at 10 DAG. (F) Quantification of rosette leaf number in the indicated genotypes at 10 DAG. (means ± SE of the mean; n ≥ 10). Different letters over the error bars indicate significant differences (P < 0.05; one-way ANOVA followed by Tukey’s multiple comparison tests). (G) Adult shoot phenotypes of indicated genotypes at 35 DAG. (H) Seedling shoot phenotypes of indicated genotypes at 12 DAG. (I) Quantification of rosette leaf number in the indicated genotypes at 17 DAG. (means ± SE of the mean; n ≥ 10). Different letters over the error bars indicate significant differences (P < 0.05; one-way ANOVA followed by Tukey’s multiple comparison tests). (J) Seedling shoot phenotypes of indicated genotypes at 15 DAG in the absence (CON) and presence of 10 μM estradiol (ES). (K) Quantification of rosette leaf number in the indicated genotypes at 9 DAG germinated either in the absence (CON) or presence (ES) of 10 μM estradiol (means ± SE of the mean; n ≥ 10). Different letters over the error bars indicate significant differences (P < 0.05; one-way ANOVA followed by Tukey’s multiple comparison tests). (L) Immunoblotting of protein extracts of 10-d-old pER>>AMP1:MYC seedlings grown in the absence or presence of 10 μM estradiol. AMP1:MYC was detected using an anti-MYC antibody. Ponceau S staining of the blot is shown as loading control. Size bars represent 2 mm (A) 1 mm (B and G).

References

    1. Uchida N, Torii KU. Stem cells within the shoot apical meristem: identity, arrangement and communication. Cell Mol Life Sci. 2019;76(6):1067–80. 10.1007/s00018-018-2980-z - DOI - PMC - PubMed
    1. Pilkington M. The Regeneration of the Stem Apex. New Phytologist. 1929;28(1):37–53.
    1. Sussex IM. Regeneration of the Potato Shoot Apex. Nature. 1952;170(4331):755–7. 10.1038/170755a0 - DOI - PubMed
    1. Loiseau JE. Observations et experimentation sur la phyllotaxie et le fonctionnement du sommet vegetatif chez quelques Balsaminacees. Ann Sci Nat Bot Ser. 1959;11:201–14.
    1. Reinhardt D, Frenz M, Mandel T, Kuhlemeier C. Microsurgical and laser ablation analysis of interactions between the zones and layers of the tomato shoot apical meristem. Development. 2003;130(17):4073–83. 10.1242/dev.00596 - DOI - PubMed

Publication types

MeSH terms