. 2020 Nov 2;219(11):e202007158.
doi: 10.1083/jcb.202007158.

Conserved actin machinery drives microtubule-independent motility and phagocytosis in Naegleria

Affiliations

Conserved actin machinery drives microtubule-independent motility and phagocytosis in Naegleria

Katrina B Velle et al. J Cell Biol. .

Abstract

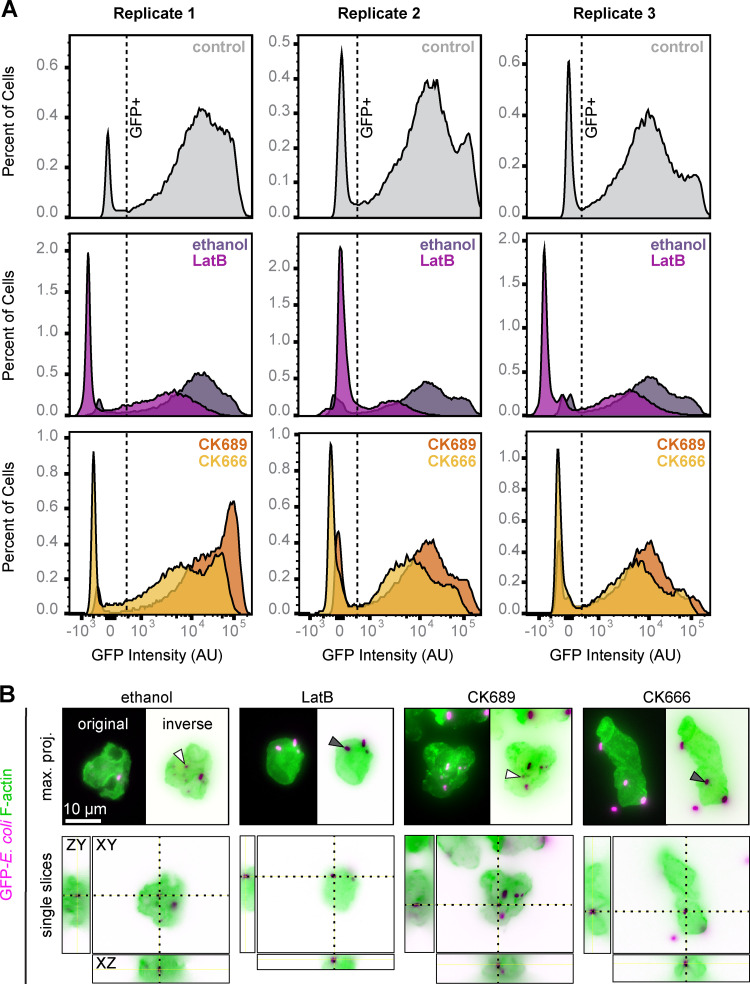
Much of our understanding of actin-driven phenotypes in eukaryotes has come from the "yeast-to-human" opisthokont lineage and the related amoebozoa. Outside of these groups lies the genus Naegleria, which shared a common ancestor with humans >1 billion years ago and includes the "brain-eating amoeba." Unlike nearly all other known eukaryotic cells, Naegleria amoebae lack interphase microtubules; this suggests that actin alone drives phenotypes like cell crawling and phagocytosis. Naegleria therefore represents a powerful system to probe actin-driven functions in the absence of microtubules, yet surprisingly little is known about its actin cytoskeleton. Using genomic analysis, microscopy, and molecular perturbations, we show that Naegleria encodes conserved actin nucleators and builds Arp2/3-dependent lamellar protrusions. These protrusions correlate with the capacity to migrate and eat bacteria. Because human cells also use Arp2/3-dependent lamellar protrusions for motility and phagocytosis, this work supports an evolutionarily ancient origin for these processes and establishes Naegleria as a natural model system for studying microtubule-independent cytoskeletal phenotypes.


Figures

Figure 1.
Figure 1.
Naegleria amoebae employ an actin-based cytoskeletal system, while flagellates use actin and microtubules. (A) This diagram illustrates the evolutionary relationships between Naegleria (top) and other eukaryotes (figure modified from Velle and Fritz-Laylin, 2019). SAR, Stramenopiles, Alveolates, and Rhizaria. (B) A representative amoeba (top) from a growing population and a flagellate (bottom) from a population of differentiated cells were fixed and stained with phalloidin to detect F-actin (green), Tubulin Tracker to visualize tubulin (magenta, γ adjustment of 0.7), and DAPI to label DNA (blue). (C) Changes in actin and microtubule cytoskeletal transcript abundance were calculated using gene expression data collected from amoeba or flagellate populations (also see Fig. S1 A and original data from Fritz-Laylin and Cande, 2010). Positive values indicate higher transcript abundance in amoebae; negative values indicate higher abundance in flagellates (AU = arbitrary units). (D) A subset of data from C highlights the expression pattern of actin assembly factors (also see Fig. S2 B). For graphs in C and D, each bar represents the average relative change in transcript abundance between amoebae and flagellates from three experiments ± SD.
Figure S1.
Figure S1.
Actin and microtubule cytoskeletal gene expression differs between Naegleria amoebae and flagellates. (A) The relative transcript abundance for actin cytoskeletal genes (green), microtubule cytoskeletal genes (magenta), and GAPDH (gray) was calculated using expression data collected from amoeba (0 min into differentiation) or flagellate (80 min into differentiation) populations (original data from Fritz-Laylin and Cande, 2010). The relative transcript abundance in flagellates was subtracted from the level in amoebae to generate the graphs shown in Fig. 1, C and D. The microtubule cytoskeletal genes expressed in amoebae include the mitotic tubulins as well as putative spindle components. (B and C) The actin cytoskeletal transcript levels shown in A were organized such that the relative abundances in amoebae (jade green) and flagellates (salmon) were side by side for each of the indicated genes (numbers are in reference to the Joint Genome Institute accession numbers). Actins are shown in the top panel, nucleators and nucleation promoting factors are grouped in the middle panel, and other actin-binding proteins and motors (myosin heavy chains) are shown in the bottom panel. B is set to a linear scale, while C is on a log scale. For all graphs, each bar represents the average relative transcript abundance from three independent experiments ± SD.
Figure S2.
Figure S2.
Naegleria species encode an extensive repertoire of actin cytoskeletal regulators. (A) N. gruberi (N.g.) and N. fowleri (N.f.) genomes each encode a similar cellular complement of actin cytoskeletal proteins. The first column shows the name of the protein family or complex, the second includes the name of the mammalian homolog (with the exception of Class II formins, which are often found in plants, and Diaphanous Like Formins [DLF], which encompass all diaphanous-related formins), and the final columns indicate the number of genes found encoding these proteins in N. gruberi and N. fowleri, respectively. See Table S2 for accession numbers and sequences. We note that N. gruberi also possesses five WH2-domain–containing proteins not listed above, and no homolog of WASP Interacting Protein was identified in either Naegleria genome. (B) The graph from Fig. 1 D is shown (with all actins and Joint Genome Institute accession numbers listed) for comparisons of expression data with the proteins listed in A. Each bar represents the average relative change in transcript abundance between amoebae and flagellates from three experiments ± SD.
Figure 2.
Figure 2.
Naegleria amoebae build lamellar ruffles and other morphologically distinct structures. (A) Amoebae were fixed and stained with phalloidin to detect actin (green, imaged using SIM) and DAPI to label DNA (magenta, imaged with widefield fluorescence). A single Z-slice (top) and maximum intensity projections (bottom) are shown for representative cells (treated with DMSO as part of a larger dataset in Fig. 3). Actin structures defined in the text are indicated. (B) Amoebae were fixed and processed for SEM. Ruffles are indicated in two representative DMSO-treated cells (also see Fig. S4).
Figure S3.
Figure S3.
Neither cell morphology nor actin polymer content is affected by jasplakinolide (Jasp), phalloidin (Phall), or cytochalasin (CytoD). (A) Cells were incubated in media ± inhibitors or controls for 10 min, then fixed and stained with Alexa Fluor-488–labeled phalloidin to detect F-actin (green) and DAPI to label DNA (magenta) before imaging using widefield fluorescence microscopy. Representative cells are shown. (B–G) Amoebae treated as in A were stained only with Alexa Fluor-488–labeled phalloidin (with the exception of an unstained control, shown in B) before analysis by flow cytometry. Representative histograms of F-actin staining intensity compare drug treatments with respective controls for one of three biological replicates. (H) Average intensities calculated from E–G were normalized to the stained control (B), which was set to 1 (dashed line). Each point represents the average normalized fluorescence intensity of F-actin staining (experimental replicates are coordinated by shape), and lines indicate the mean of three experimental replicates ± SD. Statistical significance was determined using an ordinary ANOVA followed by Tukey’s multiple comparison test. (I) Images like those shown in A were analyzed with the dataset presented in Fig. 3. Values are averages (Avg) ± SD from three independent replicates, each of which encompassed 50 cells per treatment condition. No statistical differences were found comparing jasplakinolide, phalloidin, or cytochalasin D treatments with controls using an ordinary ANOVA followed by Tukey’s multiple comparison test. *The percentage of cells with actin spheres was calculated for one representative dataset and, due to large variability between control samples, was not quantified for the remaining datasets. AU, arbitrary units; RFU, relative fluorescence units; SM+CK, SMIFH+CK-666 combined treatment.
Figure S4.
Figure S4.
Arp2/3 inhibition disrupts the formation of lamellar ruffles. Amoebae were treated with DMSO or CK-666 and then fixed and processed for SEM. Three representative cells for each condition were selected from the same experiment shown in Fig. 2.
Figure 3.
Figure 3.
Small-molecule inhibitors of the actin cytoskeleton alter Naegleria morphology. (A) Small-molecule inhibitors target actin dynamics. (B) Cells were incubated in media ± inhibitors for 10 min, then fixed and stained with phalloidin to detect F-actin. Total fluorescence was measured using flow cytometry. One representative histogram (left) is shown from a single replicate comparing LatB with its vehicle control (also see Fig. S3). Average F-actin intensities (right) were normalized to the stained control for all conditions. Each point represents the average normalized fluorescence of 20,000 cells from one experimental replicate, with each experimental replicate represented by a different shape. (C) Cells were treated as in B, but were fixed and stained for microscopy using DAPI to label DNA in addition to phalloidin. Cells were analyzed using SIM and widefield fluorescence (Fig. S3). Maximum intensity projections and single Z planes from SIM are shown for representative cells, and filopodia on a SMIFH2-treated cell are magnified in the inset (scale bar, 1 µm). (D–H) 50 cells/condition (imaged using widefield fluorescence) for three independent replicates (150 cells total/treatment) were used to quantify cell area (D) and circularity (E) or the percentage of cells with ≥1 ruffle (F), ≥1 filopodium (G), and ≥10 puncta (H). Small gray symbols represent individual cells, and larger symbols represent the averages for experimental replicates (coordinated by shape). For graphs in B (right) and D–H, black lines represent the means from experimental replicates ± SD, and statistical significance was determined using an ordinary ANOVA and Tukey’s multiple comparison test. Dashed lines indicate the control value. (I) Pixel intensity line scans for F-actin staining were drawn in a single Z-plane bisecting the cell edge, and values were normalized to the average intensity inside the cell, which was set to 1. Curves represent the average relative intensity ± SD for three experimental replicates, each encompassing five cells (also see Fig. S7). AU, arbitrary units; Max, maximum; RFU, relative fluorescence units; SM+CK, SMIFH2+CK-666 combined treatment.
Figure S5.
Figure S5.
Naegleria actin retains conserved binding sites for small-molecule inhibitors of actin dynamics. A multiple sequence alignment was generated to compare N. gruberi’s (N.g.’s) most highly expressed actin protein sequence with that of other eukaryotic actins (see Table S3 for sequences and ID numbers). This alignment includes actin sequences from other Discobids, N. fowleri (N.f.) and Trypanosoma cruzi (T.c.); Metamonads, Giardia intestinalis (G.i.) and Trichomonas vaginalis (T.v.); Plants, Chlamydomonas reinhardtii (C.r., including NAP1 [N] and IDA5 [I]) and Ectocarpus siliculosus (E.s.); Stramenopiles, Thalassiosira pseudonana (T.p.); Alveolates, Toxoplasma gondii (T.g.), Plasmodium falciparum (P.f., including actin-1 and actin-2), and Tetrahymena thermophila (T.t.); Amoebozoa, Dictyostelium discoideum (D.d.), Entamoeba histolytica (E.h.), and Acanthamoeba castellanii (A.c.); and Opisthokonts, Saccharomyces cerevisiae (S.c.), Schizosaccharomyces pombe (S.p.), and Oryctolagus cuniculus (O.c.). Sequences were aligned using T-Coffee (Notredame et al., 2000) with defaults (Blosum62 matrix, gap open penalty = −50, gap extension penalty = 0) in Jalview, and residues were colored based on conservation (grayscale) or to highlight differences in amino acids within drug-binding sites (ILVAM: salmon; FWY: tangerine; KRH: blue; DE: red; STNQ: lime; PG: raspberry; and C: yellow). Bars indicate important residues for drug binding, and binding sites are abbreviated as follows: L, latrunculin; P, phalloidin; C, cytochalasin; J, jasplakinolide.
Figure S6.
Figure S6.
Actin cytoskeletal drugs bind sequences that are conserved in Naegleria proteins. (A) The alignment shown in Fig. S5 was used to calculate the percent identity of actin protein sequences from representative eukaryotes. Values indicating higher conservation are highlighted in green, and values indicating less conservation are highlighted in lilac. Arp1 from rabbit was included for comparison to an actin-related protein (shown in gray). (B) Drug binding sites on mammalian actin (Faulstich et al., 1993; Morton et al., 2000; Nair et al., 2008; Pospich et al., 2017) are shown (gray) in comparison to Giardia actin and Naegleria actin. Identical residues are shown in green, non-identical residues are in lilac, and the numbers above each column indicate the location of the residue in the rabbit actin sequence. Giardia actin is shown as an example due to its low percent identity to mammalian actin, as well as the documented ineffectiveness of actin inhibitors (Paredez et al., 2011). A question mark indicates unknown information. (C) Residues of Arp2 and Arp3 that exist within 5 Å of the CK-666 binding site on Bos taurus (gray) Arp2/3 complex (PDB 3UKR; Baggett et al., 2012) were compared between model organisms and Naegleria. Identical residues are shown in green, non-identical redidues are highlighted in lilac. (D) FH2 domains from six SMIFH2-sensitive formins in diverse model organisms (including Mus musculus and Arabidopsis thaliana) were used to generate an MSA, and the percent identity was calculated in comparison to each other and compared with the FH2 domains of Naegleria’s 14 formins. Higher percent identity values are shown in green, lower values are shown in lilac. (E) SMIFH2-sensitive formins shown in D were used to calculate an FH2 domain consensus sequence (gray). Positions with at least 75% identity among SMIFH2-sensitive FH2 domains are shown, with positions of Naegleria FH2 domains that are identical to the consensus shown in green. The total percent identity to the consensus sequence is shown to the right, with higher percent identities in green, and lower percent identities in lilac. All accession numbers for the sequences used to generate this figure are listed in Table S3.
Figure S7.
Figure S7.
CK-666 treatment enhances the relative concentration of cortical to intracellular F-actin. (A) 15 amoebae treated with the Arp2/3 complex inhibitor CK-666 from the experiments described in Fig. 3 were imaged using widefield fluorescence microscopy. A line with a width of 50 px, representing 3.25 µm, was drawn perpendicular to the cell edge on a random, relatively straight part of each cell in a Z plane in which the cell edge was in focus. Panels i–iii: examples of these regions on cells are shown, with one example from each of the three biological replicates analyzed. Panel iv: the regions of interest of six additional examples are shown. (B) The pixel intensities along the long axis of each box shown in A were normalized to the average pixel intensity of an area inside the cell, which was set to 1. These normalized intensities were plotted against the distance, with 0 indicating the cell edge (dashed line). The horizontal line indicates the maximum fluorescence intensity at the cell edge. The first three panels (i–iii) correspond to the images in A i–iii, and the rightmost “all” panel depicts all the data used to generate the plot in Fig. 3 J. (C and D) Images mirror A and B, respectively, using the inactive control CK-689. AU, arbitrary units.
Figure 4.
Figure 4.
Inhibition of actin nucleation pathways impairs Naegleria cell crawling. (A) Crawling cells were imaged using phase/contrast microscopy for 5 min. After 5 min (at t = 0 min), an equal volume of each of the indicated inhibitors or controls was added (diluted in buffer; “control” indicates buffer alone), and imaged for 5 min. Arrowheads indicate the position of a representative cell over time. (B) Cells were treated as in A. 20 randomly selected cells from the center of the field of view at t = 0 were tracked to calculate average speeds before and after treatment. Each point represents the speed of a cell before treatment (x axis) and after treatment (y axis). The dashed line indicates no change. Three experimental replicates are shown using different shapes. Two data points are off the x axis: LatB (79.3, 12.9) and CK-666 (60.8, 23.6). (C) The data collected in B were used to calculate the change in cell speed after treatment (n = 3, 20 cells/trial, 60 cells total/condition). The dashed line is set to zero. (D) Data from B were plotted for 20 cells from one representative experiment. Tracks before treatment (pre-treat; gray) have the −5 min time point at the origin, while tracks after treatment (in color) have the t = 0 time point at the origin (also see Fig. S8). (E) Directional persistence was calculated for each post-treatment cell tracked in B by dividing the maximum displacement from the start by the path length. The dashed line indicates the average from the control. For graphs in C and E, small gray symbols represent the values of single cells, and larger symbols represent experimental averages. Black lines indicate the mean ± SD calculated from three experimental replicates, and statistical significance was determined using an ordinary ANOVA and Tukey’s multiple comparison test. (F) Cells were imaged using differential interference contrast microscopy and treated with CK-666 during imaging. Panels show time lapse images of a representative cell generating a filopodium-like protrusion ∼30 min after treatment. (G) Additional cells treated and imaged as in F were fixed and stained on the microscope after 2 min and 18 s of treatment (top: cell 2, short incubation time) or 53 min (bottom: cell 3, long incubation time). Cells were simultaneously fixed, permeabilized, and stained with DAPI to detect DNA (magenta) and phalloidin to detect F-actin (green). Times after treatment for F and G are in minutes:seconds.
Figure S8.
Figure S8.
Supplemental motility data. (A) Tracking data show cell movements from the experiments in Fig. 4 (the same SMIFH2 and DMSO graphs are shown in Fig. 4 D and reproduced here for comparison purposes). Cell tracks show movement 5 min before (Pre-treat., gray traces) and 5 min after (colored traces) treatment. (B) In addition to the inhibitors shown in Fig. 4, each experimental replicate also included cells treated with jasplakinolide (Jasp), phalloidin, and cytochalasin D (CytoD). Each small gray symbol represents the change in speed of a single cell after treatment, while larger symbols represent the averages from each experimental replicate, coordinated by shape (circles, squares, and triangles). (C) Cells were imaged as in Fig. 4; after 5 min of imaging in buffer, cells were treated with DMSO, SMIFH2, CK-666, or a cocktail of SMIFH2 and CK-666 (SM+CK) and imaged for an additional 5 min. 20 randomly selected cells from the center of the field of view at the time of treatment were tracked to calculate average speeds before and after treatment. Each point represents the speed of a cell before treatment (plotted on the x axis) and after treatment (plotted on the y axis). Three experimental replicates are indicated using different shapes (squares, triangles, and circles). The dashed line has a slope of 1, indicating where cells would fall if the speed was unchanged. (D) The data collected from experiments in C were used to calculate the change in cell speed after treatment. Each smaller gray symbol represents a single cell, while larger symbols represent the averages from each experimental replicate, with shapes representing independent replicates. (E) Directional persistence was calculated for each post-treatment cell tracked in C by dividing the maximum displacement from the start of the track by the total path length. Each small gray symbol represents the persistence of a single cell, while larger symbols represent experimental averages, coordinated by shape. For B, D, and E, black lines indicate the mean ± SD calculated from the three experimental replicates, and statistical significance was determined using an ordinary ANOVA followed by Tukey’s multiple comparison test.Pre-treat., before treatment.
Figure 5.
Figure 5.
Phagocytosis is less efficient following Arp2/3 complex inhibition. (A) Amoebae were starved for 1 h, then incubated with controls or inhibitors and GFP-expressing E. coli for 45 min. Cells were then fixed and imaged. GFP intensity is shown using an inverted LUT (lookup table; top) and in magenta (bottom). (B) Cells were treated as in A, then the GFP intensities of 30,000 cells/condition were measured by flow cytometry. Representative histograms display the percentage of cells plotted against GFP intensities for ethanol- and LatB-treated cells (left) or CK-689– and CK-666–treated cells (right). Plots are from one of three experimental replicates (also see Fig. S9). (C) The median fluorescence intensity was calculated from experiments shown in B. For each replicate (coordinated by shape; circles, triangles, and squares), fluorescence intensity of control and treated cells was normalized to a buffer-only control. (D) The population of buffer-only control cells was used to gate a GFP-positive population for each experimental replicate. Each point represents the percentage of cells falling within the GFP-positive gate. For graphs in C and D, lines indicate the mean of three experimental replicates (which are coordinated by shape) ± SD. The dashed lines are set to the average from the control sample. Statistical significance was determined using an ordinary ANOVA and Tukey’s multiple comparison test. AU, arbitrary units; RFU, relative fluorescence units.
Figure S9.
Figure S9.
LatB and CK-666 each impair Naegleria’s phagocytosis. (A) Cells were starved, treated with inhibitors or controls, and fixed as in Fig. 5. Then, the GFP intensities of 30,000 cells per condition were measured by flow cytometry. Cells were initially gated to select only intact, single cells. Then, an untreated control from each replicate (top row) was used to create a gate for GFP+ cells (dashed line). Histograms display the percentage of cells plotted against GFP intensities for ethanol- and LatB-treated cells (middle row) or CK-689– and CK-666–treated cells (bottom row). The histograms from replicate 2 are also shown in Fig. 5, with y axes set to the same scale. (B) Cells were starved and then mixed with GFP-expressing E. coli (shown in magenta) for 1 h. Cells were fixed and stained with Alexa Fluor-568–labeled phalloidin to detect F-actin (green) and imaged using widefield fluorescence microscopy. Maximum intensity projections (max. proj.; top) and single xy, zy, and xz slices are shown intersecting nonintact (white arrowheads) and intact (gray arrowheads) bacteria associated with representative cells. AU, arbitrary units.

Comment in

Similar articles

Cited by

References

    1. Abercrombie M. 1980. The Croonian Lecture, 1978- The crawling movement of metazoan cells. Proc. R. Soc. Lond. B Biol. Sci. 207:129–147. 10.1098/rspb.1980.0017 - DOI
    1. Abercrombie M., Heaysman J.E., and Pegrum S.M.. 1970. The locomotion of fibroblasts in culture. I. Movements of the leading edge. Exp. Cell Res. 59:393–398. 10.1016/0014-4827(70)90646-4 - DOI - PubMed
    1. Akil C., and Robinson R.C.. 2018. Genomes of Asgard archaea encode profilins that regulate actin. Nature. 562:439–443. 10.1038/s41586-018-0548-6 - DOI - PubMed
    1. Altschul S.F., Gish W., Miller W., Myers E.W., and Lipman D.J.. 1990. Basic local alignment search tool. J. Mol. Biol. 215:403–410. 10.1016/S0022-2836(05)80360-2 - DOI - PubMed
    1. Baggett A.W., Cournia Z., Han M.S., Patargias G., Glass A.C., Liu S.Y., and Nolen B.J.. 2012. Structural characterization and computer-aided optimization of a small-molecule inhibitor of the Arp2/3 complex, a key regulator of the actin cytoskeleton. ChemMedChem. 7:1286–1294. 10.1002/cmdc.201200104 - DOI - PMC - PubMed

Publication types

MeSH terms

Substances